Download presentation
Presentation is loading. Please wait.

1
Dairy Marketing Dr. Roger Ginder Econ 338a Fall 2009 Lecture # 5

2
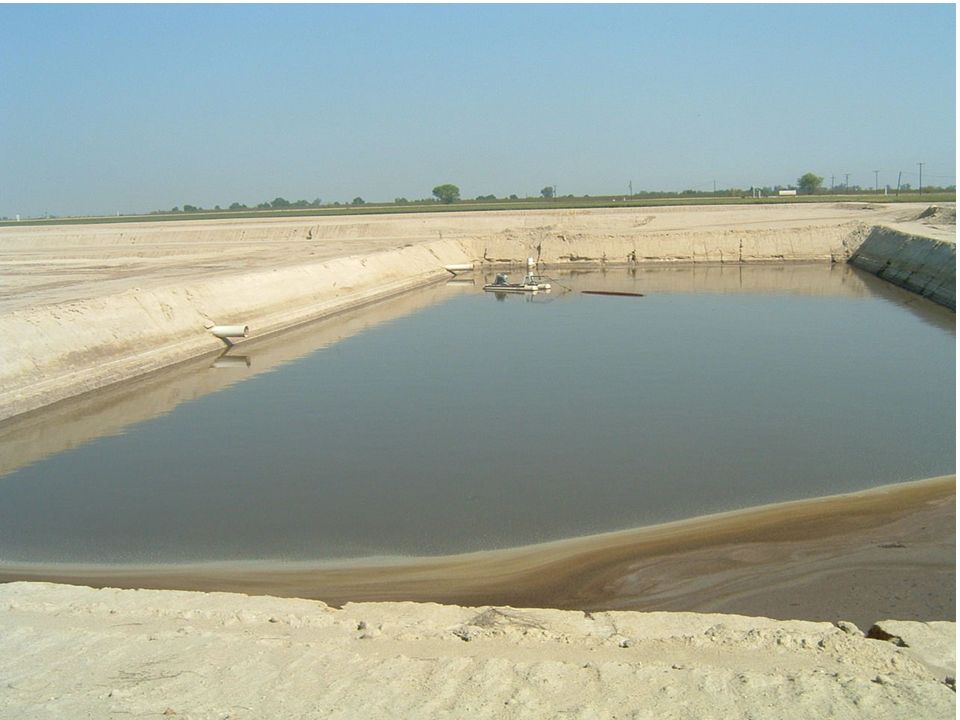
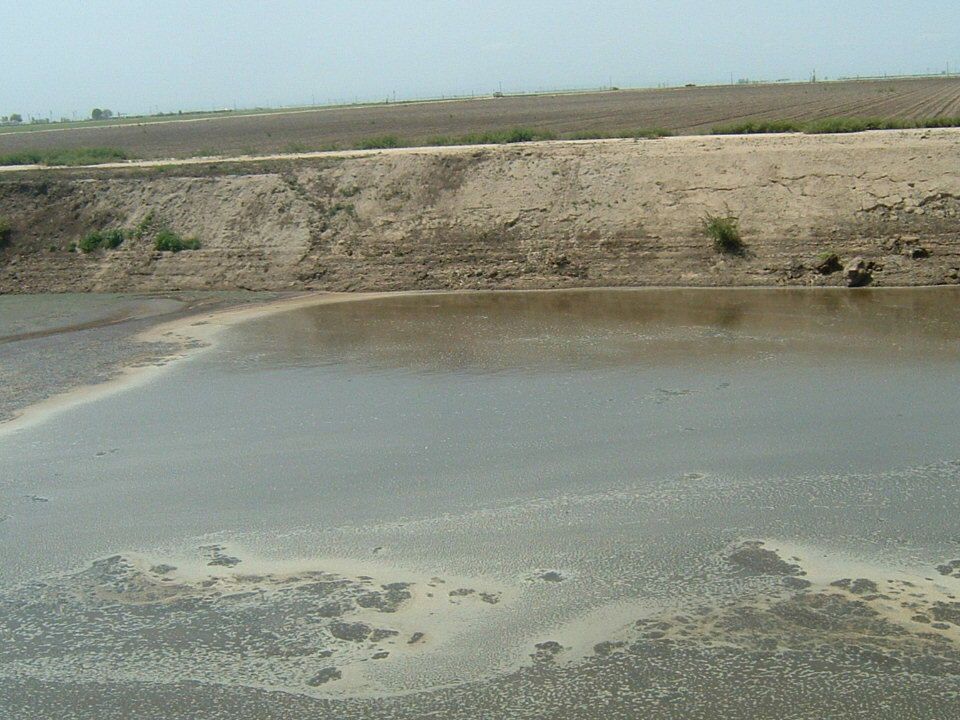
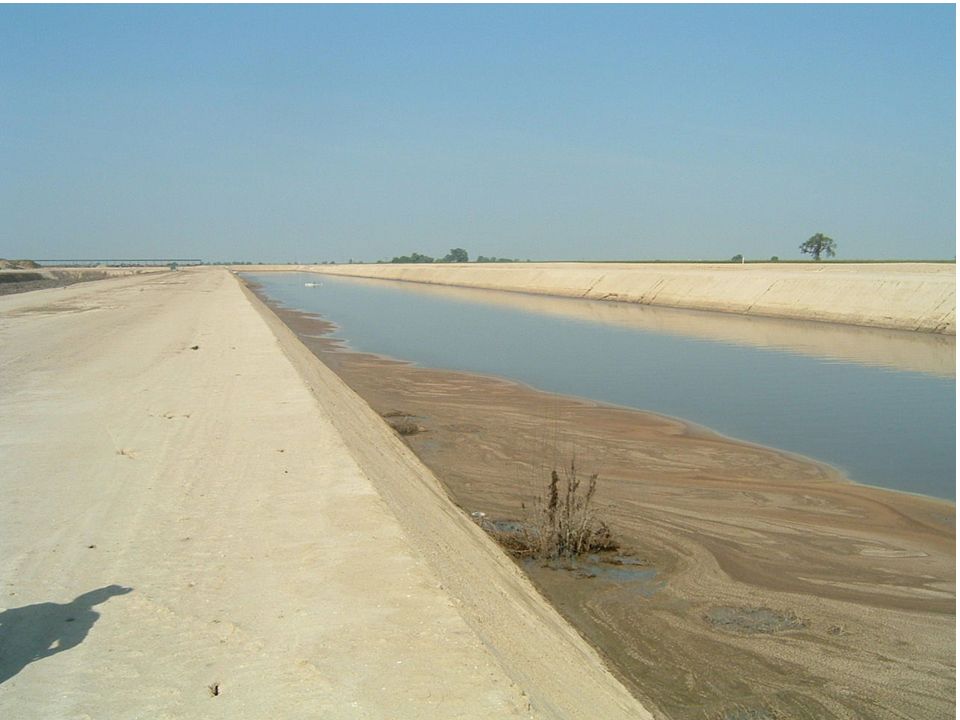
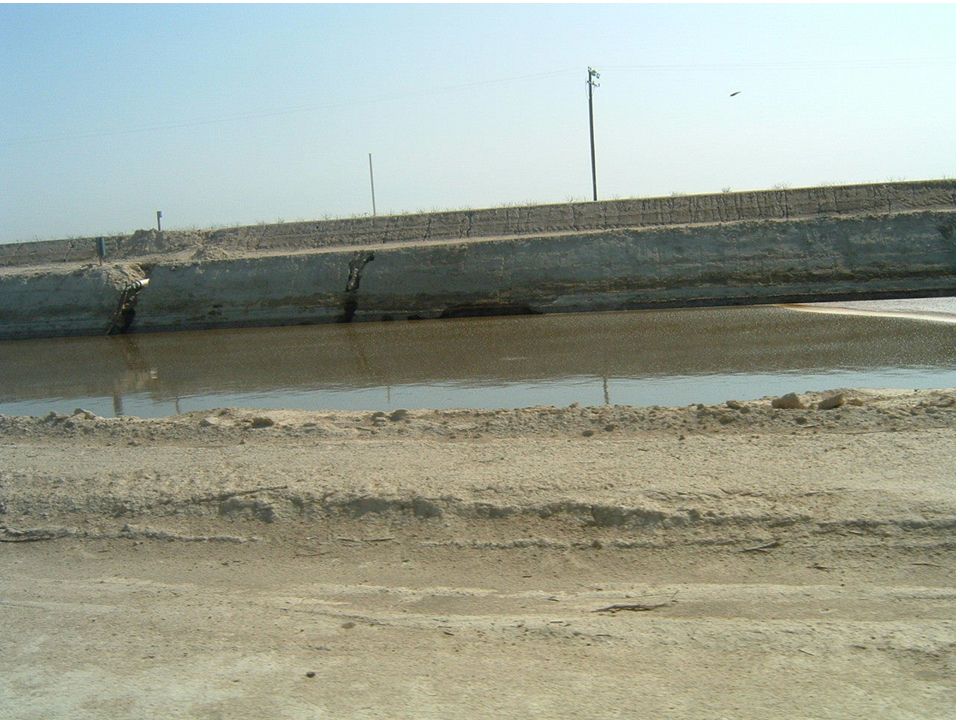
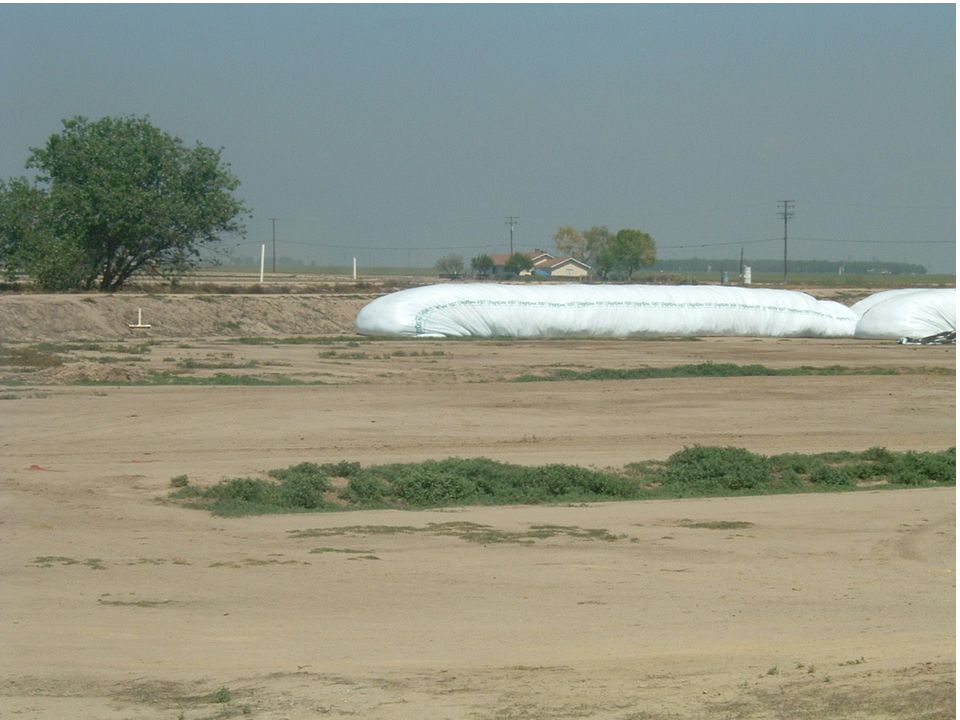
DAIRY PRODUCTION METHODS AND FACILITIES Manure Handling in “Modern” Free Stall Operations in the Arid Areas – More Water is used than in drylot – Water May Be Used Multiple Times – Flush Water Has to be Managed To Meet Environmental Regs.

12
DAIRY PRODUCTION METHODS AND FACILITIES Advantages Modern Free Stall Facilities In Arid and Semi Arid Areas – Low labor – Cow comfort and high milk quality – Capital cost/cow $3,300 - $3,600 (including cow and land) – Expansion is more practical
 – Expansion is more practical")
13
DAIRY PRODUCTION METHODS AND FACILITIES Problems -- Modern Free Stall Systems – Large size and scale requirements to reach low average costs – Manure handling in humid climates Oder Control in warmer months Freezing can create problems during winter months in UMW Limited time window for manure application requires storeage

14
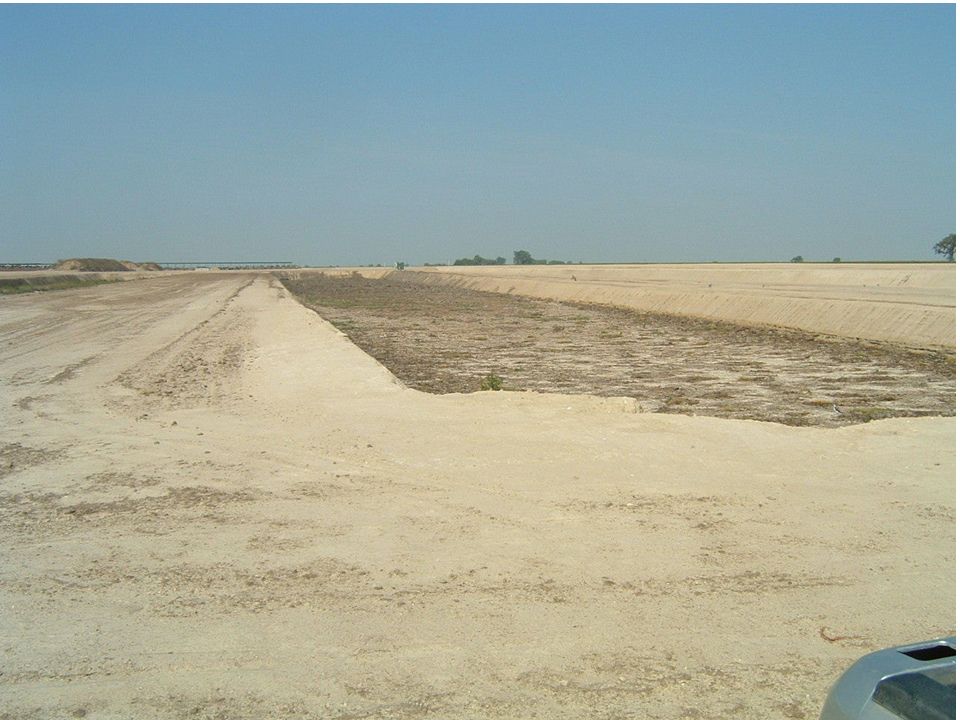
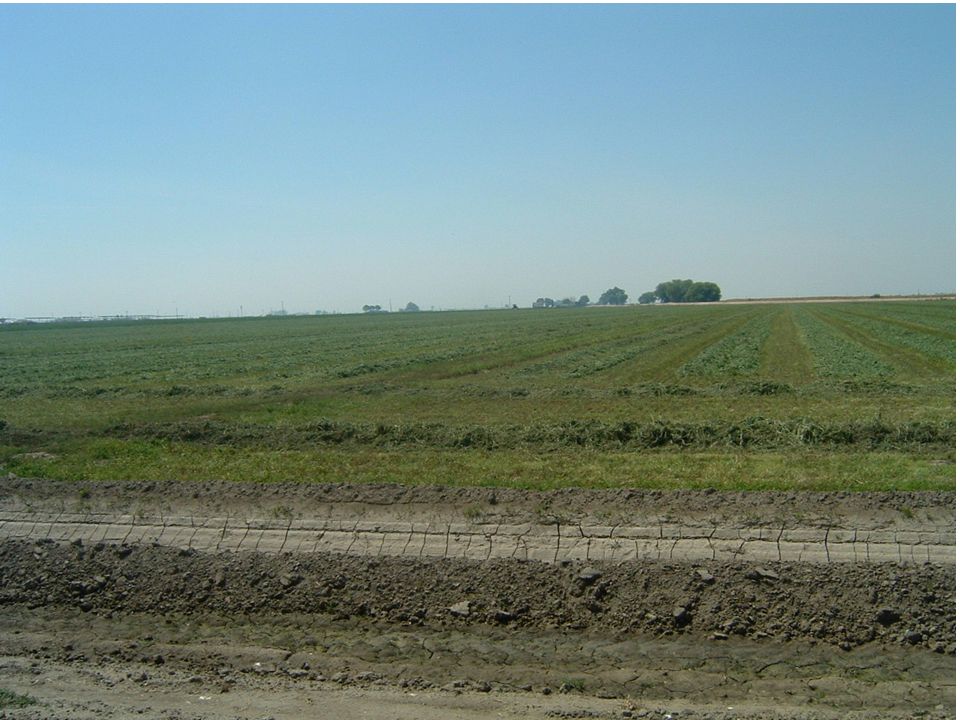
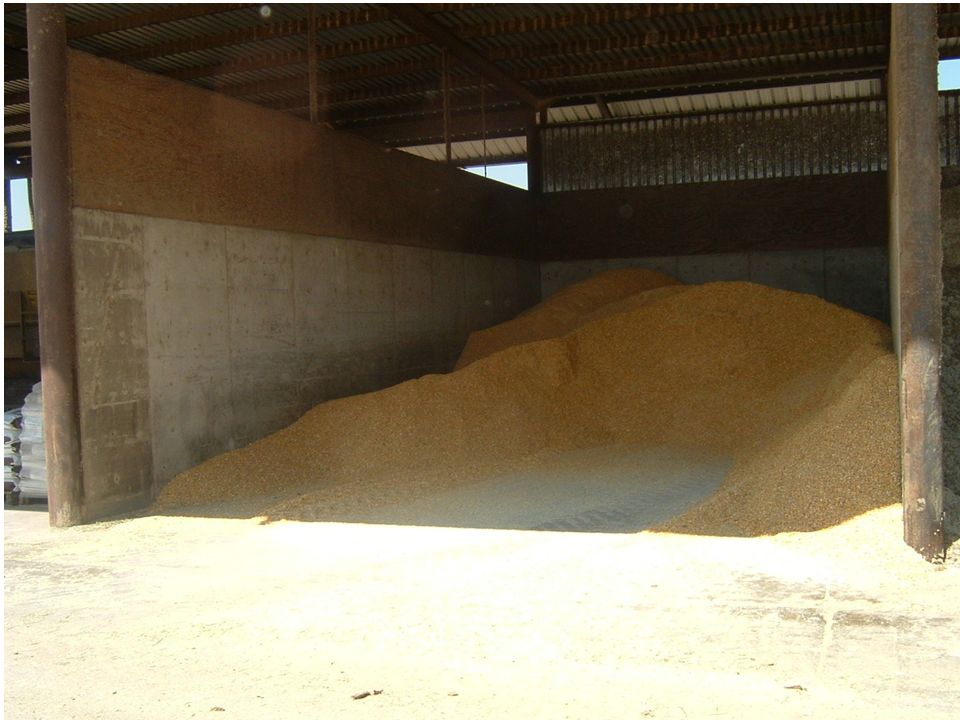
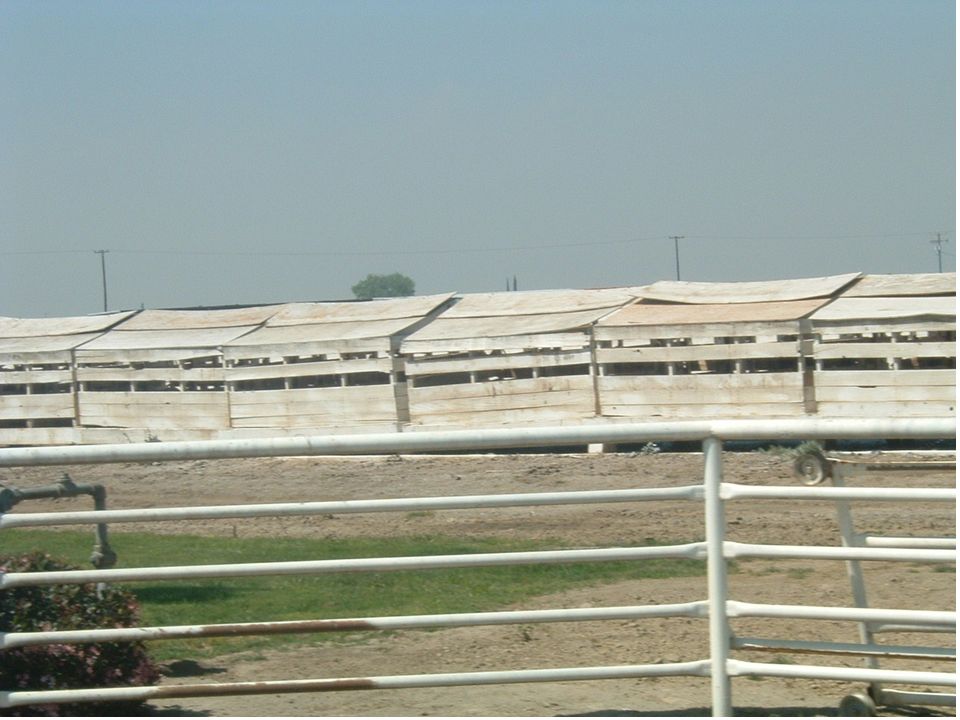
DAIRY PRODUCTION METHODS AND FACILITIES “Modern” dry lot system (in arid and semi arid areas – Confinement in paddocks (open) – Dry manure waste management – Modern parlors
 – Dry manure waste management – Modern parlors")
17
DAIRY PRODUCTION METHODS AND FACILITIES Advantages --- Modern Dry Lot – Low labor cost – Capital cost/cow - $3,000 (include cow and land) – No investment in free stall ($850/cow) Problems --- Modern Dry Lot – Large scale requirements – Climate limitations in some areas – Heat can reduce production – Unusually wet conditions some years
 – No investment in free stall ($850/cow) Problems --- Modern Dry Lot – Large scale requirements – Climate limitations in some areas – Heat can reduce production – Unusually wet conditions some years")
18
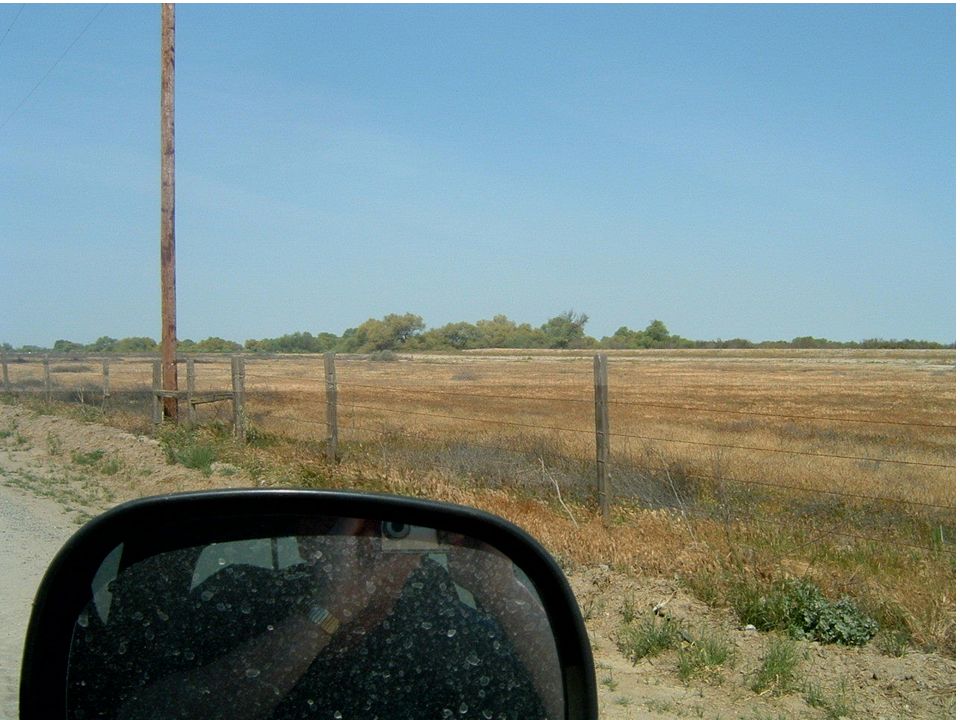
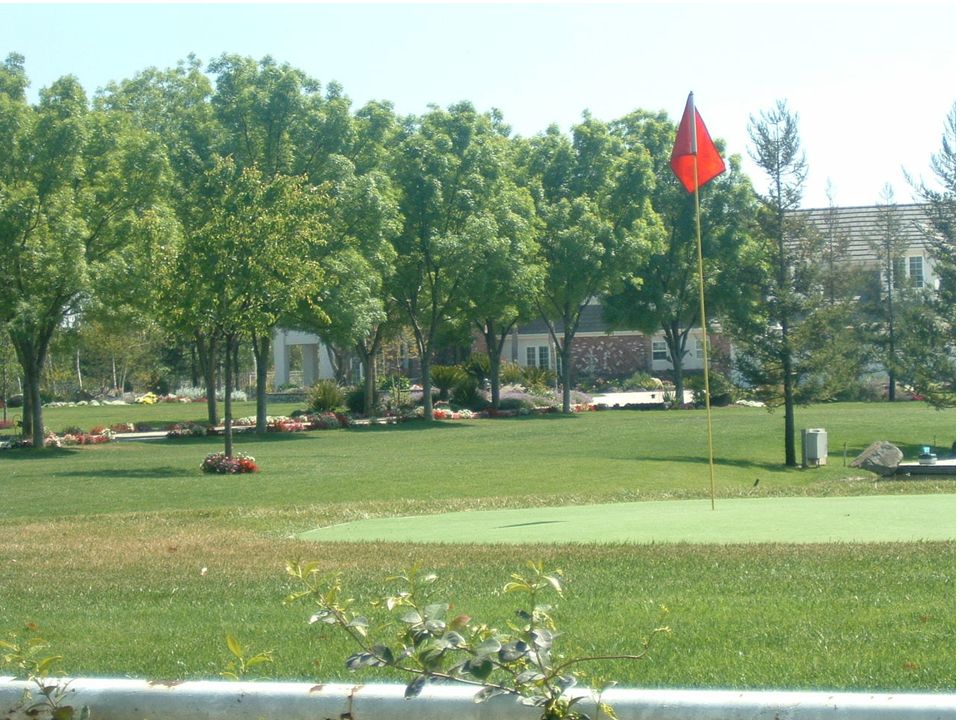
DAIRY PRODUCTON METHODS AND FACILITIES “New Zealand” rotational grazing system – Paddocks of high grade pasture – Rotated grazing – Little/no concentrates fed Advantages – Low concentrate feed cost – Less labor and machinery for forage production – Low housing costs

19
DAIRY PRODUCTON METHODS AND FACILITIES Problems---New Zealand Rotational System – Lower production of milk per cow – Muddy seasons can be a problem – In cold climates, some of the advantages in housing and forage are lost

20
DAIRY PRODUCTON “PLANT” CHARACTERISTICS Approximately how much of the total milk supply is produced in the various production systems? How do farm numbers and production relate?

21
U.S. Dairy Farms: Percent of Operations vs. Percent of Milk Production for Various Herd Sizes, 2001 Percentages may not add to 100% due to rounding. Source: NASS, USDA, on-line database, 5/20/02

22
U.S. Dairy Farms: Percent of Operations vs. Percent of Milk Production for Various Herd Sizes, 2004 Percentages may not add to 100% due to rounding. Source: NASS, USDA, on-line database, 3/21/05

23
U.S. Dairy Farms: Percent of Operations vs. Percent of Milk Production for Various Herd Sizes, 2007 Percentages may not add to 100% due to rounding. Source: NASS, USDA, on-line database, 3/21/08

24
Iowa Dairy Farms: Percent of Operations vs. Percent of Milk Production for Various Herd Sizes, 1999 Source: NASS, USDA, Milk Production, 2/16/2000 Percentages may not add to 100% due to rounding.

25
Iowa Dairy Farms: Percent of Operations vs. Percent of Milk Production for Various Herd Sizes, 2001 Percentages may not add to 100% due to rounding. Source: NASS, USDA, on-line database, 5/20/02

26
Iowa Dairy Farms: Percent of Operations vs. Percent of Milk Production for Various Herd Sizes, 2004 Percentages may not add to 100% due to rounding. Source: NASS, USDA, on-line database, 3/23/05

27
Iowa Dairy Farms: Percent of Operations vs. Percent of Milk Production for Various Herd Sizes, 2007 Percentages may not add to 100% due to rounding. Source: NASS, USDA, on-line database, 7/23/08

28
California Dairy Farms: Percent of Operations vs. Percent of Milk Production for Various Herd Sizes, 2004 Percentages may not add to 100% due to rounding. Source: NASS, USDA, on-line database, 3/23/05

29
California Dairy Farms: Percent of Operations vs. Percent of Milk Production for Various Herd Sizes, 2007 Percentages may not add to 100% due to rounding. Source: NASS, USDA, on-line database, 3/23/05

30
DAIRY PRODUCTON “PLANT” CHARACTERISTICS Would you expect these trends toward more concentrated production to continue? What factors might tend to make the trends continue? What factors might tend to slow the trends?

31
DAIRY PRODUCTON “PLANT” CHARACTERISTICS Differences in input procurement practices exist among: – Production systems – Regions – Scale of operation

32
DAIRY PRODUCTON “PLANT” CHARACTERISTICS Midwestern tie stall and “traditional” systems – Home produced forage and grain – Purchased concentrates – Diversified farming operations – Often combined with non-dairy enterprises – Significant management and capital invested in land /non-dairy activities

33
DAIRY PRODUCTON “PLANT” CHARACTERISTICS Mid Atlantic and Piedmont areas tie stall, traditional and modern operations – Significant home produced forage and grain but some purchased – Purchased concentrates – Specialized dairy operations – Management and capital more focused on dairy and related activities

34
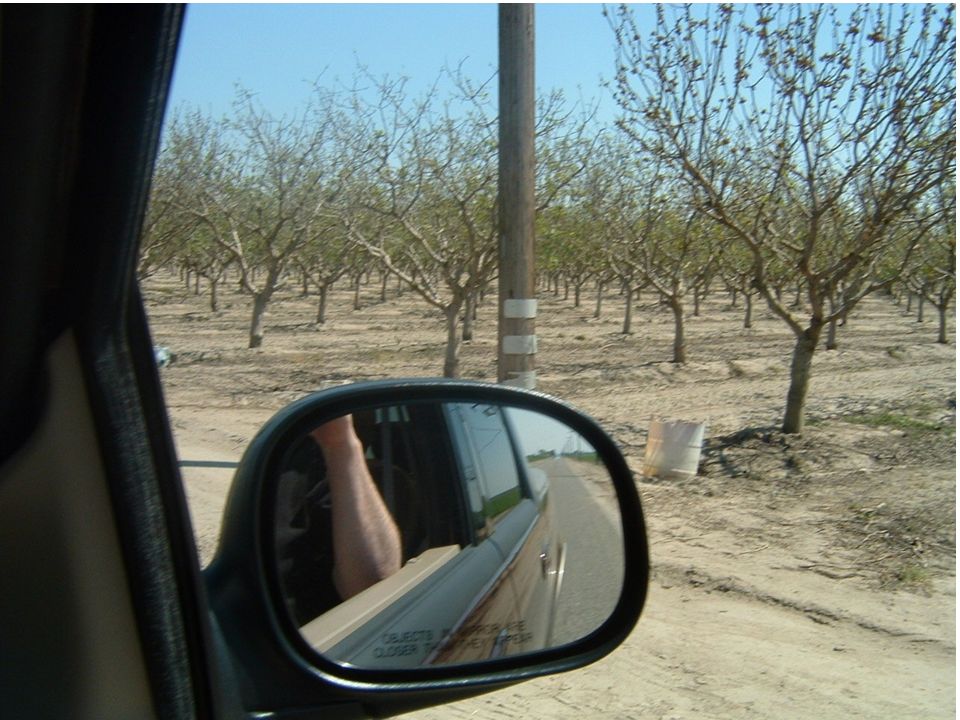
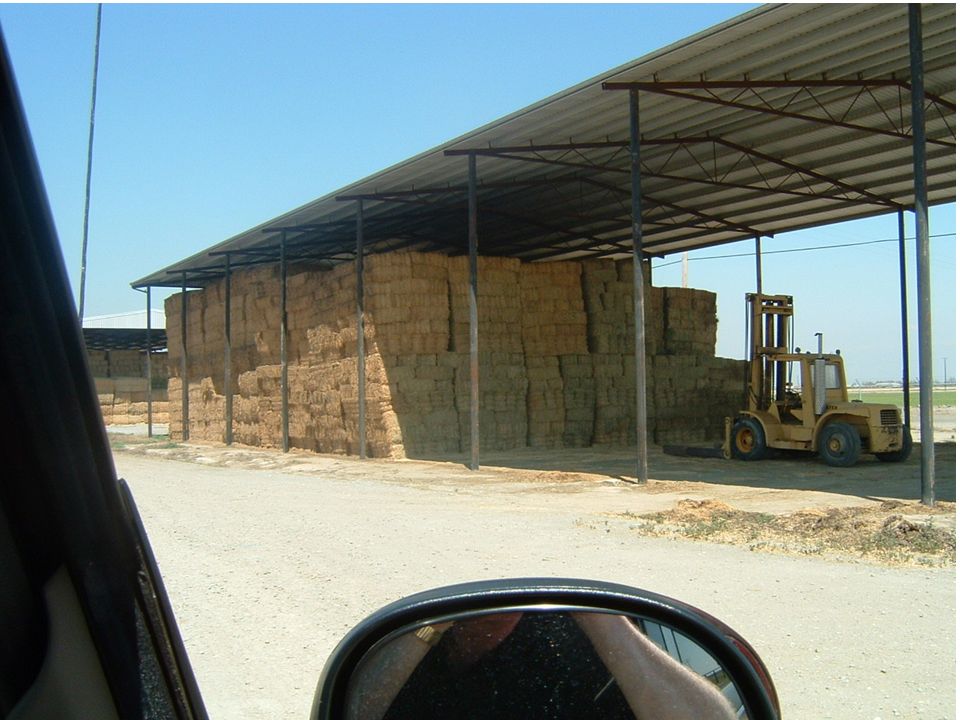
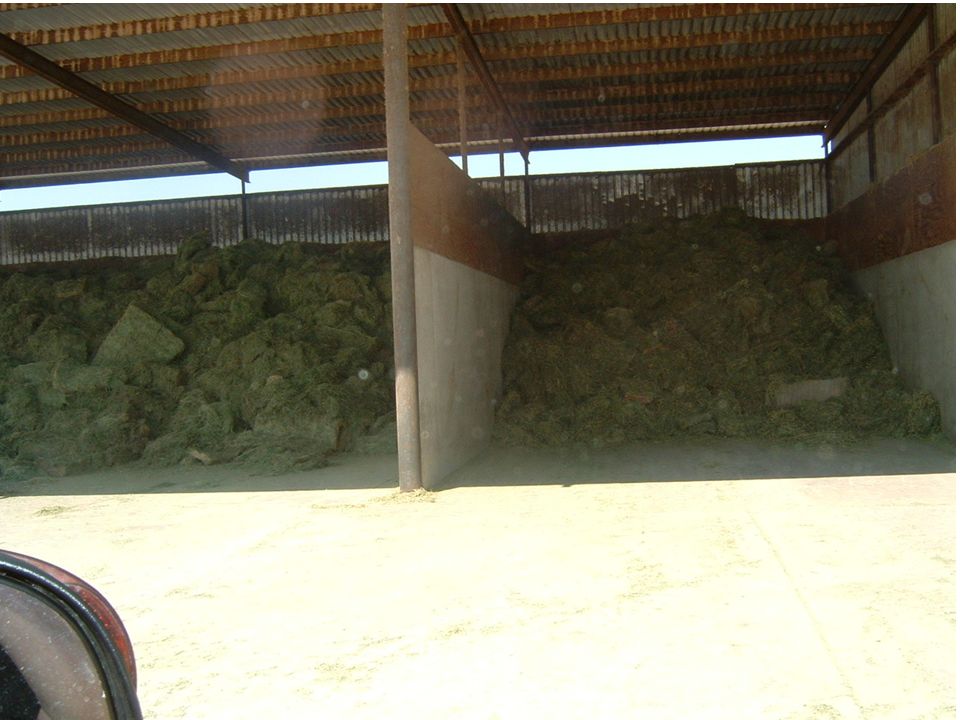
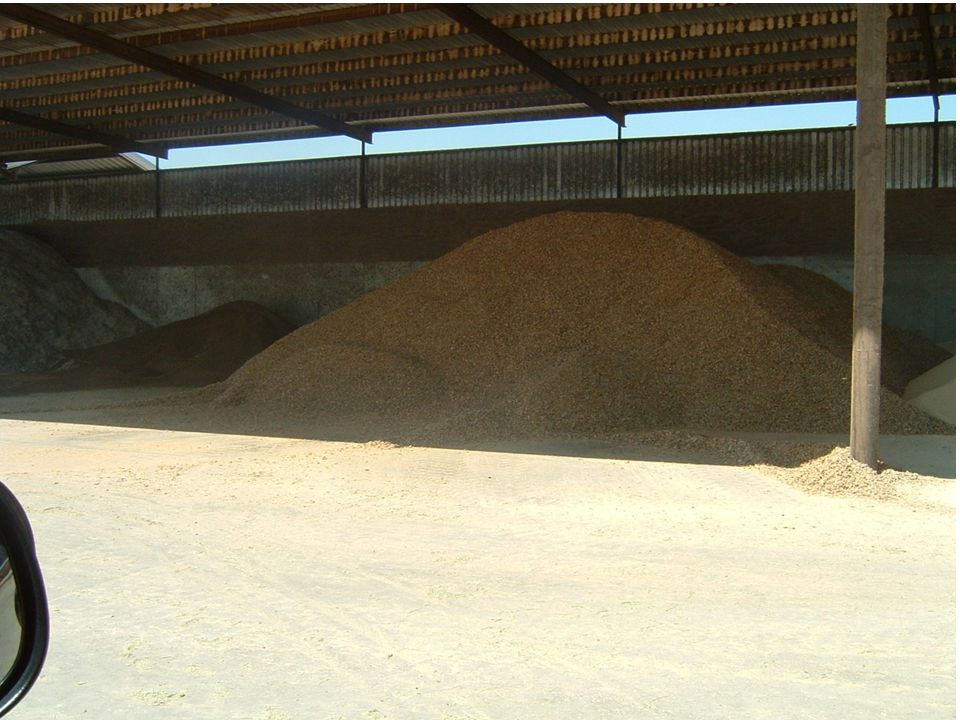
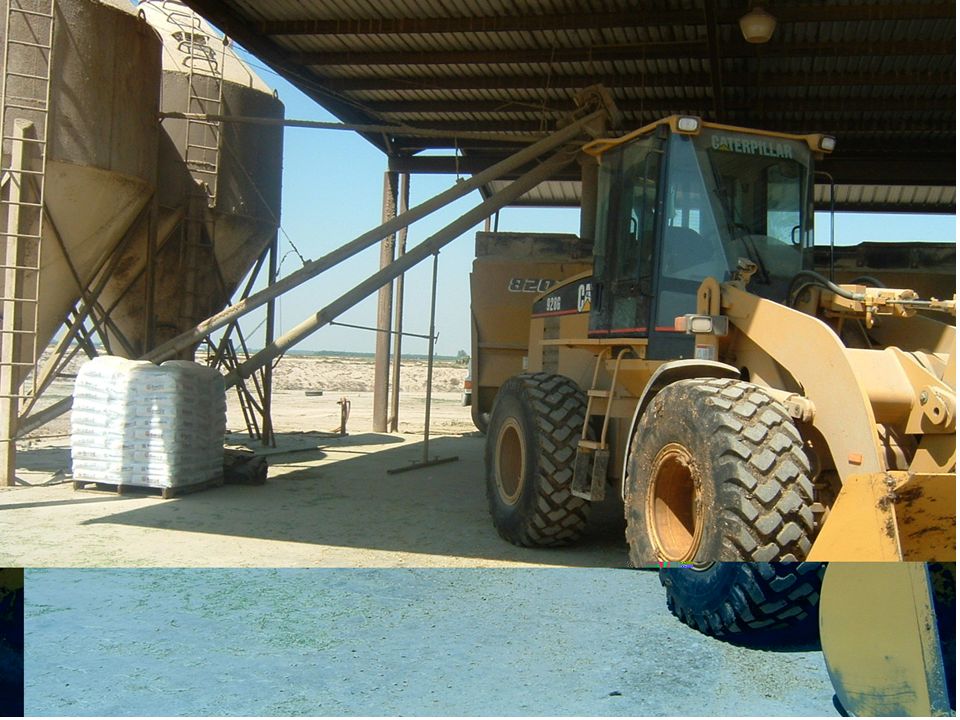
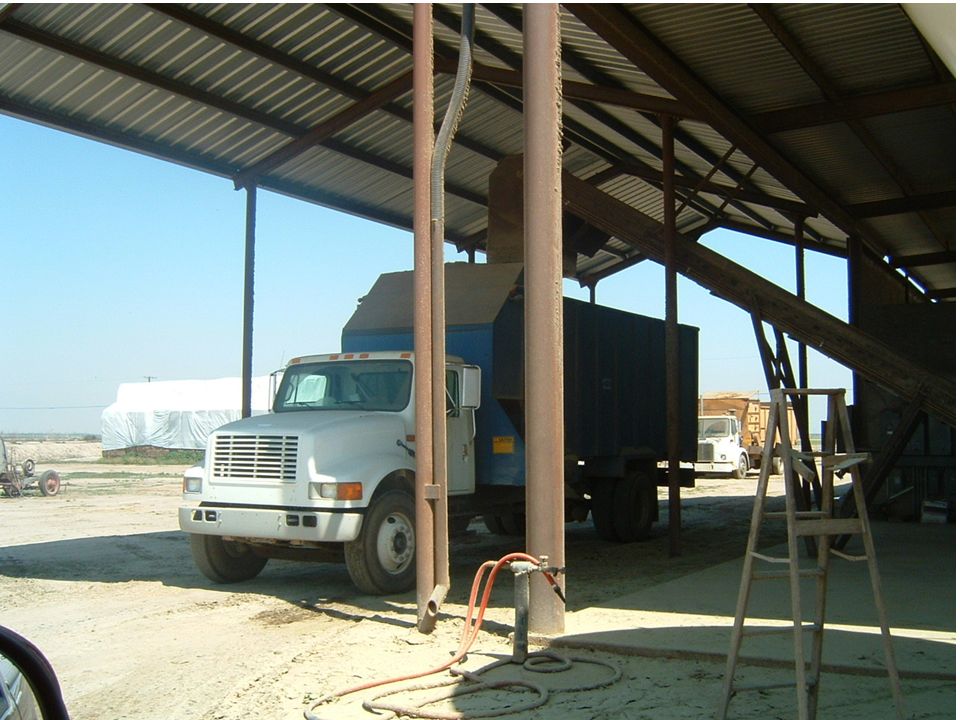
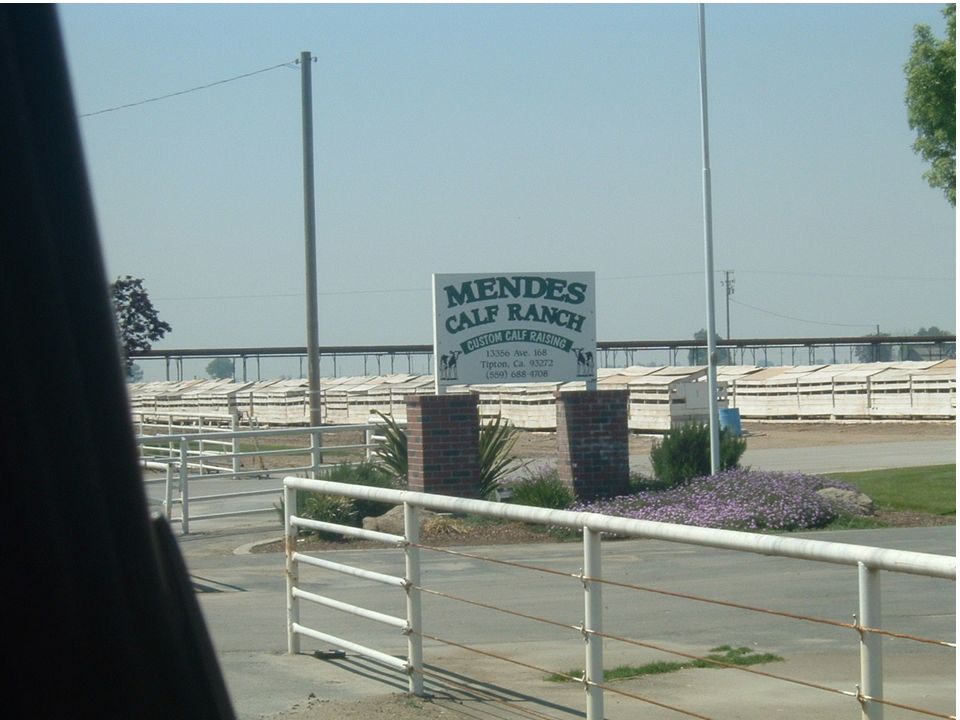
DAIRY PRODUCTON “PLANT” CHARACTERISTICS Western modern and drylot operations – Few home produced feedstuffs – Associated input services purchased – Some diary enterprise activities are outsourced – Almost all of the capital and management focused directly on milk production

51
USDA, Federal Milk Marketing Administrator, Tulsa, 2/2002

52
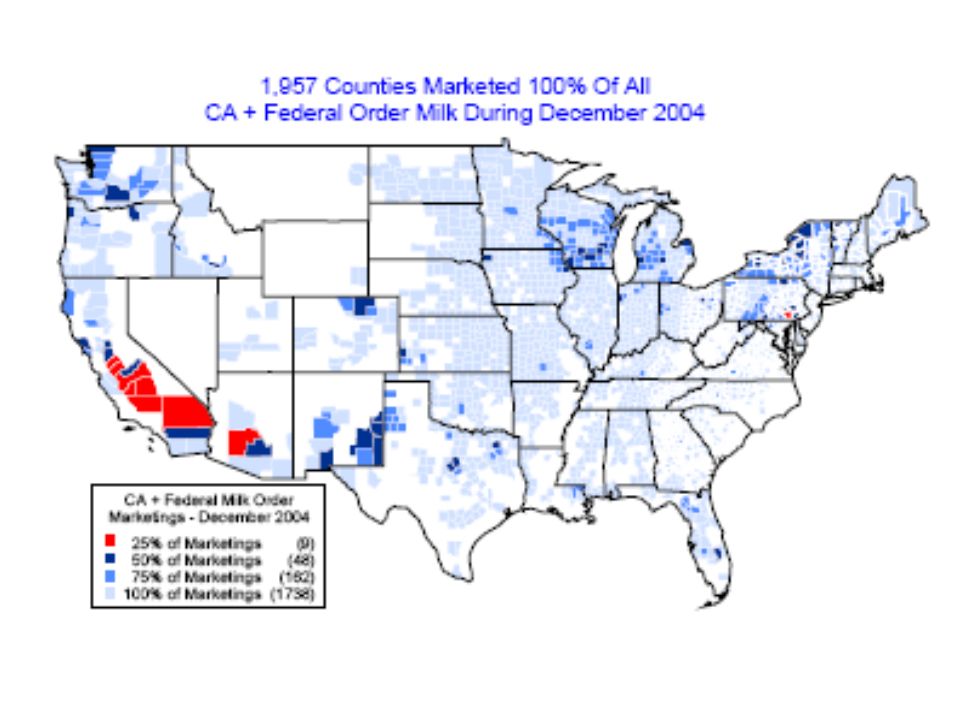
USDA, Federal Milk Marketing Administrator, Tulsa, 2/2005

53
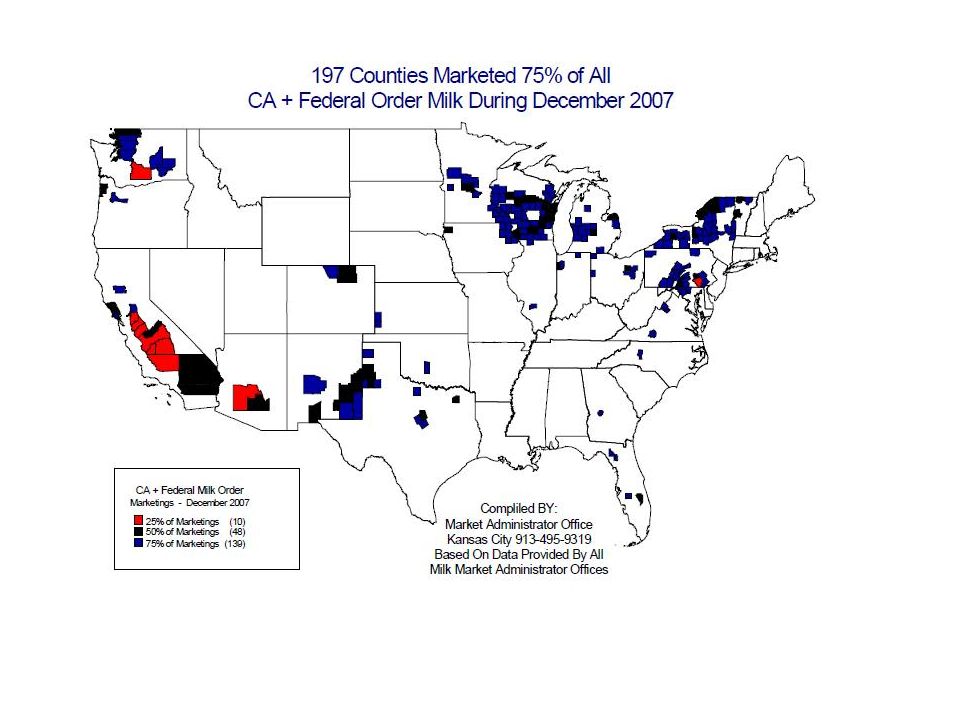
USDA, Federal Milk Marketing Administrator, Tulsa, 2/2009

54
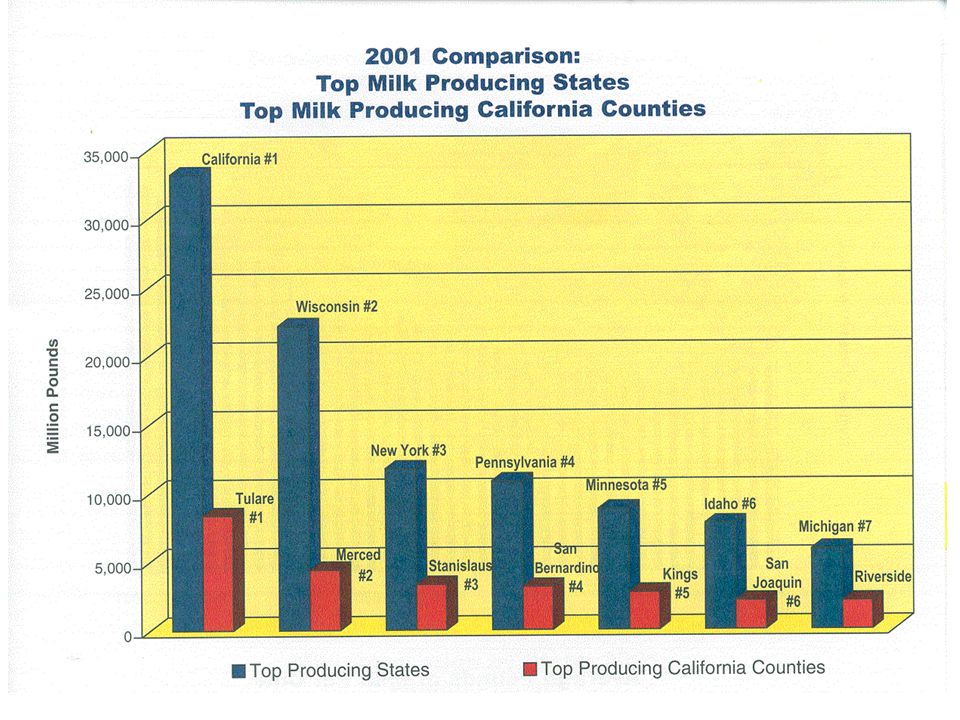
Top Milk Production States, 2004 Source: NASS, USDA, Milk Production, Disposition and Income, April 2005.

55
Top Milk Production States, 2008 Source: NASS, USDA, Milk Production, 2/15/09

56
USDA, Federal Milk Marketing Administrator, Tulsa, 2/2002

57
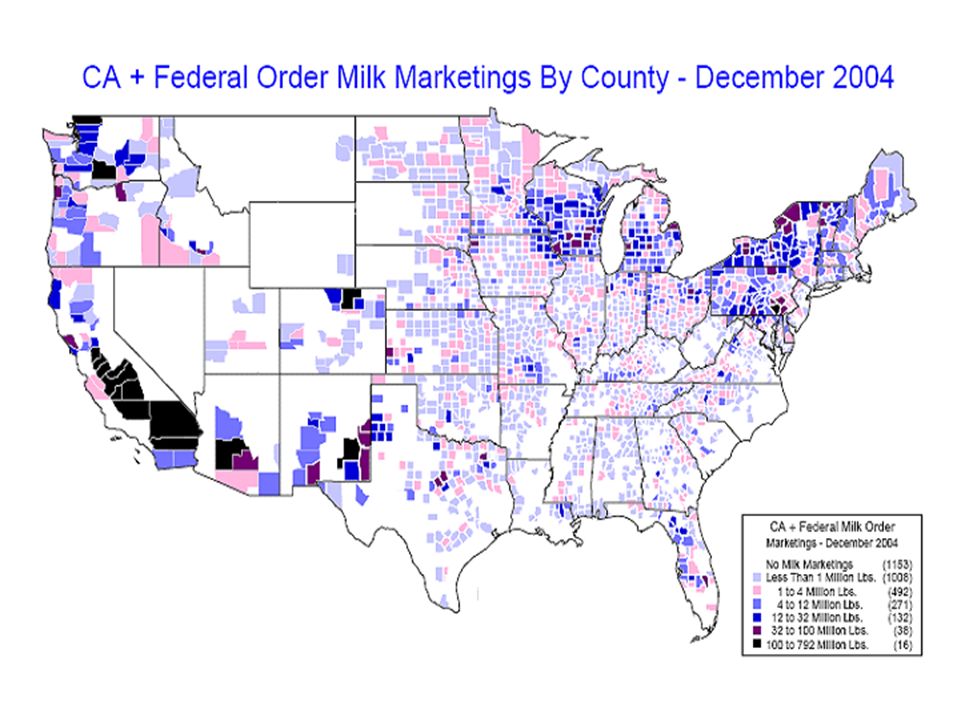
USDA, Federal Milk Marketing Administrator, Tulsa, 2/2005

58
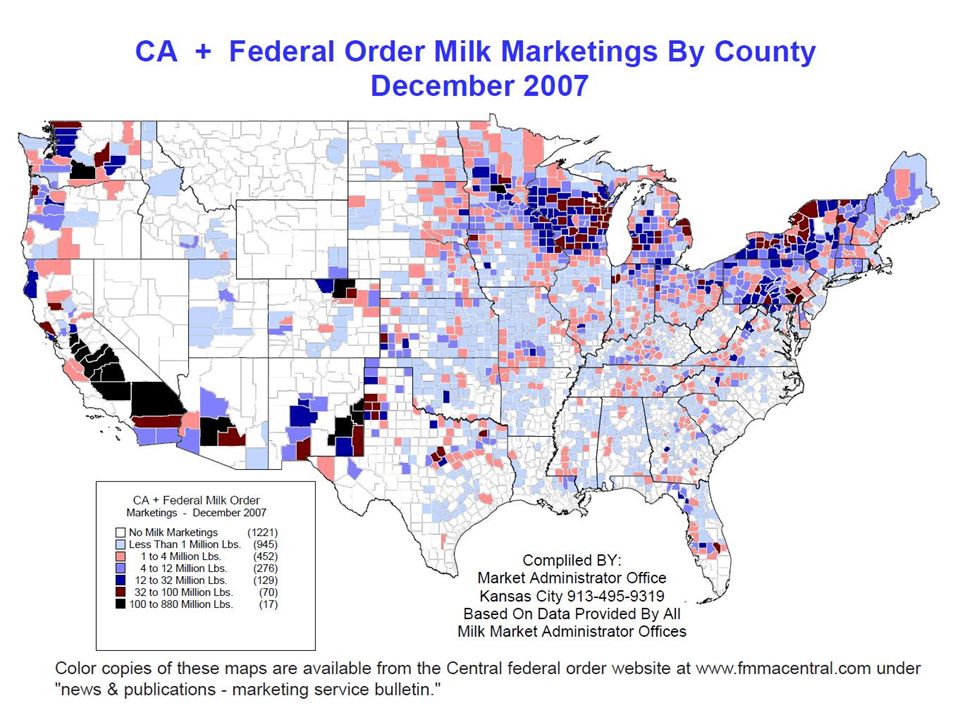
USDA, Federal Milk Marketing Administrator, Tulsa, 2/2009

59
DAIRY PRODUCTON GEOGRAPHIC DISTRIBUTION Would you expect the production to grow in the south and northeast where per-capita production is low? – Why or Why not? n Iowa has surplus per-capita consumption– Is that good or bad for the future of the industry here?

60
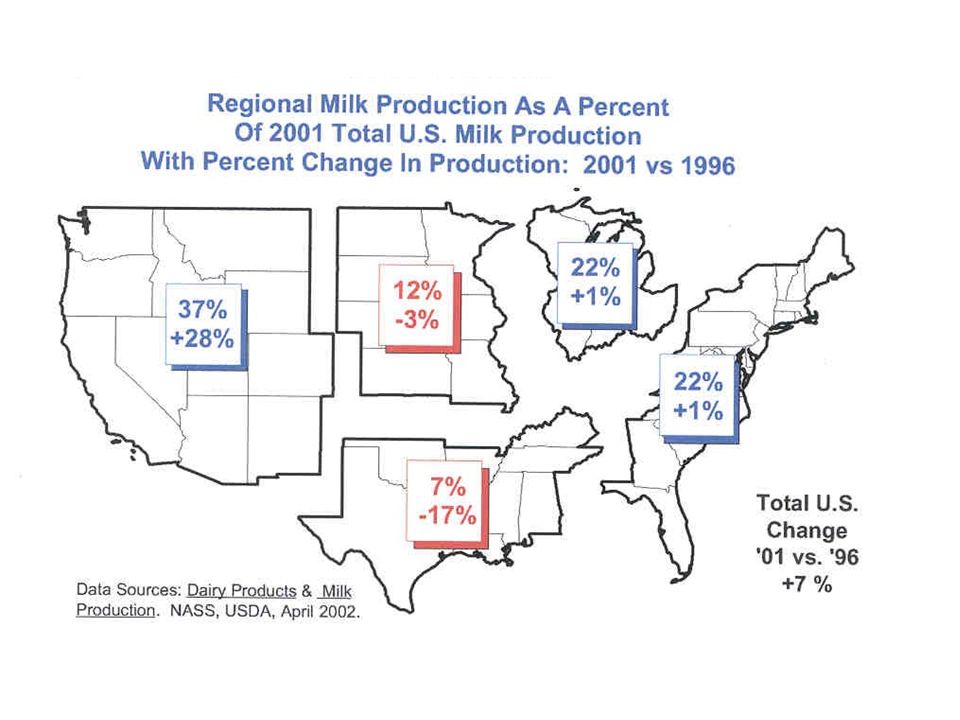
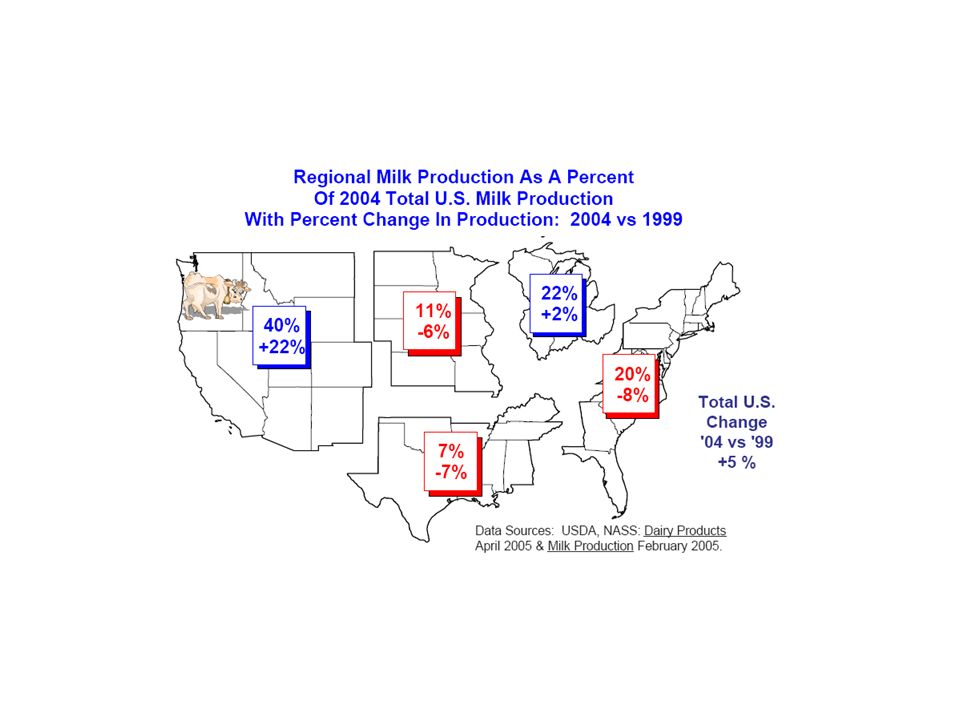
Geographic Distribution of U.S. Milk Production Where is the milk produced Which areas are increasing production Which areas are decreasing production

61
USDA, Federal Milk Marketing Administrator, Tulsa, 2/2002

63
USDA, Federal Milk Marketing Administrator, Tulsa, 2/2009

64
USDA, Federal Milk Marketing Administrator, Tulsa, 2/2002

65
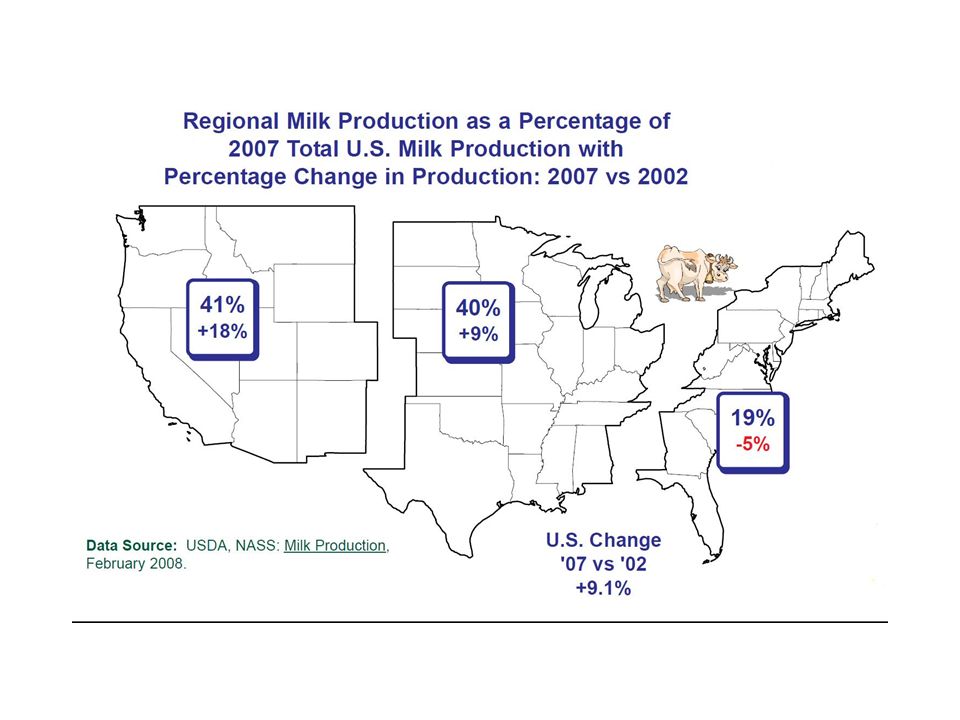
Milk Production: 2007 vs 2002 USDA, Federal Milk Marketing Administrator, Tulsa, 2/2008

66
Regional Milk Production as a Percent of Total U.S. Production Source: Federal Milk Market Administrator, Tulsa, April, 2007

70
USDA, Federal Milk Marketing Administrator, Tulsa, 4/2000

83
County Dec ‘99 Dec ‘96 Change Sioux25,769,297 15,816,565 +9,952,732 Delaware30,804,827 22,807,432 +7,997,395 Dubuque43,904,262 38,100,886 +5,803,376 Allamakee21,842,207 17,739,629 +4,102,578 Clayton29,147,268 25,773,110 +3,374,158 Cass 3,135,338 243,802 +2,891,536 Osceola 4,634,961 1,907,317 +2,727,644 Pocahontas 1,360,140 233,614 +1,126,526 Fayette18,697,024 17,596,348 +1,100,676 Counties With Marketing Changes Greater Than 1 Million Pounds December 1999 Compared With December 1996 Increases Greater Than 1 Million Lbs (27) Decreases Greater Than 1 Million Lbs. (18) Source: Federal Milk Market Administrator, Tulsa, March, 2000.
 Source: Federal Milk Market Administrator, Tulsa, March,")
84
Counties That Produced Fifty Percent of Central FMMO December, 1999 Source: Federal Milk Market Administrator, Tulsa, March, 2000.

85
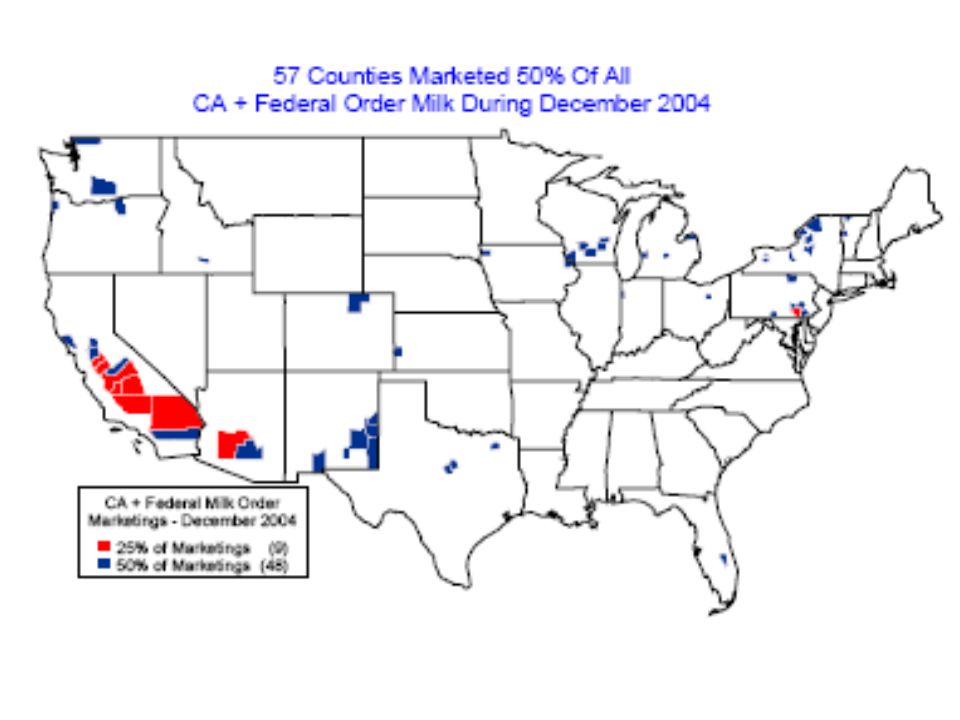
Federal Order Milk Marketings By County – December 2001

86
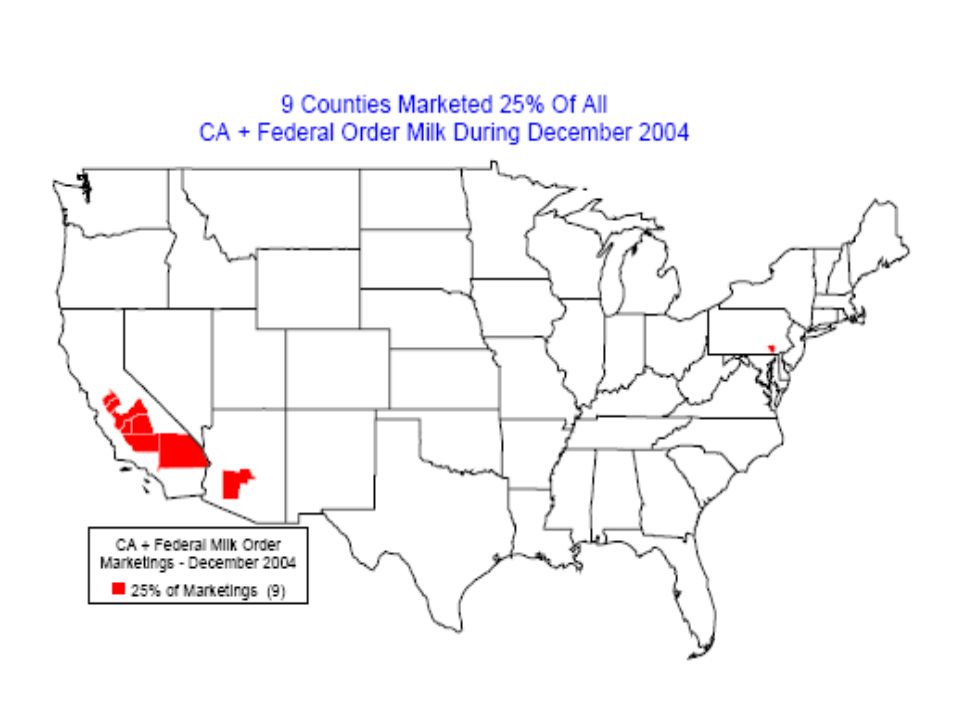
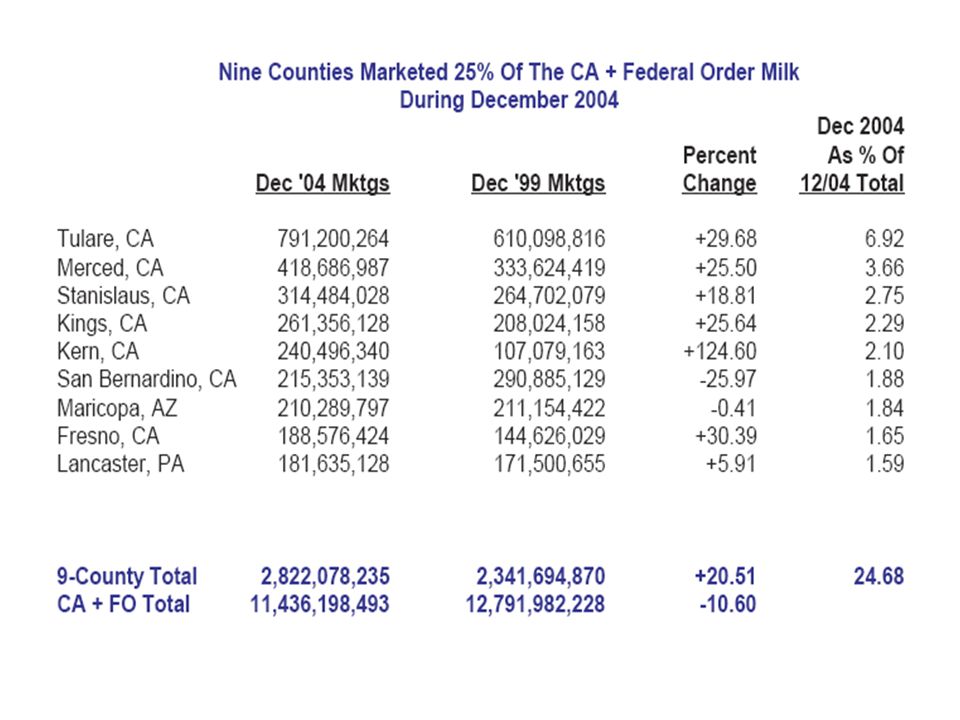
Increases in CA + FO Milk Marketings December 2004 vs December 1999

87
Increases in CA + FO Milk Marketings December 2007 vs December 2002

88
Decreases in CA + FO Milk Marketings December 2004 vs December 1999

89
Decreases in CA + FO Milk Marketings December 2007 vs December 2002

Similar presentations