Download presentation
Presentation is loading. Please wait.

1
Hydrological networks A.I. Shiklomanov (AARI, UNH), V.S. Vuglinsky (SHI), SAON workshop, 7 July, 2008, St.Petersburg
, SAON workshop, 7 July, 2008, St.Petersburg.")
2
Bering Strait305 Chukchi Sea60.2 Beaufort Sea396 Arctic Archipelago 188 Hudson Bay684 Foxe Basin86.1 Hudson Strait194 Baffin Sea and Southern Greenland 380 Greenland Sea148 Norwegian Sea150 Barents Sea430 Kara Sea1330 Laptev Sea760 East Siberian Sea229 Total Pan-Arctic Drainage 5340

3
Hydrological network is the main part of surface water inventory. Hydrological observation data are required for many branches of the national economy, scientific purposes, environmental requests and others. Therefore, the requirements for this information are diverse with time. Main components of hydrological network Hydrolo- gical network Network on rivers and channels Network on swamps Water balance network Water evaporimeter network Network on lakes and reservoirs

4
THE SYSTEM OF HYDROLOGICAL OBSERVATIONS IN RUSSIA Main types of observations on rivers: Water discharge Water level Sediment discharge Sediment composition Water temperature Water quality Ice regime characteristics Ice thickness Main types of observations on lakes: Meteorological observations Water level Water temperature Water quality Waves Currents Ice regime characteristics Ice thickness Main types of observations on swamps: Heat balance Meteorological observations Water discharge Water level Water quality Ice regime Peat and soil properties

5
Dynamic of hydrological network Number of stations RiversLakes SwampsEvaporationWater balance TotalDischa rge TotalPosts 1986 4161 2664 514 6 15 302 10 2006 2844 2188 350 3 8 203 6

6
EOS Paper Fig 1 The monitored part of pan-Arctic (red outline) is shown with the density of river discharge gauges in the Regional Roshydromet office (UGMS) responsibility zones in Russia, the provinces in Canada, and Alaska. Values within each administrative unit represent the number of active discharge gauges in 1986 and 1999. The red hatched areas show the loss in monitored area in the 13 years from 1986 to 1999. Shiklomanov A.I., R.B. Lammers, C.J. Vorosmarty (2002) Widespread Decline in Hydrological Monitoring Threatens Pan- Arctic Research, EOS Transactions, American Geophysical Union, v. 83, no. 2 (January 8, 2002), pages 13-17. Shiklomanov et al. (2002) EOS Transactions, AGU, 83(2):13-17.
 Widespread Decline in Hydrological Monitoring Threatens Pan- Arctic Research, EOS Transactions, American Geophysical Union, v. 83, no. 2 (January 8, 2002), pages Shiklomanov et al. (2002) EOS Transactions, AGU, 83(2):")
7
Network density of hydrological stations within the territories of Regional Offices of Hydrometeorological Service (ROHS) of Russia on rivers discharging to the Arctic Ocean
 of Russia on rivers discharging to the Arctic Ocean")
8
Reduction of the hydrological network in different regions of Russia and Canada within the Arctic Ocean drainage area

10
Gauges and gauge density by land cover type for the Russian pan-Arctic drainage system Land Cover%All River Gauges Long Term River Gauges Large River Gauges Precipitation ClassAreaCountDensityCountDensityCountDensityCountDensity Polar desert8.07574494817 10 Tundra9.7665452422420 16 Forest/tundra29.4571153464124178488021 Taiga forest41.111662239941903897423645 Steppe/shrub11.942928434823113690168111 Total100.02307 1907 744 514

11
PermafrostPercentAll River Gauges Long Term River Gauges Large River Gauges Precipitation ClassAreaCountDensityCountDensityCountDensityCountDensity Continuous48.550781391621692710216 Discontinuous7.2103111818741441819 Intermittent8.9203176 15280694640 Sparodic8.119418416415578744240 No permafrost27.21300368109531037610630687 Total100.02307 1907 744 514 Density: Gauges per 1 000 000 km 2 of class Total domain area: 12 970 000 km 2 Gauges and gauge density by permafrost type for the Russian pan-Arctic drainage system

12
DATA DISSIMINATION AND COLLECTION

14
Long-term mean annual runoff in the pan-Arctic based on observational data from data available in 1998 (UNESCO/UNH (1996): Global River Discharge Database RivDis v1.0) and from data available in 2006 (UNH R-ArcticNET v4.0 (2005). A Regional, Hydrometeorological Data Network For the pan-Arctic Region. Shown only gauges and watersheds larger 5000 km2).
..")
15
2405 stations 1024 stations with daily data 2193 stations with monthly data Time Series End Arctic Runoff Data Base in GRDC

16
Summary statistics of river discharge data kept in the ARDB by country 8 countries earliest record from 1877 (RU) latest record from 2003 (US) average time series length of 35 years (Status: April 2005) Arctic Runoff Data Base in GRDC
 latest record from 2003 (US) average time series length of 35 years (Status: April 2005) Arctic Runoff Data Base in GRDC")
17
http://www.r-arcticnet.sr.unh.edu/v4.0/index.html

19
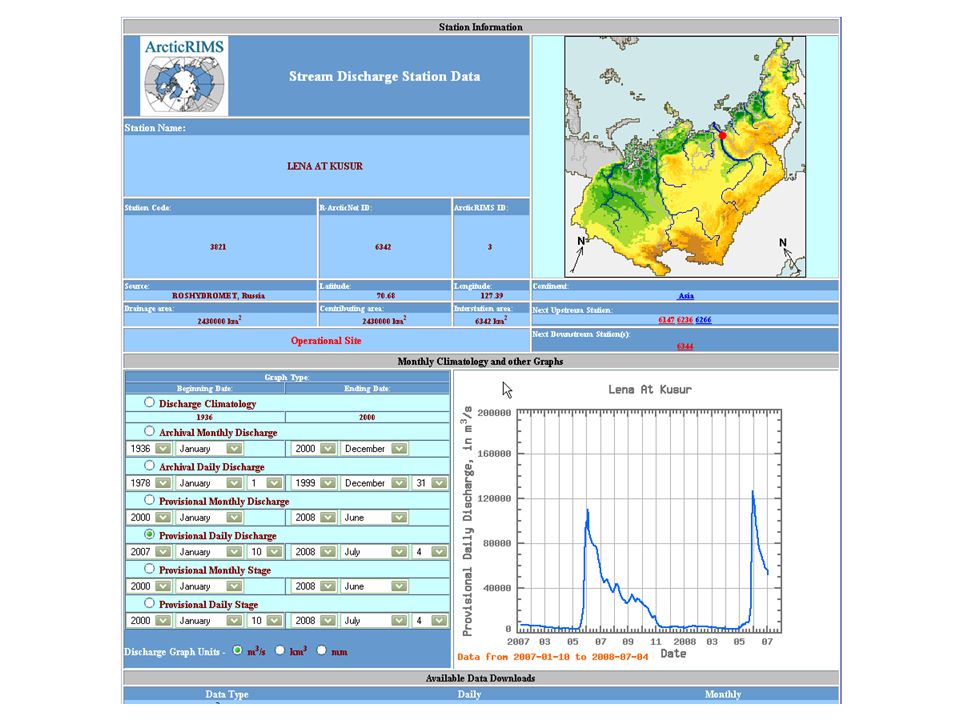
RIMS Real-Time Gauges - Real-Time data - monitoring (first look at hydro cycle) - source of comparison for near-real time models Real-Time River Discharge Monitoring
 - source of comparison for near-real time models Real-Time River Discharge Monitoring")
20
Russian Data Flow to the Arctic and Antarctic Research Institute (AARI) Russian Data Flow - data collected and passed on to regional Roshydromet offices - FAX, email or teletype to AARI - AARI then does data harmonizing QC data, winter corrections and puts data on web - UNH scoops it and harmonizes with RIMS
 Russian Data Flow - data collected and passed on to regional Roshydromet offices - FAX, or teletype to AARI - AARI then does data harmonizing QC data, winter corrections and puts data on web - UNH scoops it and harmonizes with RIMS")
23
Eurasian Arctic River Discharge to the Arctic Ocean and Maximum Sea Ice Extent in the Arctic Ocean R= - 0.7

24
SAON Hydrology Hydrological networks to monitor river inflow to the Arctic Ocean Reference hydroclimatic network to track hydrological response on climate change

Similar presentations


>")


