Download presentation
Presentation is loading. Please wait.

1
Statistics 300: Elementary Statistics Sections 7-2, 7-3, 7-4, 7-5

2
Parameter Estimation Point Estimate –Best single value to use Question –What is the probability this estimate is the correct value?

3
Parameter Estimation Question –What is the probability this estimate is the correct value? Answer –zero : assuming “x” is a continuous random variable –Example for Uniform Distribution

4
If X ~ U[100,500] then P(x = 300) = (300-300)/(500-100) = 0 100 300 400 500
![If X ~ U[100,500] then P(x = 300) = ( )/( ) =](http://images.slideplayer.com/27/8904484/slides/slide_4.jpg "If X ~ U[100,500] then P(x = 300) = ( )/( ) =")
5
Parameter Estimation Pop. mean –Sample mean Pop. proportion –Sample proportion Pop. standard deviation –Sample standard deviation

6
Problem with Point Estimates The unknown parameter ( , p, etc.) is not exactly equal to our sample-based point estimate. So, how far away might it be? An interval estimate answers this question.

7
Confidence Interval A range of values that contains the true value of the population parameter with a... Specified “level of confidence”. [L(ower limit),U(pper limit)]
,U(pper limit)].")
8
Terminology Confidence Level (a.k.a. Degree of Confidence) – expressed as a percent (%) Critical Values (a.k.a. Confidence Coefficients)
 – expressed as a percent (%) Critical Values (a.k.a. Confidence Coefficients).")
9
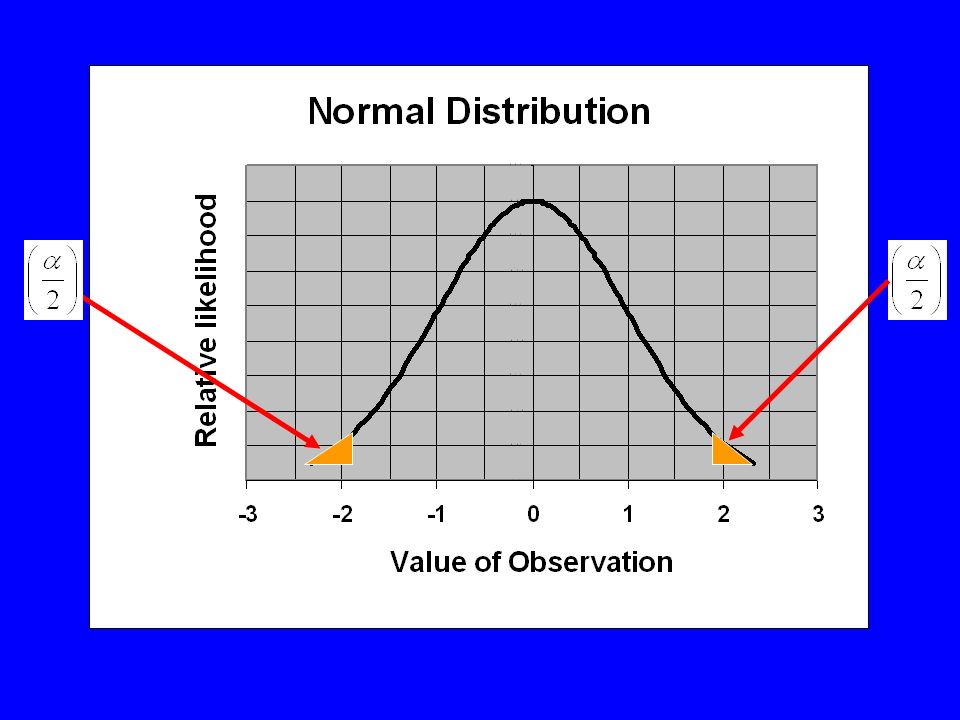
Terminology “alpha” “ ” = 1-Confidence –more about in Chapter 7 Critical values –express the confidence level

10
Confidence Interval for lf is known (this is a rare situation)
")
11
Confidence Interval for lf is known (this is a rare situation) if x ~N(?, )
 if x ~N( , )")
12
Why does the Confidence Interval for look like this ?

17
Using the Empirical Rule

19
Check out the “Confidence z-scores” on the WEB page. (In pdf format.)
")
20
Use basic rules of algebra to rearrange the parts of this z-score.

22
Confidence = 95% = 1 - 95% = 5% = 2.5% = 0.025

24
Confidence Interval for lf is not known (usual situation)
")
25
Sample Size Needed to Estimate within E, with Confidence = 1-

26
Components of Sample Size Formula when Estimating Z /2 reflects confidence level – standard normal distribution is an estimate of, the standard deviation of the pop. E is the acceptable “margin of error” when estimating

27
Confidence Interval for p The Binomial Distribution gives us a starting point for determining the distribution of the sample proportion :

28
For Binomial “x”

29
For the Sample Proportion x is a random variable n is a constant

30
Time Out for a Principle: If is the mean of X and “a” is a constant, what is the mean of aX? Answer:

31
Apply that Principle! Let “a” be equal to “1/n” so and

32
Time Out for another Principle: If is the variance of X and “a” is a constant, what is the variance of aX? Answer:

33
Apply that Principle! Let x be the binomial “x” Its variance is npq = np(1-p), which is the square of is standard deviation
, which is the square of is standard deviation.")
34
Apply that Principle! Let “a” be equal to “1/n” so and

35
Apply that Principle!

36
When n is Large,

37
What is a Large “n” in this situation? Large enough so np > 5 Large enough so n(1-p) > 5 Examples: – (100)(0.04) = 4 (too small) –(1000)(0.01) = 10 (big enough)
 > 5 Examples: – (100)(0.04) = 4 (too small) –(1000)(0.01) = 10 (big enough).")
38
Now make a z-score And rearrange for a CI(p)
")
39
Using the Empirical Rule

41
Use basic rules of algebra to rearrange the parts of this z-score.

46
Confidence Interval for p (but the unknown p is in the formula. What can we do?)
")
47
Confidence Interval for p (substitute sample statistic for p)
")
48
Sample Size Needed to Estimate “p” within E, with Confid.=1-

49
Components of Sample Size Formula when Estimating “p” Z /2 is based on using the standard normal distribution p and q are estimates of the population proportions of “successes” and “failures” E is the acceptable “margin of error” when estimating

50
Components of Sample Size Formula when Estimating “p” p and q are estimates of the population proportions of “successes” and “failures” Use relevant information to estimate p and q if available Otherwise, use p = q = 0.5, so the product pq = 0.25

51
Confidence Interval for starts with this fact then

52
What have we studied already that connects with Chi-square random values?

55
Confidence Interval for

Similar presentations


>")


 © 2006 Prentice-Hall, Inc. Chap 8-1 Chapter 8 Confidence Interval Estimation Business Statistics, A First Course.>")


>")


 Confidence Intervals for numerical data: –Standard deviation known –Standard deviation unknown Confidence Intervals for.>")
