Download presentation
Presentation is loading. Please wait.

1
Portfolio Managers: Honglu Liu Min Min Chen Rafi Qi He Presented April 17, 2012 12/14/2015

2
Introduction SBUX Current Price @2012/4/16: $ 59.65 GICS map: 30201030 Industry: Coffee Production Founded in 1971 as a coffee bean roaster and retailer Strong customer loyalty (Not just coffee) 12/14/2015
 12/14/2015")
4
Industry Overview Coffee consumers in the United States spending an approximated 9.2 billion dollars in the retail sector and 8.7 billion dollars in the foodservice sector every year. That is on average $164.71 per year on coffee Source: www.coffeeresearch.org 12/14/2015

5
Industry Overview

6
Industry Overview - External Driver 12/14/2015

7
Macroeconomic Souce:CapitalIQ Macroeconomic 12/14/2015

8
Market Cap : 44.94 Billion P/E(ttm): 35.72 Forward P/E: 25.82 PEG Ratio: 1.71 52-Week High: 61.98 52-Week Low: 33.72 12/14/2015 Relevant Stock Market Prospects Source: www.finance.yahoo.com
: Forward P/E: PEG Ratio: Week High: Week Low: /14/2015 Relevant Stock Market Prospects Source:")
9
Relevant Stock Market Prospects 12/14/2015 Source: http://www.investorguide.com/stock-charts.php?ticker=SBUXhttp://www.investorguide.com/stock-charts.php?ticker=SBUX SBUX vs. S&P 500

10
12/14/2015 Relevant Stock Market Prospects Source: http://www.investorguide.com/stock-charts.php?ticker=SBUXhttp://www.investorguide.com/stock-charts.php?ticker=SBUX SBUX vs. NASDAQ Index

11
12/14/2015 Source: SBUX 10-k Relevant Stock Market Prospects

12
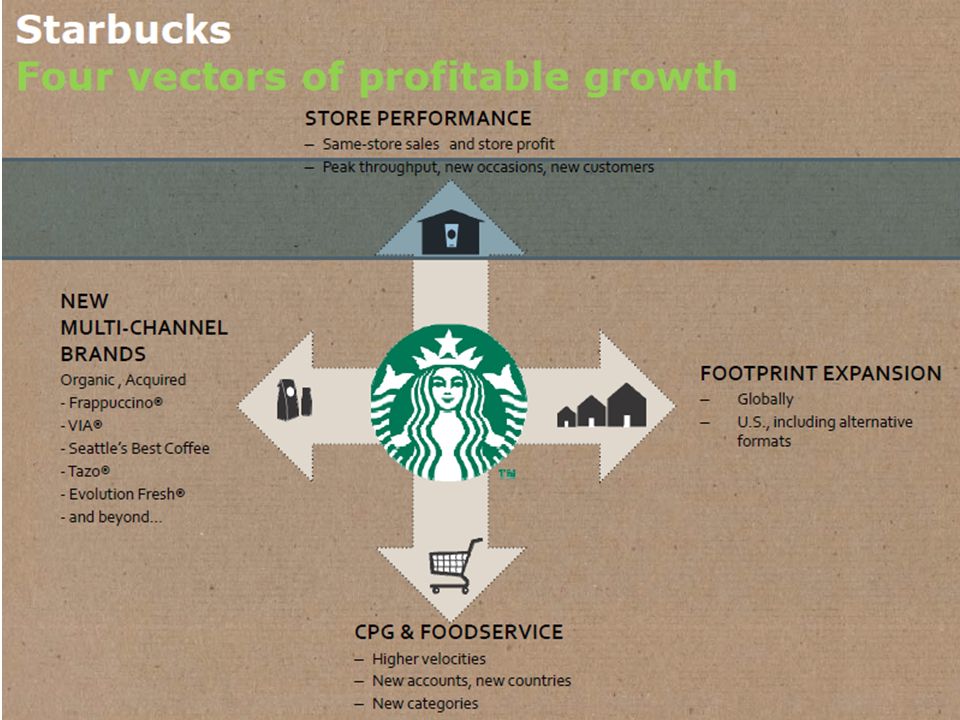
Business review 12/14/2015 Brand Portfolio Source: SBUX Company Profile

13
12/14/2015 Business review Source: SBUX &10-k Suppliers Coffee bean Other diary products Farmer Support Center Starbucks Products through Stores Grocery Warehouse club Food service etc Customers US 69% International 22% CPG 7% Others 2%

14
12/14/2015 Business review Source: SBUX 10-k

15
12/14/2015 Source: SBUX Q1 FY12 Store Counts By Country Business review % of stores globally

16
12/14/2015 Business review 17,244 stores globally Source: SBUX Q1 FY12 Store Counts By Country

17
12/14/2015 Business review Source: SBUX Q1 FY12 Store Counts By Country 17,244 stores globally

18
12/14/2015 Business review Source: SBUX 10-k

19
12/14/2015 Business review Source: SBUX 10-k

20
12/14/2015 Business review Source: SBUX 10-k

21
12/14/2015 Source: SBUX 10-k Business review

22
Financial Analysis 20072008200920102011 Current Ratio.79.801.291.551.83 Quick Ratio.47.48.871.241.36 Cash Ratio.13.12.38.65.55 12/14/2015 Data Source: SBUX 10-K

23
2008200920102011 Receivables Turnover 33.6332.5537.3333.95 Days Sales Outstanding 10.8511.219.7810.75 Inventory Turnover 12.6011.8113.7411.95 Days Inventory on Hand 28.9730.9226.5630.55 12/14/2015 Data Source: SBUX 10-K

24
2008200920102011 Net Profit Margin 3%4%9%11% Gross Margin16%18%22%23% ROA6%7%16%18% ROE13%14%28%31% Interest Coverage 9.4414.3743.4151.91 12/14/2015 Data Source: SBUX 10-K

25
2008200920102011 ROE13%14%28%31% Tax Burden69%70%66%69% Interest Burden90%100%101%105% EBIT Margin5%6%13%15% Asset Turnover1.881.741.791.70 Leverage2.312.031.781.71 12/14/2015 Data Source: SBUX 10-K

26
Key Statistics Closing price on 4/16/2012 : $ 59.65 Annual EPS (ttm): 1.67 PEG ratio: 1.71 D/A = 1% P/E (ttm): 35.72 P/E (forward): 25.82 Implied 1-yr growth in EPS: 38.34% Graham g (5-7 year growth) : 13.61% Greenblatt profitability ratios: 1.EBIT/Tangible Assets = 46.67% 2.EBIT/ Enterprise Value= 3.8% 1. + 2. = 50.47% 12/14/2015 Data Source: SBUX 10-K

27
Public Comparable Analysis PNRADNKNMCD Company Name Panera BreadDunkin’ Brands McDonald’s Corp Price per Share 161.931.2997.64 D/A0%28%11% P/E35.6842.9718.4 P/S2.595.993.68 P/BV7.25.016.93 EV/Revenue2.487.964.03 EV/EBITDA15.0318.9811.22 12/14/2015 Value P/E $ 54.0225% EV/EBITDA $ 43.6225% EV/Revenue $ 75.7025% P/BV $ 40.4525% Final Value $ 43.34 Data Source: Yahoo Finance

28
Financial Projection – DCF Analysis 12/14/2015 - History Data: Balance Statement

29
12/14/2015 - History Data: Income Statement Financial Projection – DCF Analysis

30
12/14/2015 - WACC Financial Projection – DCF Analysis

31
12/14/2015 - Assumption Financial Projection – DCF Analysis

32
12/14/2015 We use 10.5% WACC Base Scenario: $34.43 Upside Scenario: $58.75 Downside Scenario: $ 17.62 - Results Financial Projection – DCF Analysis

33
Recommendation Watch List 12/14/2015

Similar presentations


>")


>")


