Download presentation
Presentation is loading. Please wait.

1
Illinois Lake Michigan (nearshore) Mercury and PCB TMDLs
 Mercury and PCB TMDLs")
2
Outline Project study area Overview of mercury and PCB impairments Overview of TMDL Scoping Report Receive comments on the Scoping Report

3
Project study area Waters to be addressed IEPA has identified 56 Lake Michigan nearshore segments that are impaired due to PCBs and mercury. 51 beach/shoreline segments 4 harbors 1 nearshore open water segment

4
Study Area Harbors North Point Marina Waukegan Harbor North Diversey Harbor Calumet Harbor

5
Outline Project study area Overview of mercury and PCB impairments Overview of TMDL Scoping Report Receive comments on the Scoping Report

6
Mercury Impairments What is Mercury? Naturally occurring elemental chemical Chemical symbol Hg Heavy metal Many industrial uses Batteries Paint (historical) Lighting Switches Thermometers Dental
 Lighting Switches Thermometers Dental.")
7
Mercury Impairments Environmental Effects Causes adverse health effects – Impaired neurological development Primary concern is methyl- mercury in fish – Methyl mercury concentrations in water can bioaccumulate 1,000,000 times in fish Consumption of contaminated fish is a significant human health and wildlife concern

8
Driscoll, C.T., D. Evers, K.F. Lambert, N. Kamman, T. Holsen, Y-J. Han, C. Chen, W. Goodale, T. Butler, T. Clair, and R. Munson. Mercury Matters: Linking Mercury Science with Public Policy in the Northeastern United States. Hubbard Brook Research Foundation. 2007. Science Links Publication. Vol. 1, no. 3. Mercury Impairments Caused Primarily by Atmospheric Deposition

9
Aquatic Life Use Impairment Based on the most recent 3 years of water quality data. At least two exceedances of the acute numeric standard within the most current 3-year period. >10% of samples are less than or equal to the chronic standard, and the mean is less than or equal to the chronic standard. Fish Consumption Use Impairment Waterbody-specific fish-tissue data collected since 1985. Fish consumption advisories issued by Illinois Fish Contaminant Monitoring Program Mercury Impairments to Designated Uses

10
Mercury Impairments: Average Concentration by Fish Species Species Count of Samples Average Concentration (mg/kg) Largemouth bass30.280 Smallmouth bass70.110 Rock bass90.102 White sucker40.053 Sunfish50.033 Black bullhead20.055 Rainbow trout20.064 Brown trout10.103 Red values exceed fish consumption target of 0.06 mg/kg
 Largemouth bass Smallmouth bass Rock bass White sucker Sunfish Black bullhead Rainbow trout Brown trout Red values exceed fish consumption target of 0.06 mg/kg")
11
PCB Impairments What are PCBs? PCB = polychlorinated biphenyl – synthetic, chlorinated organic chemicals – produced mainly for their insulating capabilities and chemical stability Banned from production in 1979 Cause a variety of health effects – impacts to the nervous, immune, reproductive, and endocrine systems – cancer

12
PCB Impairments What are PCBs? Chemical nature of PCBs makes them an environmental issue, even though their production has long been banned – Chemical stability makes them long-lasting in the environment – Strong tendency to accumulate in fish tissue

13
PCB Sources PCBs are a man-made compound, with no natural sources PCBs enter Lake Michigan waters primarily from the atmosphere Sources to the atmosphere consist primarily of remnants from past PCB uses – Capacitors, transformers, and other electrical equipment – Often accumulated in landfills, scrap yards

14
PCB Impairments to Designated Uses Fish Consumption Use Impairment Waterbody-specific fish-tissue data A waterbody-specific, “restricted consumption” or “no consumption” fish consumption advisory is in effect

15
PCB Impairments: Average Concentration by Fish Species Species Count of Samples Average Concentration (mg/kg) Carp524.329 Lake trout300.811 Black bullhead31.027 Rock Bass100.276 Sunfish70.189 Largemouth Bass 40.225 Bloater70.270 White sucker60.237 Species Count of Samples Average Concentration (mg/kg) Smallmouth bass70.172 Pumpkinseed sunfish 30.183 Alewife60.187 Round goby30.137 Yellow perch220.092 Brown Trout10.659 Rainbow trout20.152 Rainbow smelt10.100 Red values exceed target of 0.06 mg/kg
 Carp Lake trout Black bullhead Rock Bass Sunfish Largemouth Bass Bloater White sucker Species Count of Samples Average Concentration (mg/kg) Smallmouth bass Pumpkinseed sunfish Alewife Round goby Yellow perch Brown Trout Rainbow trout Rainbow smelt Red values exceed target of 0.06 mg/kg")
16
Objectives Project study area Overview of mercury and PCB impairments Overview of TMDL Scoping Report Receive comments on the Scoping Report

17
TMDL Scoping Report Determine numeric TMDL target for mercury and PCBs – Select a target fish species Recommend approach for defining the relationship between pollutant load and concentration in water/fish – Develop a conceptual model and assess data gaps

18
Numeric Targets Define acceptable water quality How much mercury and PCBs can we have and not impair the designated uses? TMDL targets must be expressed at a level to demonstrate attainment of State Water Quality Standards (WQS)
.")
19
Numeric mercury water quality criteria 1.3 ng/L for the Wildlife Value 3.1 ng/L for Human Health Protection 1,700 ng/L for Aquatic Acute Toxicity 910 ng/L for Aquatic Chronic Toxicity 0.06 mg/kg for Fish Consumption Based on 0.10 ug/kg/day Health Protection Value for fish consumption for sensitive populations Mercury Water Quality Standards

20
Numeric water quality criteria for PCBs – Wildlife Value of 0.12 ng/L – Human Cancer Value of 0.026 ng/L Fish consumption advisory triggered – 0.06 mg/kg fish tissue Based on the health protection value of 0.05 ug/kg/day PCB Water Quality Standards

21
TMDL Targets Health Protection Value for fish consumption for sensitive populations used to derive TMDL target – 0.06 mg/kg for PCBs – 0.06 mg/kg for mercury TMDL target will also need to demonstrate that compliance with the fish tissue TMDL target will also meet the most protective water quality targets. – 0.026 ng/l for PCBs – 1.3 ng/l for mercury

22
Target Fish Selection - Characteristics Many species sampled to assess fish consumption impairment; however, more efficient to evaluate one species to determine reductions needed. Selected species should possess the following: – Concentrations near the upper bound for all species – Consumable by humans – Sampled abundantly enough so TMDL is not overly influenced by potential sampling variability

23
Target Fish Selection – Available Mercury Data (fish fillets) Fish Nearshore open water/ shoreline Calumet Harbor North Point Marina Waukegan Harbor Total Count Largemouth bass 3 3 Smallmouth bass 52 7 Brown trout1 1 Rock bass 1449 Rainbow trout2 2 Black bullhead 22 White sucker 224 Sunfish 325 Grand Total36141033
 Fish Nearshore open water/ shoreline Calumet Harbor North Point Marina Waukegan Harbor Total Count Largemouth bass 3 3 Smallmouth bass 52 7 Brown trout1 1 Rock bass 1449 Rainbow trout2 2 Black bullhead 22 White sucker 224 Sunfish 325 Grand Total")
24
Target Fish Recommendations-Mercury Largemouth Bass – Most highly contaminated, but only 3 samples exist – Spatial coverage by largemouth bass (and all species) is inadequate to support segment-specific TMDL reduction calculations – TMDL calculations will require pooling of fish data across sites Fish Nearshore open water/ shoreline Calumet Harbor North Point Marina Waukegan Harbor Total Count Average Concentration (mg/kg) Largemouth bass 3 30.2800 Smallmouth bass 52 70.1096
 is inadequate to support segment-specific TMDL reduction calculations – TMDL calculations will require pooling of fish data across sites Fish Nearshore open water/ shoreline Calumet Harbor North Point Marina Waukegan Harbor Total Count Average Concentration (mg/kg) Largemouth bass Smallmouth bass")
25
Target Fish Selection – Available PCB Data (fish fillets) Fish Nearshore open water/ shoreline Calumet Harbor Diversey Harbor North Point Marina Waukegan HarborTotal Alewife6 6 Black bullhead 33 Bloater chub7 7 Brown trout1 1 Carp 124052 Lake trout30 Largemouth bass 314 Pumpkinseed sunfish 1 23 Rainbow smelt1 1 Rainbow trout2 2 Rock bass 1 4510 Round goby 1 2 3 Smallmouth bass 5 2 7 Sunfish 437 White sucker 246 Yellow perch21 122 Grand Total68712959164
 Fish Nearshore open water/ shoreline Calumet Harbor Diversey Harbor North Point Marina Waukegan HarborTotal Alewife6 6 Black bullhead 33 Bloater chub7 7 Brown trout1 1 Carp Lake trout30 Largemouth bass 314 Pumpkinseed sunfish 1 23 Rainbow smelt1 1 Rainbow trout2 2 Rock bass Round goby Smallmouth bass Sunfish 437 White sucker 246 Yellow perch Grand Total")
26
Target Fish Selection – Available PCB Data (fish fillets)
")
27
Target Fish Recommendations-PCBs Carp – Most highly contaminated and widely sampled No samples from Diversey Harbor, Calumet Harbor or the Nearshore open water/shoreline May reflect historic conditions Rock bass and lake trout also candidate species Fish Nearshore open water/ shoreline Calumet Harbor North Point Marina Waukegan Harbor Total Count Average Concentration (mg/kg) Carp 1240524.329 Rock Bass145100.276 Lake Trout30 0.811
 Carp Rock Bass Lake Trout")
28
Basic Steps in TMDL Development Watershed characterization – Define area of concern – Assess extent of contamination Specify TMDL “Target” Pollutant concentration that maintains compliance with designated uses Define relationship between pollutant load and concentration (current) Focus of the Scoping Report Define pollutant load that meets target
 Focus of the Scoping Report Define pollutant load that meets target")
29
Model LoadsConcentration TMDL Development Relating Loads to Water Quality TMDLs require an assessment of the relationship between pollutant loads and resulting concentration in the water and/or fish Typically conducted using mathematical models

30
Model LoadsConcentration Compliance with water quality objectives? TMDL Development Relating Loads to Water Quality The model is used to determine the maximum load that will result in compliance with water quality objectives

31
Model Loads Concentration Compliance with water quality objectives? No Reduce loads TMDL Development Relating Loads to Water Quality

32
Model Loads Concentration Compliance with water quality objectives? Yes Done No Reduce loads TMDL Development Relating Loads to Water Quality

33
Relating Loads to Water Quality Selecting a Model Many different types of models exist Selection of appropriate model requires consideration of – Temporal scale – Spatial scale – Loading sources considered – Pollutant forms – Environmental compartments considered – Fate & transport processes considered

34
Relating Loads to Water Quality Selecting a Model Many different types of models exist Selection of appropriate model requires consideration of – Temporal scale Does the model consider how concentrations change over time, or does it only answer what will happen in the long run?

35
Relating Loads to Water Quality Selecting a Model Many different types of models exist Selection of appropriate model requires consideration of – Spatial scale Does the model treat the entire study area as one lumped entity, or does it handle each impaired segment individually?

36
Relating Loads to Water Quality Selecting a Model Many different types of models exist Selection of appropriate model requires consideration of – Loading sources considered What are the potential sources of mercury and PCBs to these waters?

37
Relating Loads to Water Quality Selecting a Model Many different types of models exist Selection of appropriate model requires consideration of – Pollutant forms Do we consider individual chemical forms or just total pollutant concentration?

38
TMDL Development Relating Loads to Water Quality Many different types of models exist Selection of appropriate model requires consideration of – Environmental compartments considered Are we predicting concentrations in just the water column, and/or in fish, and/or in bottom sediments?

39
Relating Loads to Water Quality Selecting a Model Many different types of models exist Selection of appropriate model requires consideration of – Fate & transport processes considered How does the model describe what happens to the pollutant once it enters the water body?

40
Relating Loads to Water Quality Selecting a Model Models of toxic contamination of water and fish can be divided into three frameworks – Level One: Simple proportionality approaches – Level Two: Steady state mass balance approaches – Level Three: Time-variable model of pollutant forms in water column and sediments

41
Selecting a Model 1: Simple Proportionality Approaches Environmental concentration assumed proportional to current loading rate Key features of level one approach – Unable to describe how pollutant concentrations will change over time – Considers entire study area as one lumped area – Assumes that the load-response relationship for each source is identical – Only addressed total pollutant concentrations. – Can consider all environmental compartments: water column, sediments, and biota. – Do not explicitly describe fate and transport processes

42
Selecting a Model 2: Steady State Mass Balance Approach Key features of level two approach – Unable to describe how pollutant concentrations will change over time – Capable of describing how concentrations change over space – Can consider different load-response relationships for different sources – Can consider different pollutant forms – Can consider all environmental compartments: water column, sediments, and biota – Can explicitly describe fate and transport processes

43
Selecting a Model 3: Time Variable Mass Balance Approach Key features of level three approach – Can consider how pollutant concentrations will change over time – Capable of describing how concentrations change over space – Can consider different load-response relationships for different sources – Can consider different pollutant forms – Can consider all environmental compartments: water column, sediments, and biota – Can explicitly describe fate and transport processes

44
Selecting a Model How Do We Choose Among the Options? Why not just pick the model that has the most features? – More complex models need more data to support them Model selection needs to balance: – The management questions that need to be answered – The resources available to support the model Resources = data, time

45
Selecting a Model Data Gap Assessment Conducted because model selection needs to consider how much data is available Review available data, to define what we know (and don’t know)
")
46
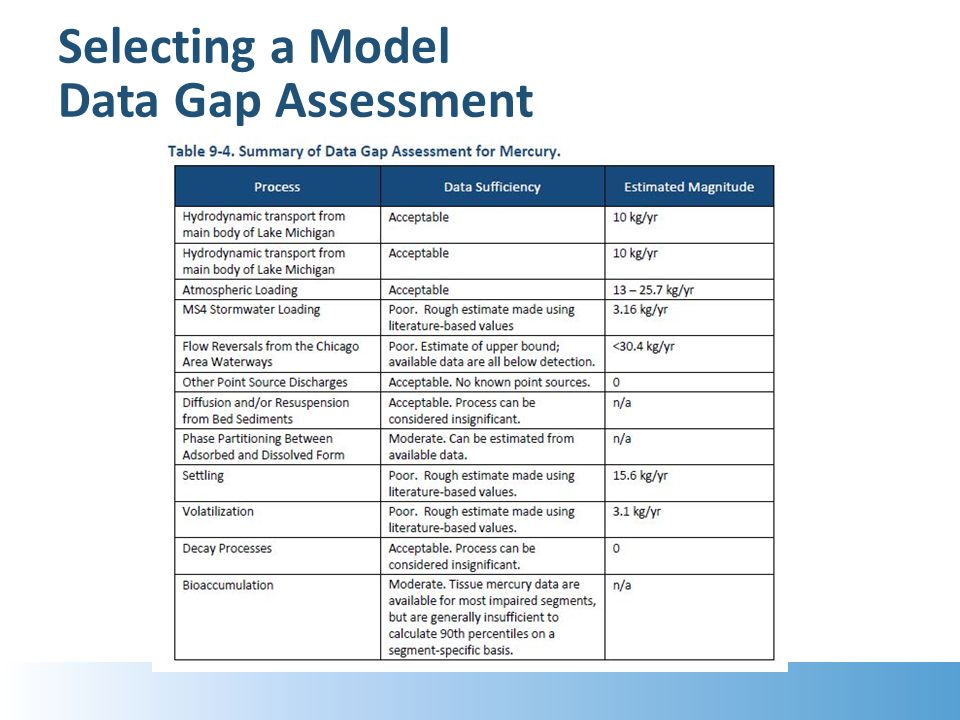
Selecting a Model Data Gap Assessment

48
What we know – Transport of mercury and PCBs into the nearshore from the main body of Lake Michigan is a dominant source – Atmospheric loading of mercury and PCBs is a dominant source to the main lake and nearshore – Other loading sources (stormwater, treatment plants, flow reversals from the Chicago Area Waterways) are relatively small sources
 are relatively small sources")
49
Selecting a Model Data Gap Assessment What we don’t know – Exactly how small the “other loading sources” are – How PCB and mercury concentrations in fish vary over time or across the impaired segments – The magnitude of specific pollutant fate processes

50
Selecting a Model Conclusions Not nearly enough data exist to apply Level 3 approach – Would require years of additional data collection Not enough data exist to apply Level 2 approach – Could theoretically be applied by making assumptions regarding the missing data Sufficient data exist to apply Level 1 approach

51
Selecting a Model Conclusions Model selection needs to balance the management questions that need to be answered with the time and data available Decision boils down to: – Can we get a sufficiently accurate result from a Level One approach now? or – Do we wait until additional data are collected in order to apply a more rigorous approach?

52
Selecting a Model Conclusions Decision made easier by the nature of the problem – The dominant loads that need to be controlled will take a long time to control – The level of reduction required to achieve TMDL targets will be substantial Final decision: Why wait for new data to make decisions that can be made now? – Level One proportionality approach recommended

53
What’s Next? Respond to comments/input received on the Scoping Report Final selection of TMDL modeling approach Refine PCB and mercury loads Apply TMDL models Develop TMDL Public meeting to present draft TMDLs

54
Discussion Study area is impaired due to mercury and PCBs Significant reductions needed for mercury and PCBs Many types of models exist – Model selection needs to balance management questions with the available time and data – Level one proportionality approach recommended for mercury and PCB TMDLs

55
Who to Contact? Penelope Moskus, LimnoTech pmoskus@limno.com 734-332-1200 Collin Stedman, Illinois EPA collin.stedman@illinois.gov 217-782-3362

Similar presentations


 and.>")


 TMDL Assessment ERS 482/682 Small Watershed Hydrology.>")
