Download presentation
Presentation is loading. Please wait.

1
Data Analysis Processes: Cause and Effect Linking Data Analysis Processes to Teacher Evaluation Name of School

2
Objectives for Today Discuss the meaning of cause and effect as it relates to the teacher evaluation system. Understand how an effective data analysis process can determine cause and effect.

3
Using Cause and Effect Data

4
FEAP’s: Practice Indicators Related to Cause and Effect & Data Analysis Continuous Professional Improvement a.Designs purposeful professional goals to strengthen the effectiveness of instruction based on students’ needs b.Examines and uses data-informed research to improve instruction and student achievement c.Uses a variety of data, independently and in collaboration with colleagues, to evaluate learning outcomes, adjust planning, and continuously improve the effectiveness of the lessons d.Collaborates with the home, school, and larger communities to foster communication and to support student learning and continuous improvement e.Engages in targeted professional growth opportunities and reflective practices

5
1.Instructional Design & Lesson Planning a. Aligns instruction with state adopted standards at the appropriate level of rigor b. Sequences lessons and concepts to ensure coherence and required prior knowledge c. Designs instruction for students to achieve mastery d. Selects appropriate formative assessments to monitor learning e. Uses diagnostic student data to plan lessons f. Develops learning experiences that require students to demonstrate a variety of applicable skills and competencies FEAP’s: Practice Indicators Related to Cause and Effect & Data Analysis

6
State Model (based on Marzano research) Indicator: Evaluating the Effectiveness of Individual Lessons and Units The teacher determines how effective a lesson or unit of instruction was in terms of enhancing student achievement and identifies causes of success or difficulty. Indicator: Evaluating the Effectiveness of Specific Pedagogical Strategies and Behaviors The teacher determines the effectiveness of specific instructional techniques regarding the achievement of subgroups of students and identifies specific reasons for discrepancies. Domain 3 – Reflecting on Teaching

7
Danielson Framework Effective teaching requires both assessment of learning and assessment for learning. Assessments of learning ensure that teachers know that students have achieved the intended outcomes. Assessments for learning enable teachers to incorporate assessments directly into the instruction and to modify or adapt instruction as needed to ensure student understanding. Even though such assessments are used during instruction, teachers must design them during the planning process. Such formative assessment strategies are ongoing, and both teachers and students can use them to monitor progress toward instructional outcomes. Component: 1f. Designing Student Assessments

8
Learning Activity 1 How do you define cause and effect?

9
Causal Instructional Strategies Key strategies revealed by research to have the highest probability of impacting student learning when used appropriately and in appropriate instructional contexts. These are the controllable actions in a school that impact student learning. Florida’s Common Language Document

10
Causal Model of Teacher Evaluation Describes the link between classroom practices and behaviors that have a direct impact on student learning and assigns greater importance in evaluation ratings to factors having the most direct link to student learning (based on contemporary research).
.")
11
Cause and Effect Data Sets Effect data: Outcomes or student achievement results Cause data: Professional practices, actions of adults, that create specific effects or results

12
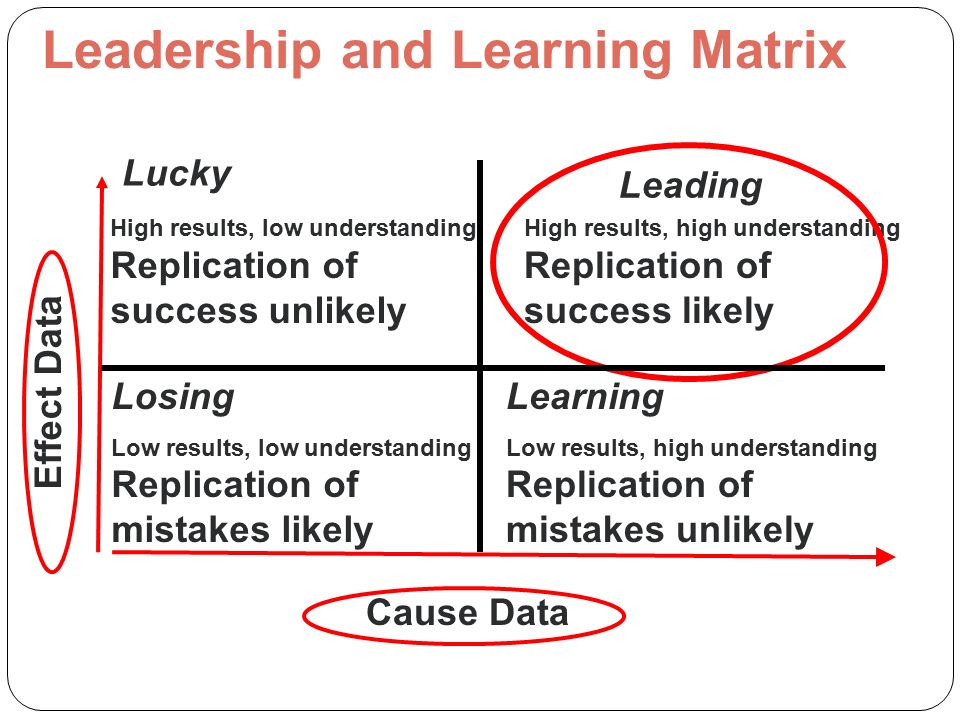
Application of Antecedents of Excellence Results Indicators High results, high understanding Replication of success likely Losing Low results, low understanding Replication of mistakes likely Learning Low results, high understanding Replication of mistakes unlikely High results, low understanding Replication of success unlikely Leadership and Learning Matrix Leading Lucky Cause Data Effect Data p. 36-37
13
Learning Activity 2 Think of a student achievement challenge we wish to conquer. Place an X in the quadrant that best describes our status and provide a justification for the quadrant you selected. Be prepared to share your thinking with the group in five minutes.

14
Through effective data collection, teachers and leaders can make the link between actions of adults and results in student achievement data.

15
Monitor the implementation of a few strategies that have the greatest impact on student learning.

16
Provide timely, specific focused feedback for growth, and allow for focused practice.

17
Sept. Oct. Nov. Dec. Jan. Feb. Percent of Staff Proficient in Using Nonfiction Writing in Content Percent of students proficient or higher in Algebra I Percent of students proficient or higher in reading Cause and Effect Data

18
Cause & Effect Effective Questioning Techniques Proficiency and frequency of using higher order questioning strategies and student results on formative assessments

19
Learning Activity 3 Collecting Cause Data: Higher Order Questioning Techniques

20
Collecting cause data on the proficiency and implementation of specific strategies … …and effect data on student learning, provides clarity on what works best.

21
Data Analysis for Cause & Effect Collaborative Processes to Improve Teaching

22
Data Teams are a model for continuous, collaborative action that inspires and empowers professionals to discover cause and effect relationships.

23
Data Team meetings are collaborative, structured, scheduled meetings that focus on the effectiveness of teaching and learning.

24
Data Teams have a common focus or common standard, a common formative assessment, and a common scoring guide.

25
25 Benefits of Formative AssessmentsClarifyLearningIntentions Elicit Evidence of Learning Promote Feedback Encourage Learners to Own Their Learning

26
Formative What students should know How instruction needs to be adjusted How to improve student skills Assessment FOR learning

27
Summative After instruction occurs Used when determining grades Various audiences for the data Assessment OF learning

28
Remember… It isn’t the method that determines whether the assessment is summative or formative, it is how the results are used.

29
Formative assessment is capable of triggering big boosts to students’ achievement – the educational equivalent to the cure for the common cold. James Popham, 2010 Strategic Priorities for School Improvement, Harvard Education Letter, No. 6

30
Formative Assessment and Cause and Effect

31
The Data Teams Process Six Steps to Data-Driven Instructional Decisions

32
The Data Team Process 1. Collect & Chart Data 2. Analyze & Prioritize 3. Set & Review SMART Goals 4. Select Instructional Strategies 5.Determine Results Indicators 6. Monitor & Evaluate Results

33
Learning Activity 4 The Data Teams Process

35
Questions and Reflection

Similar presentations


 created National Educational Technology.>")


