Download presentation
Presentation is loading. Please wait.

1
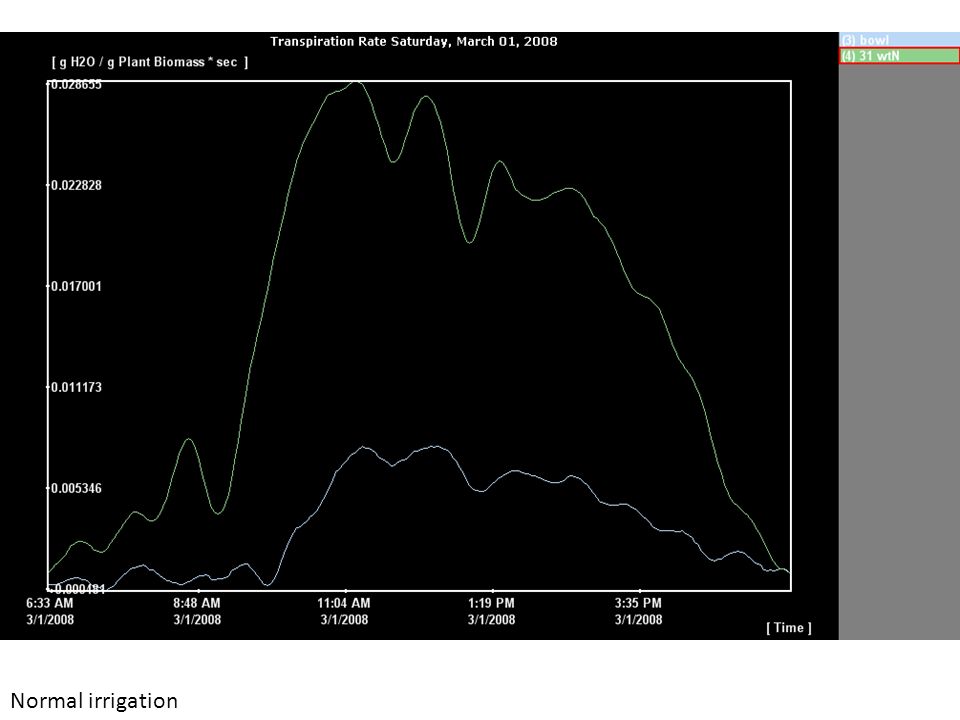
Bulk 5 Dehydration Experiment To find the nature of oscillations in the derivative of the lysimeter weight, we’ll show transpiration rate (S-G Smoothed 12 ) of all days relative to bowl of water (located on the same table) According to the proposed nature, during dehydration period, the amplitude (or number) of the oscillations should increase, relative to excess irrigation period.
 of all days relative to bowl of water (located on the same table) According to the proposed nature, during dehydration period, the amplitude (or number) of the oscillations should increase, relative to excess irrigation period.")
2
Weights Data. Note two dehydration periods 3 and 6 days long each

3
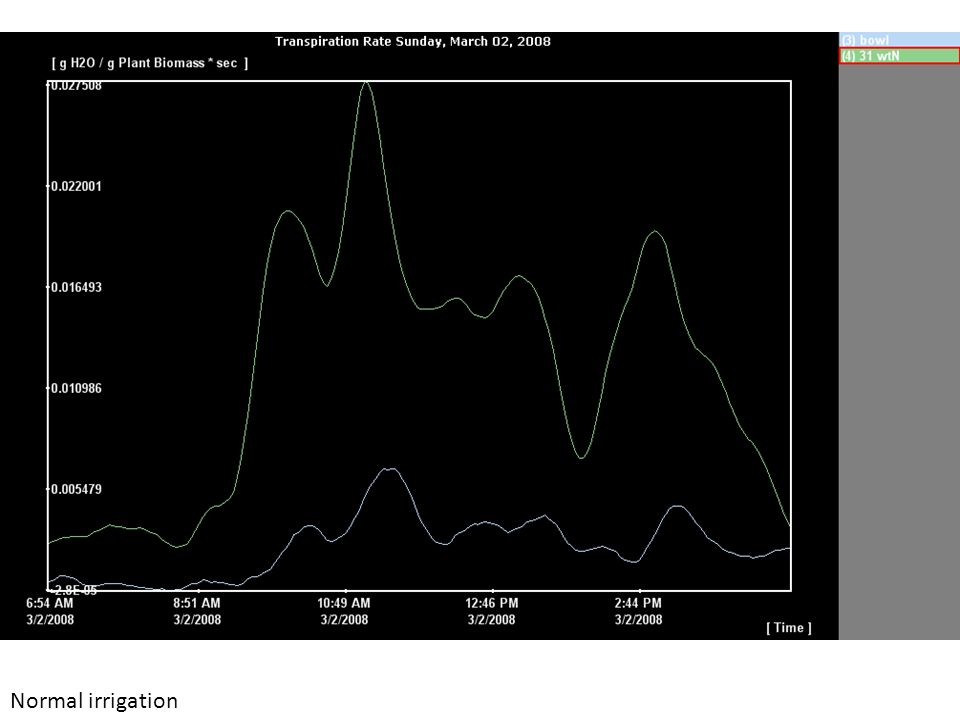
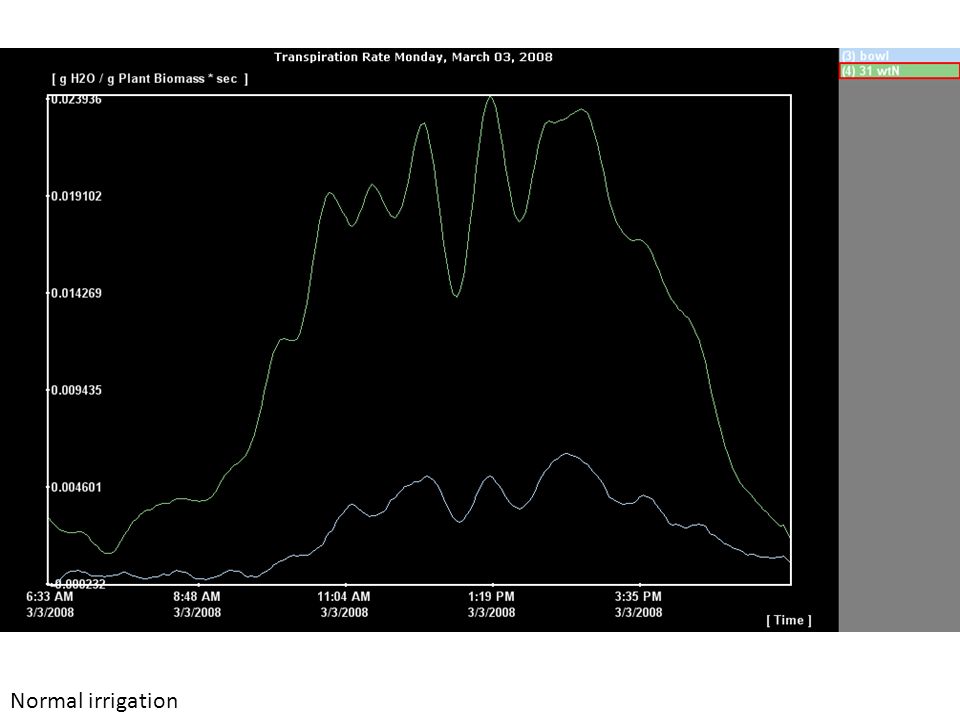
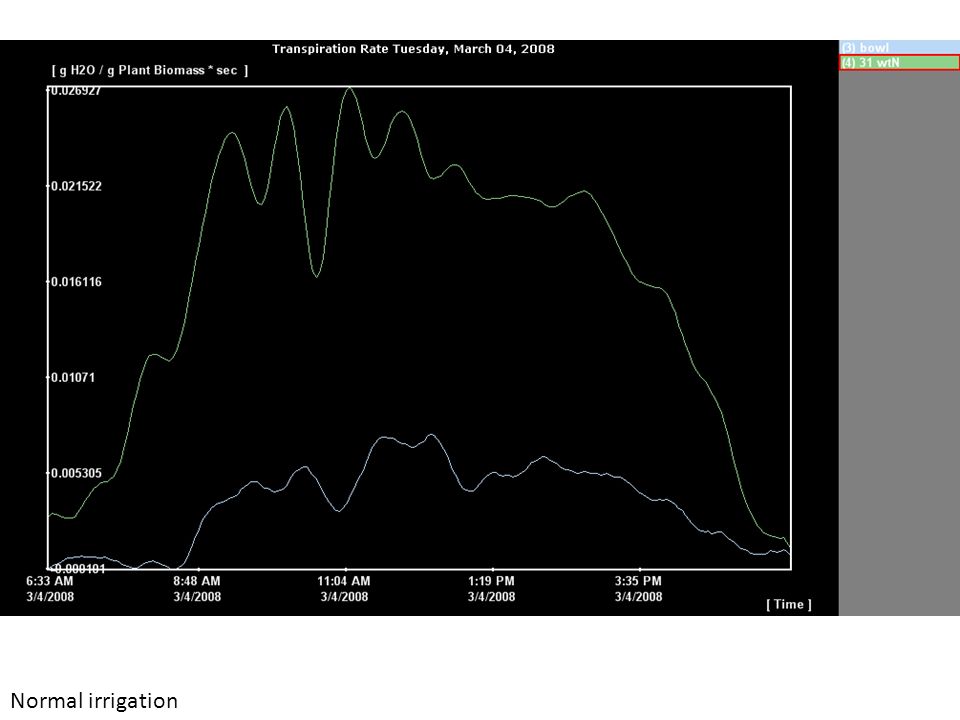
Normal irrigation

8
Dehydration Day 1

9
Dehydration Day 2

10
Normal irrigation

11
Dehydration Day 1

12
Dehydration Day 2

13
Dehydration Day 3

14
Dehydration Day 4 Evaporation rates are fairly similar between the plant and the bowl. So is the amplitude of the oscillations.

15
Dehydration Day 5 Last dehydration day. The bowl evaporates more then the plant. The oscillations in the bowl evaporation rate have bigger amplitude, but follow the same pattern.

16
Rehabilitation Day 1. Normal irrigation

17
Notes to Discussion Similarity of the transpiration pattern between the plant and the bowl of water, in all days. Transpiration pattern during dehydration periods doesn’t look different from regular days. During the last dehydration days (March12), the bowl of water evaporates more then the plant. So are the oscillations in it’s evaporation rate – with amplitude bigger then the plant that day.
, the bowl of water evaporates more then the plant. So are the oscillations in it’s evaporation rate – with amplitude bigger then the plant that day..")
18
Proposed conclusions Similarity of the pattern between the evaporation of the bowl of water and plant transpiration suggests that changing irradiation and temperature in the greenhouse causes changes in evaporation and transpiration rates during the day(as seen in the 1st derivative of the weight data).
.")
Similar presentations


 in ALADIN/LACE domain Stjepan.>")


 Gets into the atmosphere by: 1.Evaporation = liquid to gas (opposite of condensation) 2.Transpiration = plants release.>")


 for developing and/or completing scientific investigations.>")


