Download presentation
Presentation is loading. Please wait.

1
Stream and Watershed Delineation from DEM’s David Maidment, Ph.D. and Francisco Olivera, Ph.D. Center for Research in Water Resources University of Texas at Austin Texas Department of Transportation (TxDOT) Water Resources Modeling Using GIS 2000 - Austin, Texas
 Water Resources Modeling Using GIS Austin, Texas.")
2
Overview zStudy area in West Austin with a USGS 30-meter DEM from a 1:24,000 scale map zEight direction pour point model (flow direction and flow accumulation grids) zStream network definition zWatershed delineation zDEM data sources
 zStream network definition zWatershed delineation zDEM data sources")
3
Study Region in West Austin Hog Pen Creek 4 km

4
Topographic Map 20 ft contour 100 ft contour Stream Center Line Austin West, 1:24,000 Scale http://www.tnrcc.state.tx.us/gis/raster.html

5
Direction of Steepest Descent

6
Watershed Delineation by Hand Watershed divide Drainage direction Outlet

7
200-Meter Mesh 1km Universal Transverse Mercator (UTM) Coordinates
 Coordinates")
8
100-Meter Mesh 100m 1km

9
30-Meter Mesh Standard for 1:24,000 Scale Maps

10
Austin West 30-Meter DEM Elevations in meters. ftp://ftp.tnris.state.tx.us/tnris/demA.html

11
USGS 30-Meter DEM

12
30 Meter DEM Cell Boundaries

13
DEM Lattice Points

14
DEM Cells Store Elevation at Lattice Point

15
DEM Elevations 720 700 680 740 680 700 720 740 720

16
DEM Elevations 700 680

17
Overview zStudy area in West Austin with a USGS 30-meter DEM from a 1:24,000 scale map zEight direction pour point model (flow direction and flow accumulation grids) zStream network definition zWatershed delineation zDEM data sources
 zStream network definition zWatershed delineation zDEM data sources")
18
6756494650 121112 5344373848 5855223124 6147211619 3453 Digital Elevation Model

19
6756494650 121112 5344373848 5855223124 6147211619 3453 50 cell size cell (cell value) Cell Definition
 Cell Definition")
20
32 16 8 64 4 128 1 2 Eight-Direction Pour-Point Model

21
675649 534437 585522 1 675649 534437 585522 1 Slope: Direction of Steepest Descent

22
22448 1216 12484 1281248 21444 11 Flow Direction Grid

23
Austin West 30-Meter DEM Elevations in meters. ftp://ftp.tnris.state.tx.us/tnris/demA.html

24
Flow Direction Grid 32 16 8 64 4 128 1 2

25
Grid Network

26
0 0000 0 0 0 0 0 0 0 0 0 3 2 2 11 1 1 15 2 5 24 1 00 0 00 0 0 0 0 0 0 0 0 0 322 11 1 1 1 2 15 245 Flow Accumulation Grid

27
Overview zStudy area in West Austin with a USGS 30-meter DEM from a 1:24,000 scale map zEight direction pour point model (flow direction and flow accumulation grids) zStream network definition zWatershed delineation zDEM data sources
 zStream network definition zWatershed delineation zDEM data sources")
28
00 0 00 0 0 0 0 0 0 0 0 0 322 11 1 1 1 2 15 245 Flow Accumulation Threshold Flow Accumulation > 5 cells

29
Stream Network 00000 0 0 0 0 0 0 0 0 0 3 2 2 11 1 1 15 25 24 1 Stream network for a 5-cell threshold drainage area.

30
Stream Network Stream network for a 13.5-acres threshold drainage area (200 cells).
.")
31
+ = Take a mapped stream network and a DEM Make a grid of the streams Raise the off-stream DEM cells by an arbitrary elevation increment Burned-in DEM streams = Mapped streams Burning-in the Streams

32
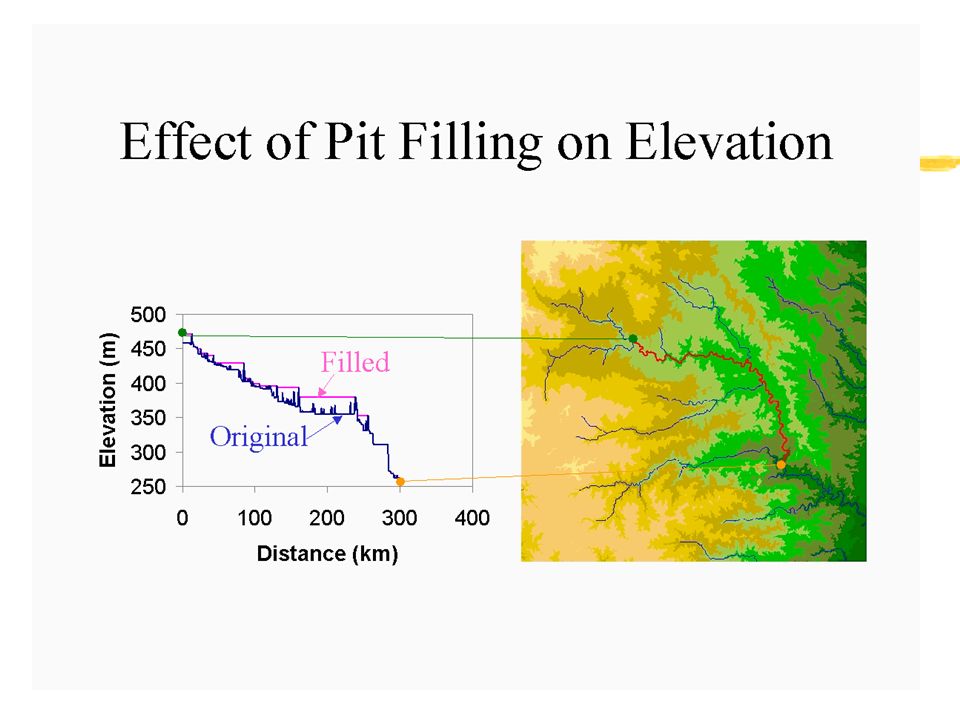
Filling in the Pits zDEM creation results in artificial pits in the landscape zA pit is a set of one or more cells which has no downstream cells around it zUnless these pits are filled they become sinks and isolate portions of the watershed zPit filling is first thing done with a DEM

34
Overview zStudy area in West Austin with a USGS 30-meter DEM from a 1:24,000 scale map zEight direction pour point model (flow direction and flow accumulation grids) zStream network definition zWatershed delineation zDEM data sources
 zStream network definition zWatershed delineation zDEM data sources")
35
Watershed Outlet

36
Watershed Draining to an Outlet

37
DEM-Based Delineation Found error hand delineation!!! Watershed and flow paths

38
00000 0 0 0 0 0 0 0 0 032 2 11 1 1 15 25 24 1 Stream Segments (Links)
")
39
5 5 1 1 3 2 2 3 3 4 4 4 4 4 5 5 6 6 6 Stream Segments Grid 3 6

40
989510 1504 (>1000) Threshold at Stream Junction 1000 cell threshold exceeded at stream junction.
 Threshold at Stream Junction 1000 cell threshold exceeded at stream junction.")
41
Same Cell Value Sub-Watersheds

42
Stream Vectorization Vector Streams Grid Streams

43
Stream and Sub-Watersheds

44
Overview zStudy area in West Austin with a USGS 30-meter DEM from a 1:24,000 scale map zEight direction pour point model (flow direction and flow accumulation grids) zStream network definition zWatershed delineation zDEM data sources
 zStream network definition zWatershed delineation zDEM data sources")
45
DEM Data Sources z30-m DEM’s from 1:24,000 scale maps z3" (100-m) DEM’s from 1:250,000 scale maps z15" (500-m) DEM for the US resampled from 3” DEM z30" (1-Km) DEM of the earth (GTOPO30)
 DEM’s from 1:250,000 scale maps z15 (500-m) DEM for the US resampled from 3 DEM z30 (1-Km) DEM of the earth (GTOPO30)")
46
30-m DEM’s zBest resolution standardized data source available for the US zCoverage of the country is incomplete zData by 7.5’ map sheets in UTM projection zLink for US: http://edcwww.cr.usgs.gov/Webglis/glisbin/guide.pl/glis/hyper/guide/usgs_dem zLink for Texas: ftp://www.tnris.state.tx.us/tnris/demA.html

47
3” DEM’s zDerived by US Defence Mapping Agency, available from USGS for the whole US. zData in geographic coordinates by 1:250,000 map sheet names (1°x 1°) cells in (1°x 2°) maps zNeeds to be projected to planar coordinates zLink: http://edcwww.cr.usgs.gov/doc/edchome/ndcdb/ndcdb.html
 cells in (1°x 2°) maps zNeeds to be projected to planar coordinates zLink:")
48
7.5´ 1º 3" (100m) DEM 30m DEM Coverage of 30-m and 3" DEM’s
 DEM 30m DEM Coverage of 30-m and 3 DEM’s")
49
Cell Size 30m100m 30-m and 3" DEM’s

50
15" DEM zDerived by USGS from 3" DEMs by resampling each fifth point zBest resolution for seamless coverage of the US in a single grid zProjected cell size is 500m zLink: http://nsdi.usgs.gov/nsdi/wais/water/gcip.HTML

51
30" DEM GTOPO30 zProduced by USGS from 3" grids and Digital Chart of the World topography zCoverage complete for the earth zProjected cell size is 1km approximately zData must be projected before use zLink: http://edcwww.cr.usgs.gov/landdaac/gtopo30/gtopo30.html

52
30" DEM GTOPO30

53
Drainage in North America Source: http://edcwww.cr.usgs.gov/landdaac/gtopo30/hydro/namerica.html

54
Summary Concepts (1) zTopographic maps are the traditional way of representing land surface terrain and streams. zWatersheds can be hand-delineated from these maps. zDEM’s of equivalent accuracy are now available for most map series in the US. zDEM cell elevation is at the cell center. zEight direction pour point model leads to flow direction and flow accumulation grids.

55
Summary Concepts (2) zStream network is defined as cells whose flow accumulation exceeds a threshold. zStreams can be divided into links and sub-watersheds defined for them. zWatershed outlet is the cell with highest flow accumulation. zResulting grids can be vectorized. zStandardized DEM data sources: 30m, 3”, 15”, 30”, which cover from local scale to the whole earth

Similar presentations