Download presentation
Presentation is loading. Please wait.

1
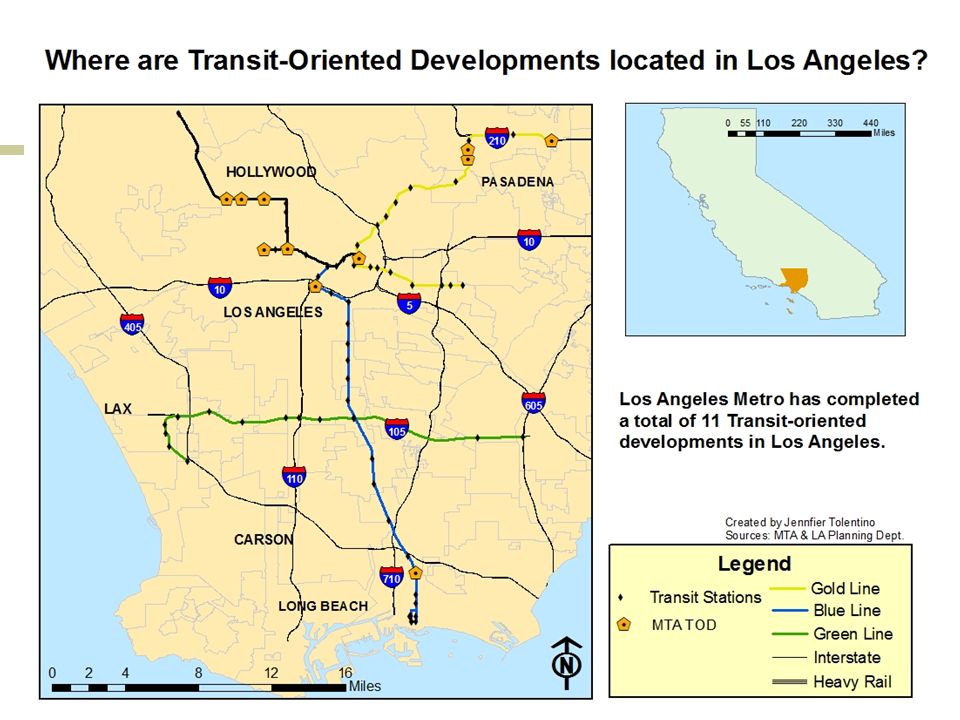
Transit-Oriented Development in Los Angeles County By Jennifer Tolentino Fall 2010

2
Elements of a Successful TOD Mixed land uses Incorporation of both residential and commercial zones in order to maximize proximity to services and amenities. Limited parking Requiring a maximum parking restriction verses a minimum reduces the cost of development and increases incentives for transit usage. Increased transit ridership TOD is often linked to further development of the transit line. Therefore increasing ridership through TOD can create a positive feedback cycle for both TOD along the line, and the transit itself. Surrounding area should be “human scaled” Area should be pedestrian and bike friendly, with viable means of transport once riders arrive at station, e.g. effective bus transfers. High Density For a TOD is be successful along all of the aforementioned criteria, it must be developed in high density areas.

3
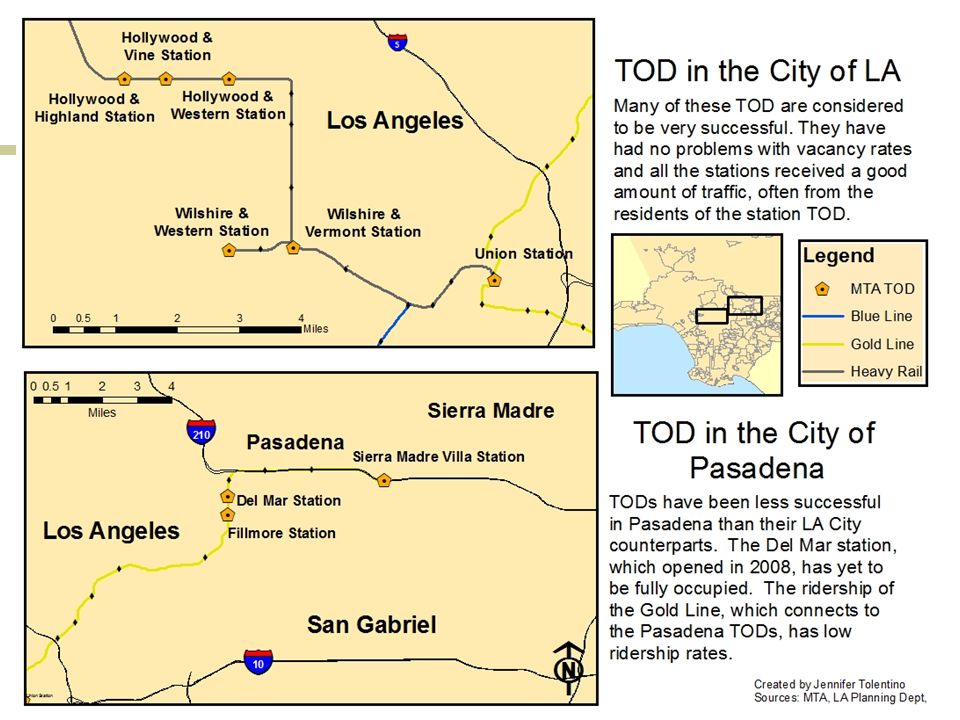
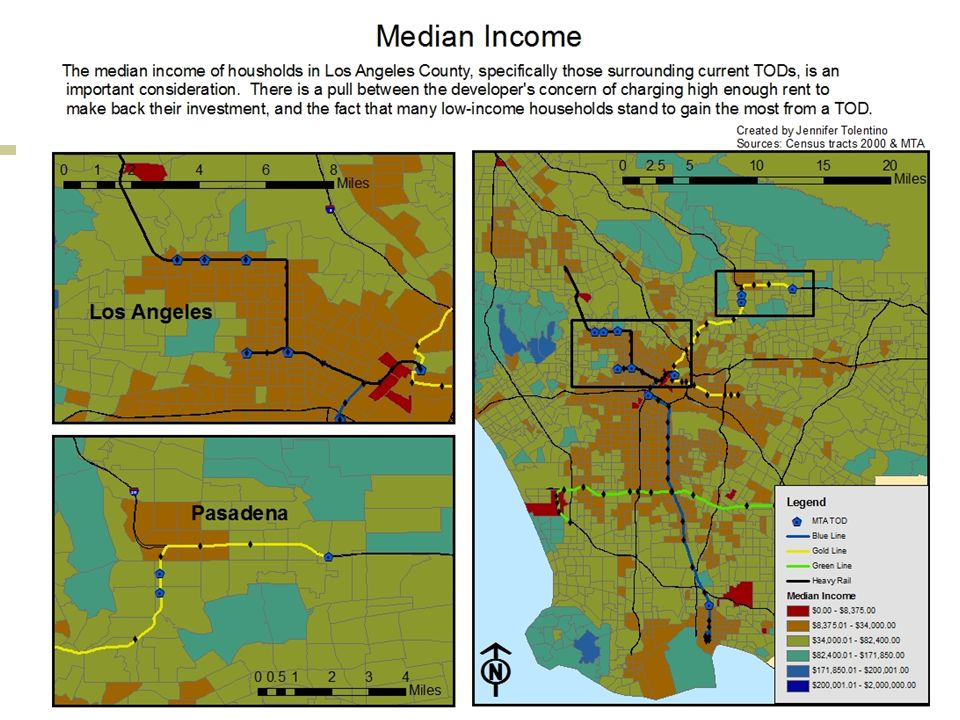
Challenges for TOD in LA County Not all areas of LA have the necessary density. The current transit system may not be well-enough established. Unclear if Angelinos are willing to pay higher rents to live near transit. Standard land appraisal methodology show LA TODs in some areas to have a prohibitive amount of risk for financing. Pictured: Del Mar Station TOD in Pasadena, currently only 2/3 occupied

6
Retail Centers

7
Vehicle Access

8
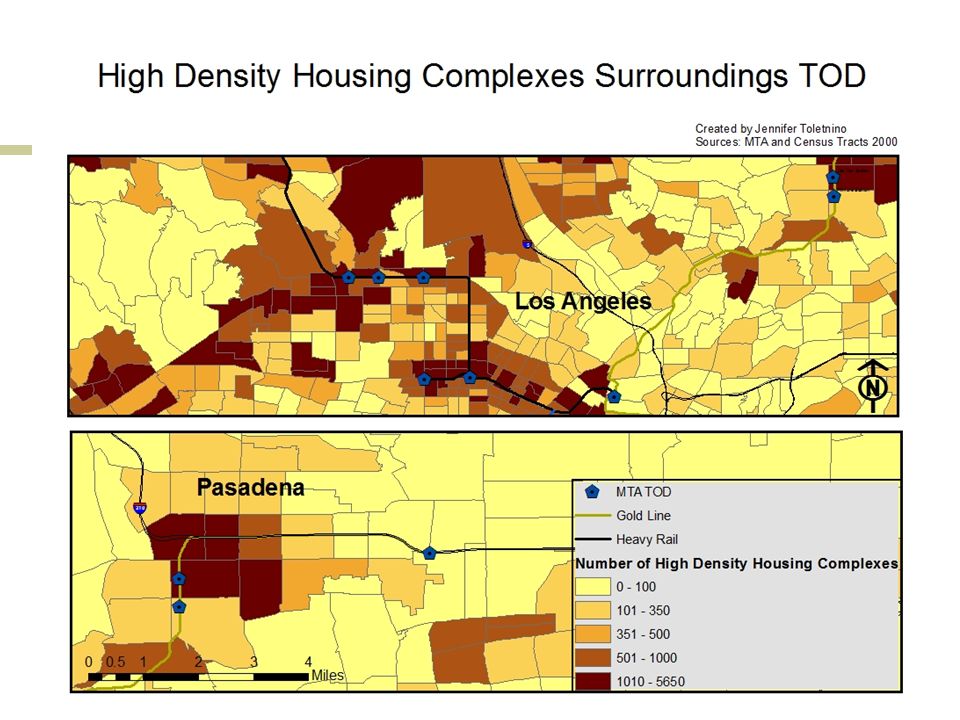
Density

10
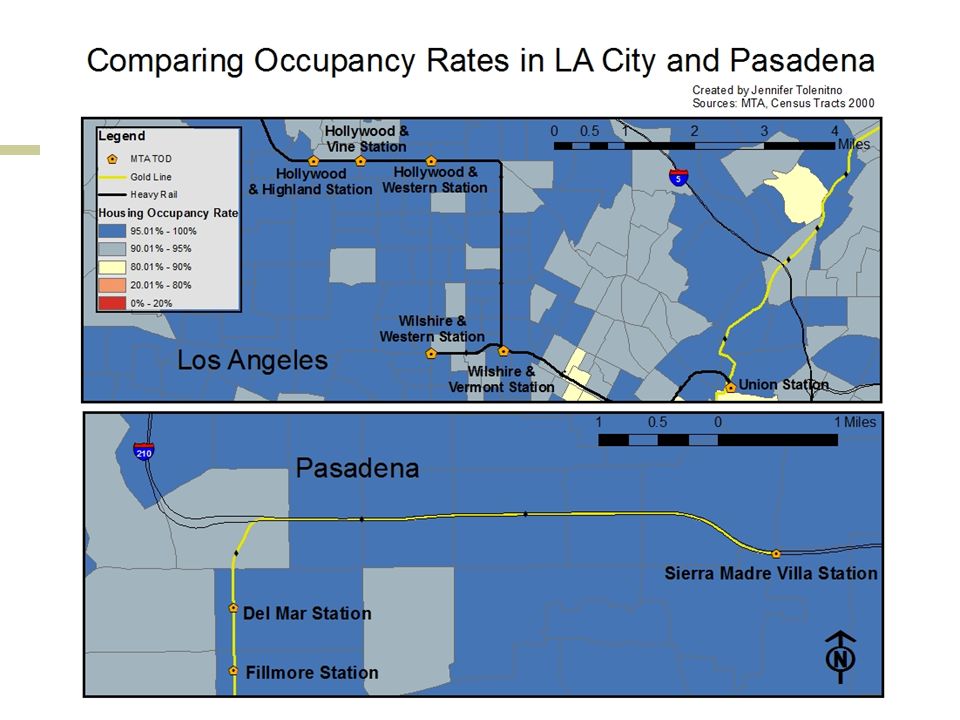
Occupancy Rates All of LA County

15
Recommendations Transit-oriented development can be successful in Los Angeles County, but it needs to be assessed on multiple dimensions. TOD should be focuses in areas that have the highest number of existing attributes which will contribute to a successful TOD. When assessing the possibility of building a TOD, a more comprehensive look at the area along the transit line should be considered. Taking into consideration access to amenities further down the line rather than merely looking at ½ radius around the station.

16
For Further Research Given Census 2000 data was used, it will be more useful to look at TODs in these dimensions but with more current information. Look into the current willingness-to-pay for those who currently reside in TODs. Has ridership increased with TODs in Los Angeles, if so, how much? Is LA County willing to reduce the number of parking spaces required for TOD in order to promote transit use over vehicles?

17
Skills Used Slide 4: Inset, 7 Layers. Slide 5: Use of original data: “MTA TODs”, created through geocoding and information from MTA. See Metadata slide. Slide 6: Measurement Analysis Buffer. Created ½ mile radius around transit stops to determine how many retail centers fell into “walk-able area”. Slide 7: Aggregated attribute fields: combined 11 ethnic household groups defined as having “no vehicle” into one variable “no vehicle”. Displayed variable using Dot Density. Slide 8: Created Index: New variable “occupied housing rate” was created by: occupied units / total housing units. Slide 11: Created Index: combined 20-49 units housing complexes and 50+ to create new variable “high density housing”. Slide 13: Hotspot Analysis: created raster files using model (see slide), reclassified, created variable for “distance to transit station”. Gave 2x as much weight to proximity to transit stations in calculation. Slide 14: Hotspot Analysis: used same raster data, but left “distance to transit station” out of calculation.
, reclassified, created variable for distance to transit station . Gave 2x as much weight to proximity to transit stations in calculation. Slide 14: Hotspot Analysis: used same raster data, but left distance to transit station out of calculation..")
18
Metadata

19
Model

Similar presentations