Download presentation
Presentation is loading. Please wait.

1
Harvard’s Reinhart and Rogoff « Growth in a time of debt » (2010) and GDP measurement errors (since around 20th march 2013) « now infamous » Reinhart and Rogoff (2010) bivariate relationship between growth and debt/GDP
 and GDP measurement errors (since around 20th march 2013) « now infamous » Reinhart and Rogoff (2010) bivariate relationship between growth and debt/GDP")
2
Plan 1.Herndon Ash Pollin versus RR 2.New Zealand GDP 1951 « Magical Mystery Tour »

4
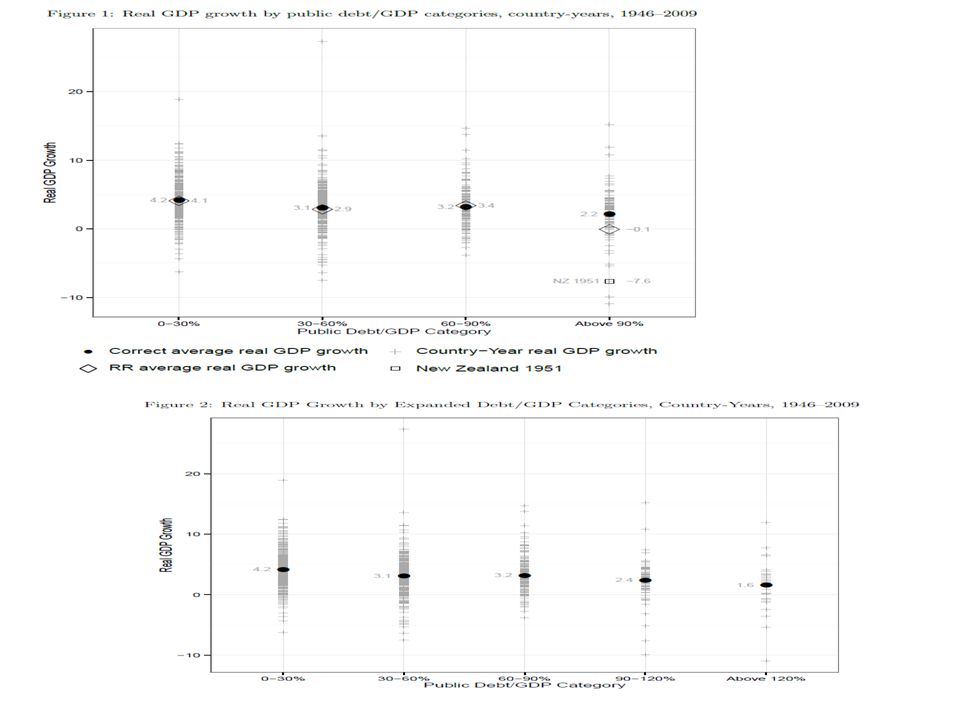
Growth in a Time of Debt Carmen M. Reinhart and Kenneth S. Rogoff January 2010: Abstract NBER “We study economic growth and inflation at different levels of government and external debt. Our analysis is based on new data on forty-four countries spanning about two hundred years. The dataset incorporates over 3,700 annual observations [more data, more truth argument…] covering a wide range of political systems, institutions, exchange rate arrangements, and historic circumstances [heterogeneous data set turned into universal (general law) argument…] Above 90 percent, median growth rates fall by one percent, and average growth falls considerably more.“
 argument…] Above 90 percent, median growth rates fall by one percent, and average growth falls considerably more. .")
5
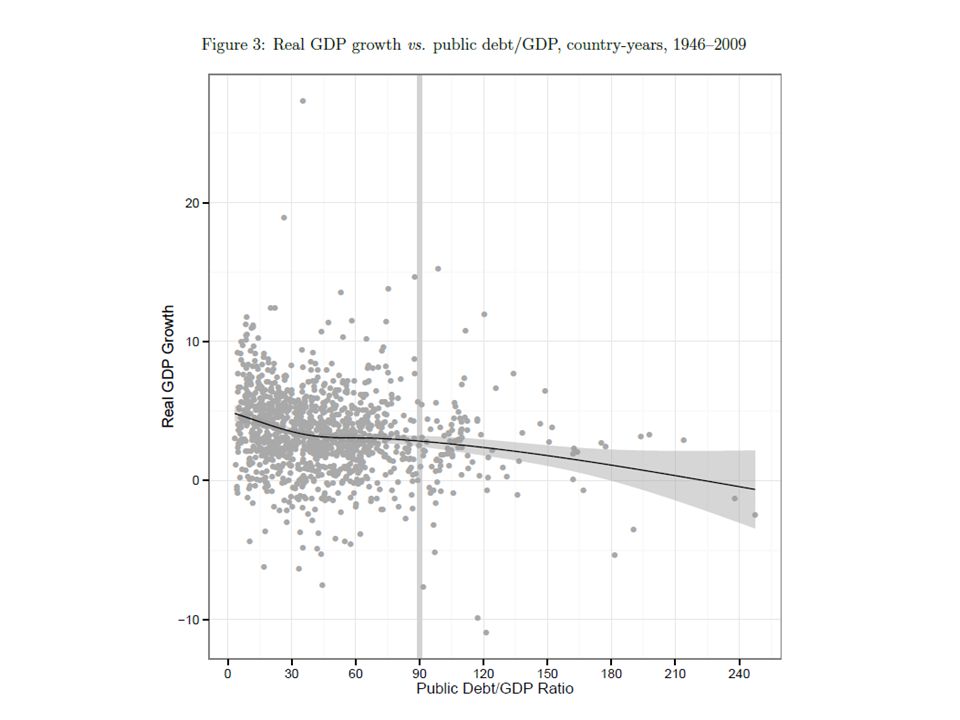
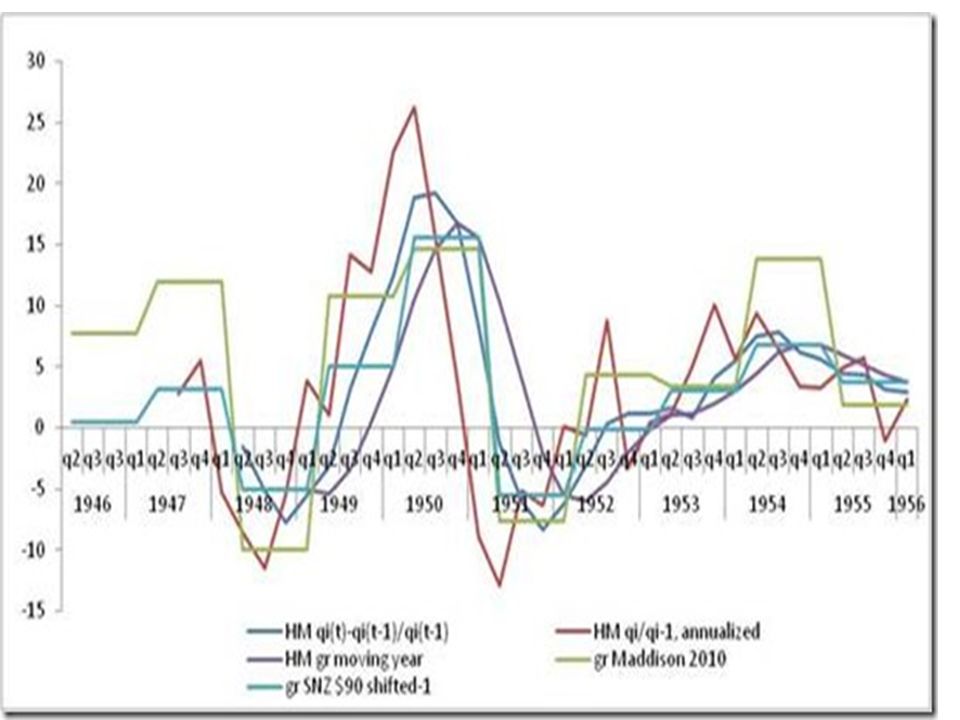
Herndon Ash Pollin release of RR replication Around 20th of march 2013. (1) Mean growth 0% debt/GDP>90% (1946-): average (of averages per country) on 7 observations (starting with 3700 observations…) with 1 observation = NZ1951 (for >90%), omitting 1946-1950 years, excel errors omitting countries. (no tests of difference of means showing degrees of freedom, which would have revealed N=7) (2) Non parametric Lowess regression (1945-): decrease before 30%, flat 30%-120%, decrease 120%. (negative – zero – negative)
 Mean growth 0% debt/GDP>90% (1946-): average (of averages per country) on 7 observations (starting with 3700 observations…) with 1 observation = NZ1951 (for >90%), omitting years, excel errors omitting countries. (no tests of difference of means showing degrees of freedom, which would have revealed N=7) (2) Non parametric Lowess regression (1945-): decrease before 30%, flat 30%-120%, decrease 120%. (negative – zero – negative).")
6
The complementarity between 2 transformations increased the weight of a single outlier: NZ-1951 1)Transform a continuous variable into a categorical discrete variable (binning): debt/GDP. (May make sense in order to reduce noise in variance), but the choice of bins frontiers matters: do non-linear lowess before to decide upon thresholds. 2)Average over time of observations per country (between transformed), May make sense (although correlated with individual random effects), but for unbalanced panel may increase of the weight of a single observation.
, but the choice of bins frontiers matters: do non-linear lowess before to decide upon thresholds. 2)Average over time of observations per country (between transformed), May make sense (although correlated with individual random effects), but for unbalanced panel may increase of the weight of a single observation..")
10
Bradford de Long blog (without using between transformed data): visual test of difference of means
: visual test of difference of means")
11
1.Control variables 2.Causality (lags on current values), 5 years averages/yearly data 3.Outliers sensitivity of logistics (for the the declining shape for Debt/gdp>150). 4.Measurement errors in historical data before 1960 5.Debt/GDP=(1+g(debt)-g(GDP))*debt/GDP(-1)
-g(GDP))*debt/GDP(-1).")
12
B. New Zealand 1951 GDP growth Coincidentally, Reinhart and Rogoff’s « outlier » Is a fantastic example of difficulties when using GDP statistics before 1960

13
NZ 1951 1.Calendar issues 2.Missing sources 3.Deflator issue in order to obtain real GDP from nominal GDP with an enormous transitory shock of export price on a few months of a key commodity.

14
The NZ 1951 Magical Mystery Tour: debt/GDP=91%>90% (1951) Maddison (RR): -7.6% GDP growth, NZ stats data website: +15% GDP growth DIFFERENCE of GROWTH RATE: +22.6% After 8 weeks of emails with NZ colleagues+G Silverberg…
 Maddison (RR): -7.6% GDP growth, NZ stats data website: +15% GDP growth DIFFERENCE of GROWTH RATE: +22.6% After 8 weeks of s with NZ colleagues+G Silverberg…")
15
Wikipedia: NZ Wool boom 1951 Best post-war growth year ever!

16
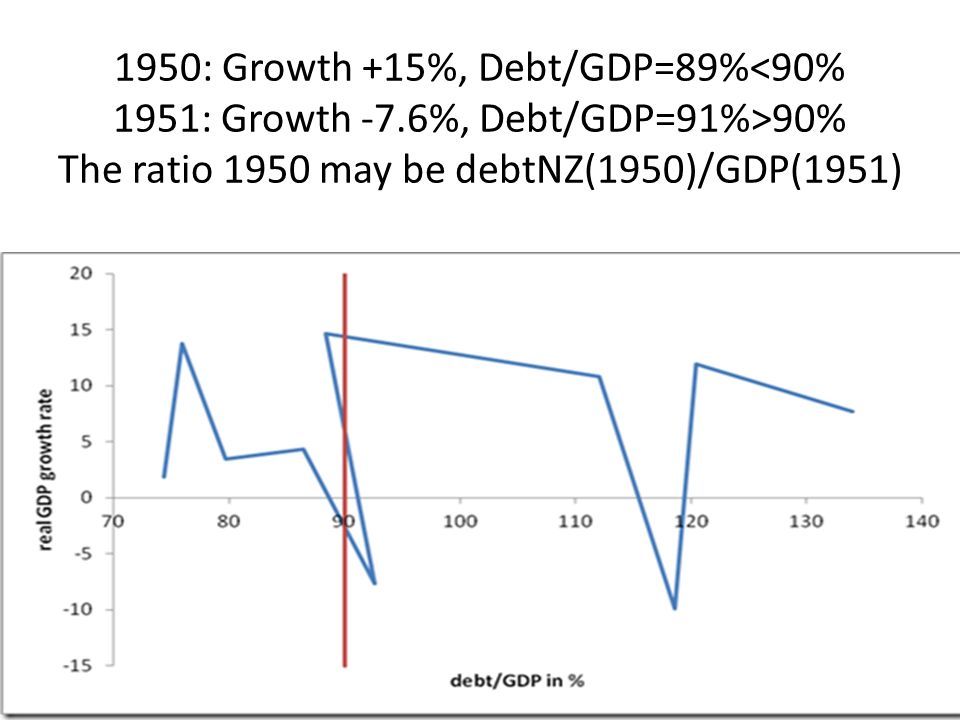
(1) Year convention: 1950 is 1951 and conversely NZ: 1951 means NZ fiscal year convention: 1st of april 1950 to 31st of march 1951. Maddison: 1951 means NZ fiscal year+1 1st of april 1951 to 31st of march 1952. Still unclear for IMF data, RR and everybody: Public debt NZ1951 / maddison GDP 1951: Debt (NZ source) 1950/GDP 1951???
 1950/GDP")
18
(2) Unknown data sources 1950-1954 for Maddison 1947, 1954, and so on: Still unexplained wide discrepancies between Maddison data and NZ sources on given years (Maddison pooled primary sources and adjusted): 1960-1939: Same source (Rankin) for Maddison and NZ. 1940-1955: Easton (NZ) versus C. Clark 1940-1950 for Maddison and… 1950 to 1954 (or 1951 to 1955) source by Maddison is completely a UNKNOWN « OECD » SOURCE (even from Bart VAN ARK, head of Maddison project) from NZ stat. which is the provider of stats to OECD….
 versus C. Clark for Maddison and… 1950 to 1954 (or 1951 to 1955) source by Maddison is completely a UNKNOWN « OECD » SOURCE (even from Bart VAN ARK, head of Maddison project) from NZ stat. which is the provider of stats to OECD…..")
19
(3) Deflator issue: nominal/real GDP Wool price/Wool production
 Deflator issue: nominal/real GDP Wool price/Wool production")
20
1950: Growth +15%, Debt/GDP=89% 90% The ratio 1950 may be debtNZ(1950)/GDP(1951)
/GDP(1951)")
22
Before 1960: HISTORICAL (Maddison collection of) GDP data are controversial estimates, measurement errors are very large and cumulated on GDP level by chaining backward GDP level data using growth estimates: Econometrics should take care of structural breaks in measurement errors of GDP and heteroskedasticity when pooling data before 1960 with data after 1960. MORE DATA, MORE HETEROGENEITY: MORE « ROBUST » INFERENCE IS NOT GRANTED AT ALL when adding GDP data from 1880-1960.

23
Trends matters more than point-year relationship between Debt/GDP and Growth: - Investigate trends - Do average over several years - 1945-1955: GDP denominator post war large trend « Explains » why debt/GDP fall.

24
Less wrong: The value of replication Data set and code (excel, stata, sas, R) should be published online in journal websites. The argument of the « privacy » of data in economics is a lie for macroeconomic data. Retraction of published papers in top journal in economics is not done, by contrast with other fields top journals such as Nature (so far up to 15 papers retracted in 15 years in second tier economic journals [retraction website]). No retraction: more citations, larger impact factor: scientific ambiguity boosts scientific reputation.
. No retraction: more citations, larger impact factor: scientific ambiguity boosts scientific reputation..")
25
Veritas filia temporis

Similar presentations


 (a)At market prices. Contributions may not sum.>")


 Andrés Velasco (Harvard University & NBER) 10th BIS Annual Conference,>")

 Data.>")


