Download presentation
Presentation is loading. Please wait.

1
Todd D. Taylor, Ph.D. Genome Annotation and Comparative Analysis Team Computational and Experimental Systems Biology Group RIKEN Genomic Sciences Center taylor@gsc.riken.jp Bioinformatics and Comparative Genome Analysis Course Institut Pasteur Tunis - Tunisia April 2, 2007

3
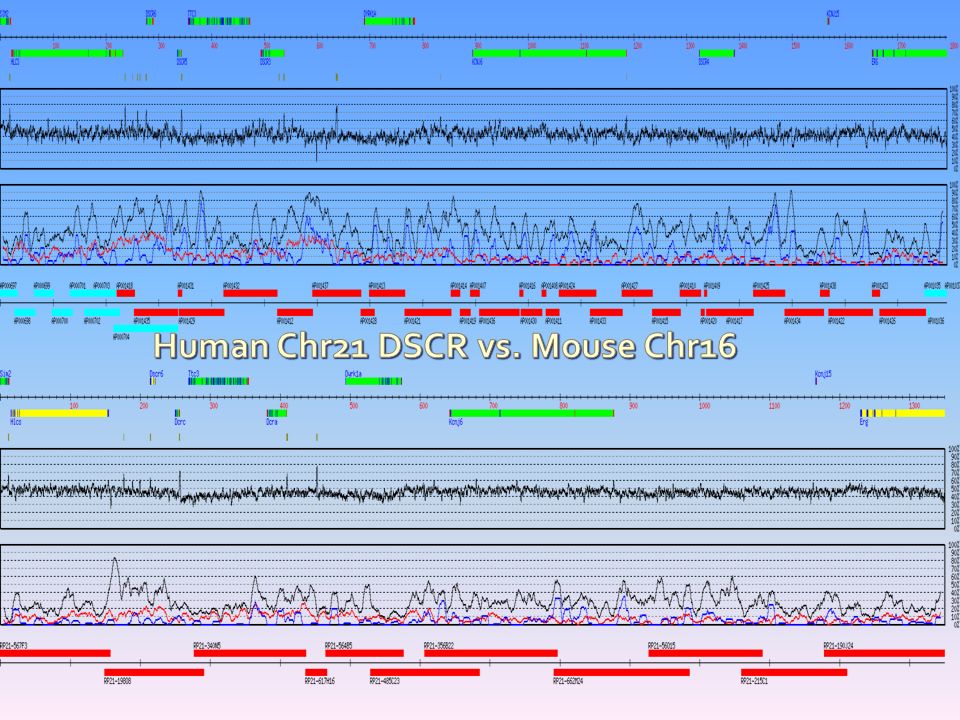
Human Chromosome 21 (Nature, May 2000) 17 of 33.5 Mb Chromosome 18p (Nature, September 2005) 16 Mb Chromosome 11q (Nature, March 2006) 81 Mb ~4-5 % contribution to the Human Genome Project Chimpanzee Chromosome 22q (Nature, May 2004) 33.5 Mb (syntenic to human chr21) Chromosome Y (Nature Genetics, January 2006) Development of novel methods for gene and promoter prediction Identifying genes missed by other high-throughput methods Identification of unique regulatory mechanisms
 17 of 33.5 Mb Chromosome 18p (Nature, September 2005) 16 Mb Chromosome 11q (Nature, March 2006) 81 Mb ~4-5 % contribution to the Human Genome Project Chimpanzee Chromosome 22q (Nature, May 2004) 33.5 Mb (syntenic to human chr21) Chromosome Y (Nature Genetics, January 2006) Development of novel methods for gene and promoter prediction Identifying genes missed by other high-throughput methods Identification of unique regulatory mechanisms")
4
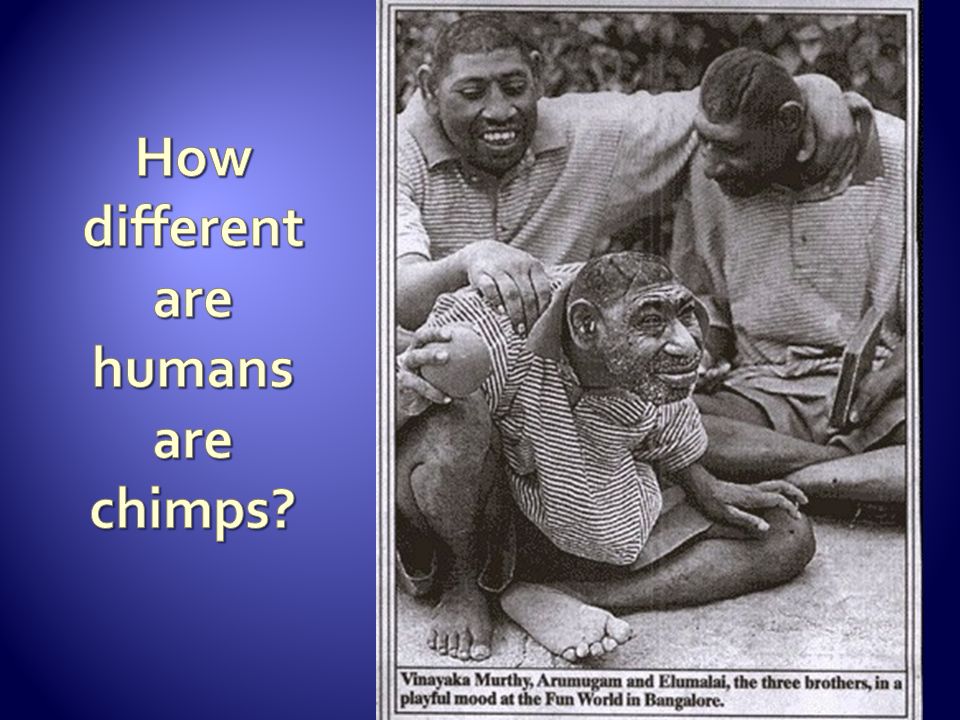
Looking for similarities Compare with distant species, like mouse Regions that are conserved may be important Looking for differences Compare with close species, like primates Regions that are different may be important Of course, there are exceptions to every rule!

5
Homo Pan Gorilla Gibbons Old world monkeys New world monkeys Prosimians Hominidae Catarrhini Hominoidea Anthropoidea Primates Eutheria (placentalia) Mammalia Lagomorpha Rodents Sauropsida Amniota (amniotes) Pongo 5 MYa Hominoidea Primates Mammalia Reptilia + Aves ~350MYa ~ 25 0MYa Metatheria Prototheria Hominidae Heterodonty Mammary glands Homoeothermic Hair Placentation (in most), amnion, internal fertilization Sweat and sebaceous glands Anucleate red blood cells
 Mammalia Lagomorpha Rodents Sauropsida Amniota (amniotes) Pongo 5 MYa Hominoidea Primates Mammalia Reptilia + Aves ~350MYa ~ 25 0MYa Metatheria Prototheria Hominidae Heterodonty Mammary glands Homoeothermic Hair Placentation (in most), amnion, internal fertilization Sweat and sebaceous glands Anucleate red blood cells")
6
34% maps to identical sequence in human genome Hiram Clawson and Kate Rosenbloom (UCSC). 09 June 2006

7
95% maps to identical sequence in human genome Hiram Clawson and Kate Rosenbloom (UCSC). 09 June 2006

11
Nobrega, et al. Science 302, 413 (2003)
")
16
Size Intelligence Language Ageing Disease susceptibility Cancer Schizophrenia Autism Triplet expansion diseases AIDS Hepatitis

17
Newton,2002 年4月号

18
Science 295, 131-134 (2002)
")
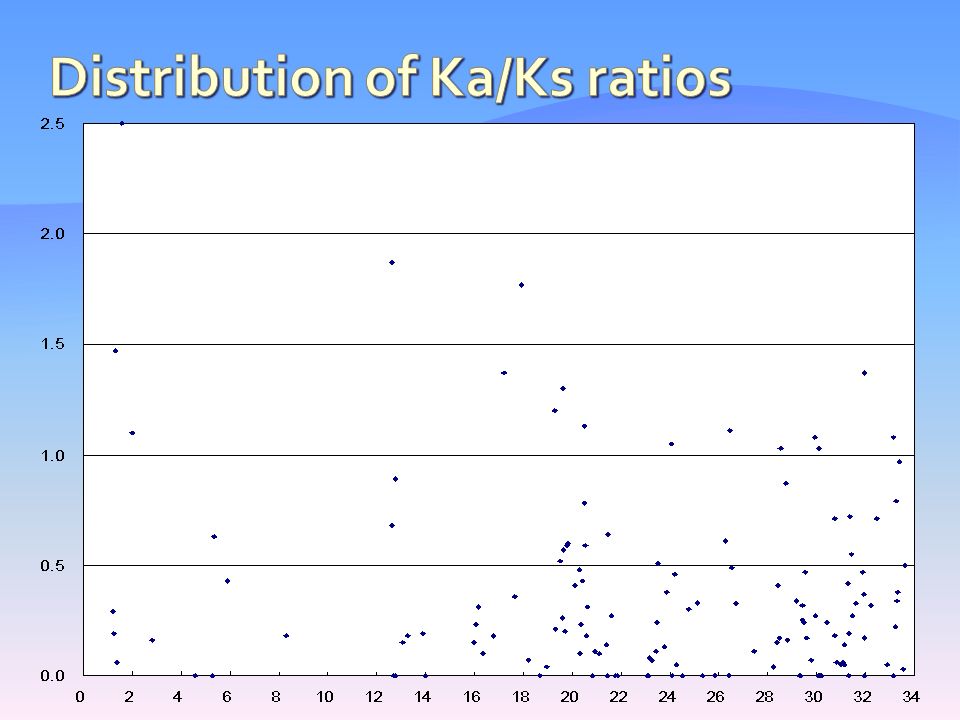
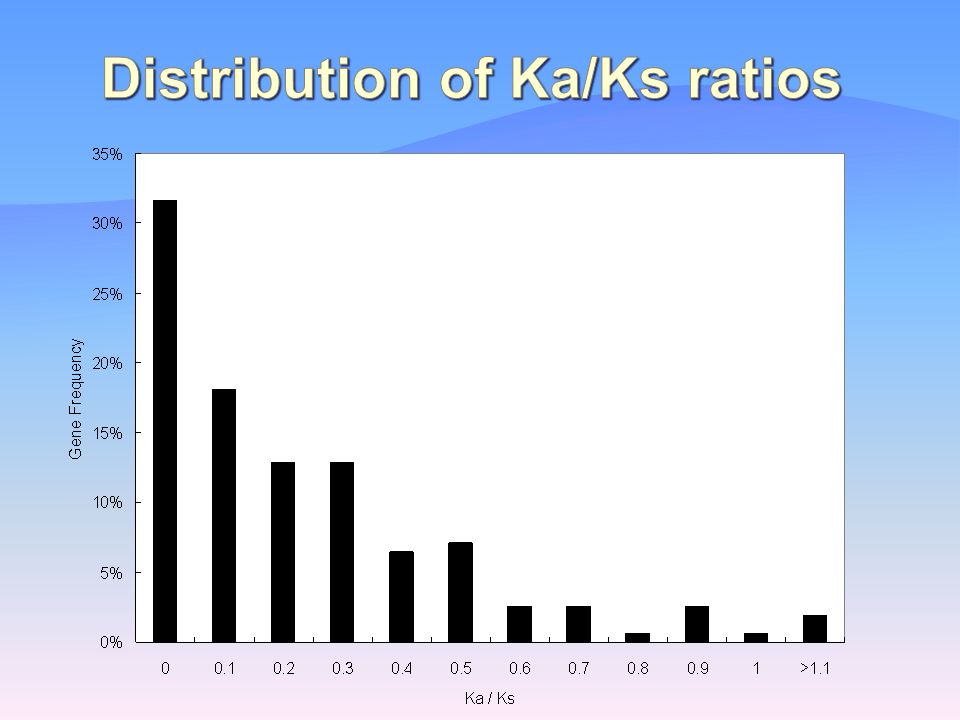
21
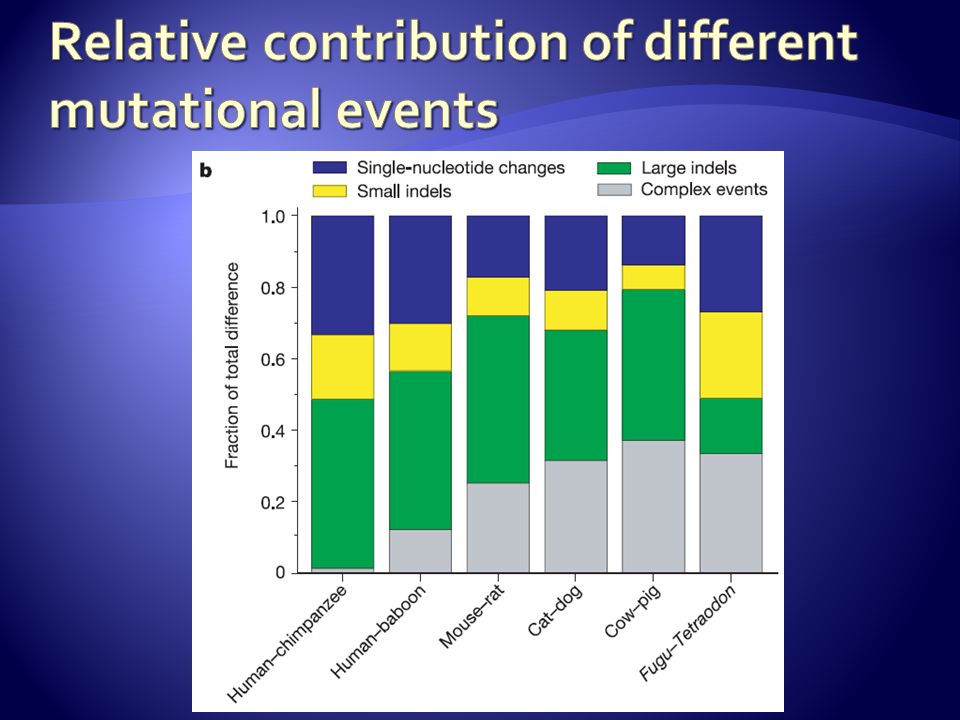
1.23% substitution

22
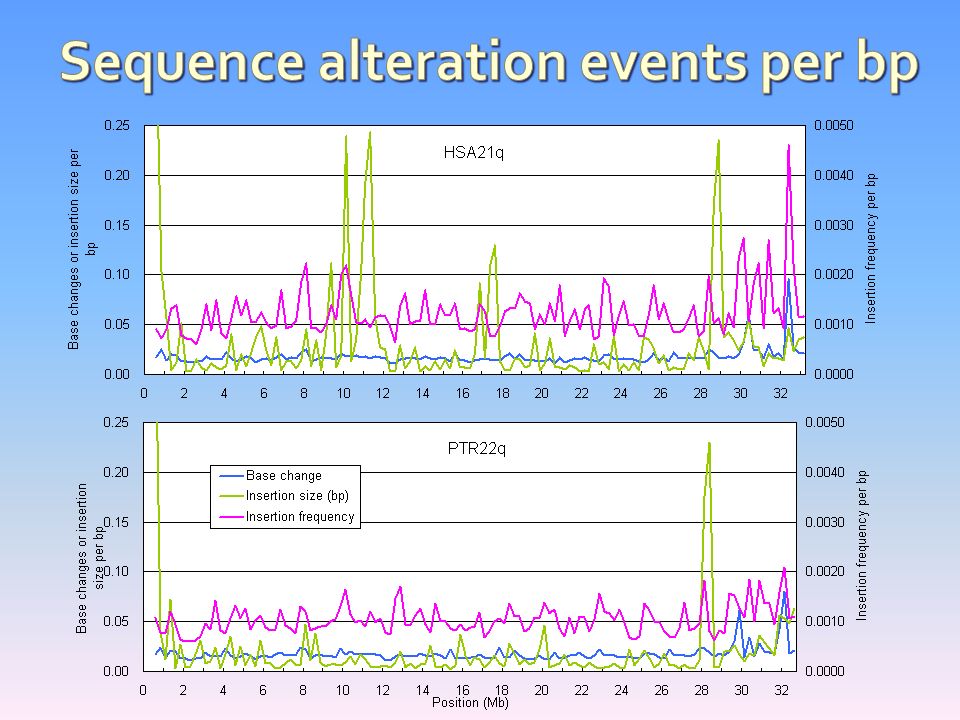
Number of simple repetitive sequences Insertion of Alu and L1 elements Unique sequences Local duplications Translocations Inversions Fewer CpG Islands predicted in chimp

23
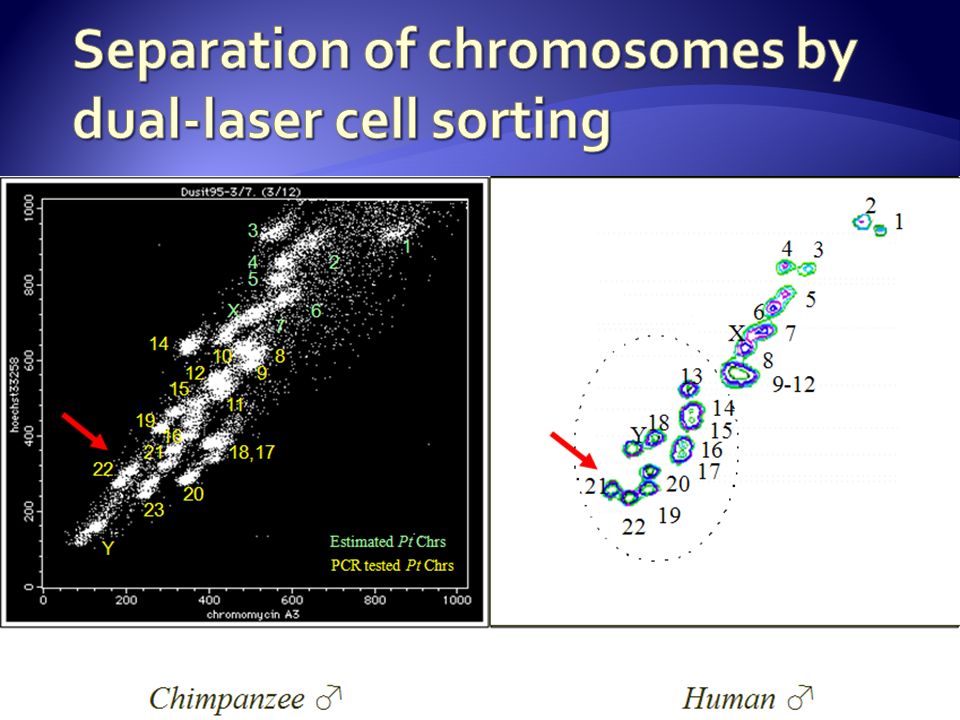
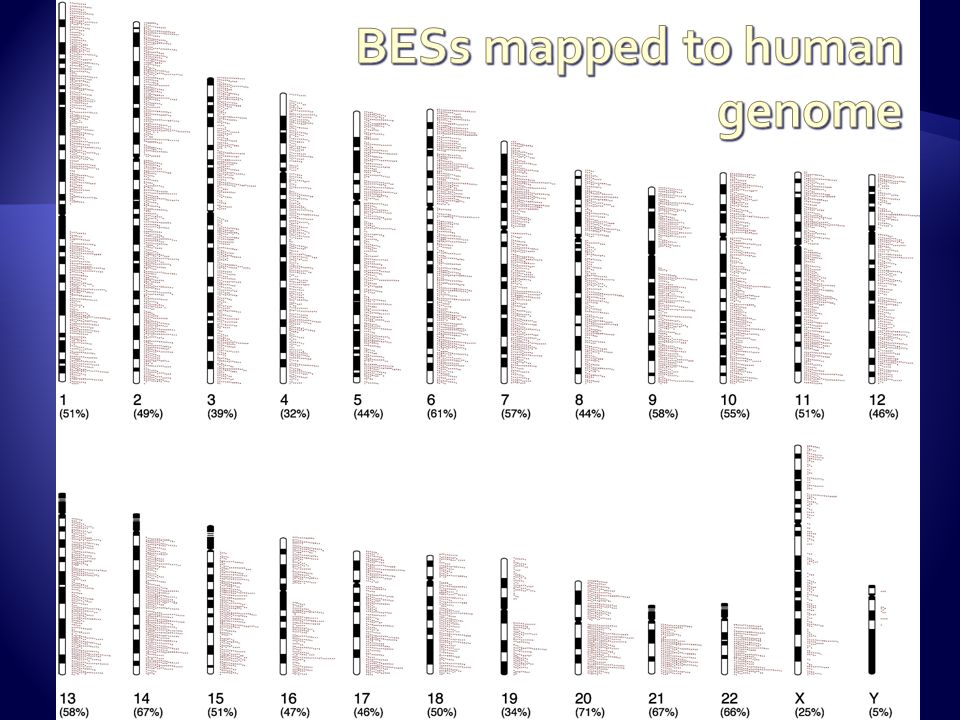
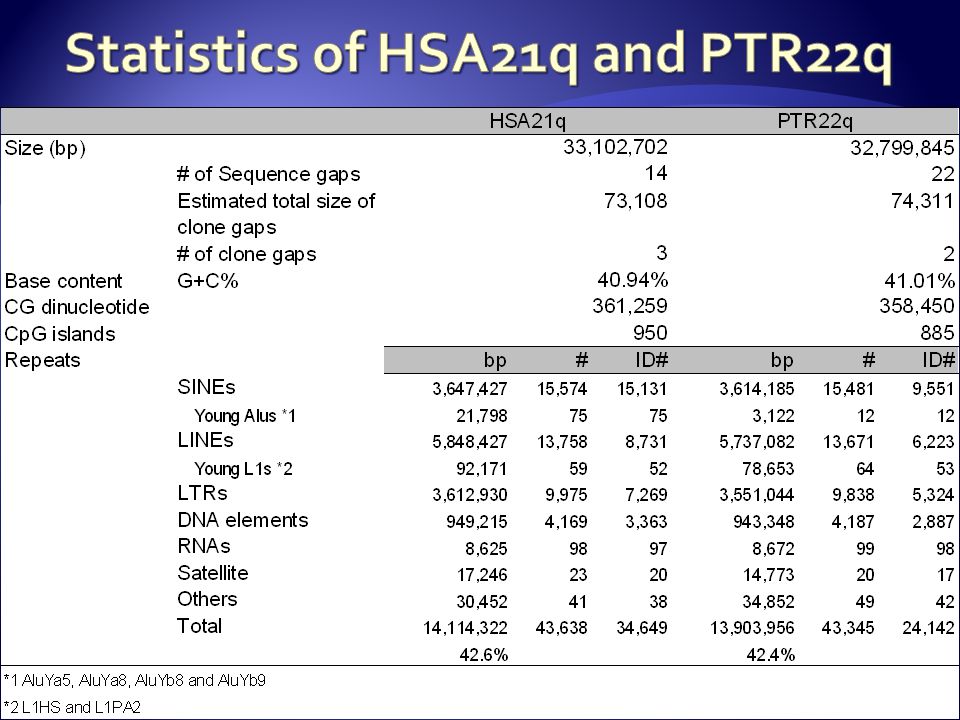
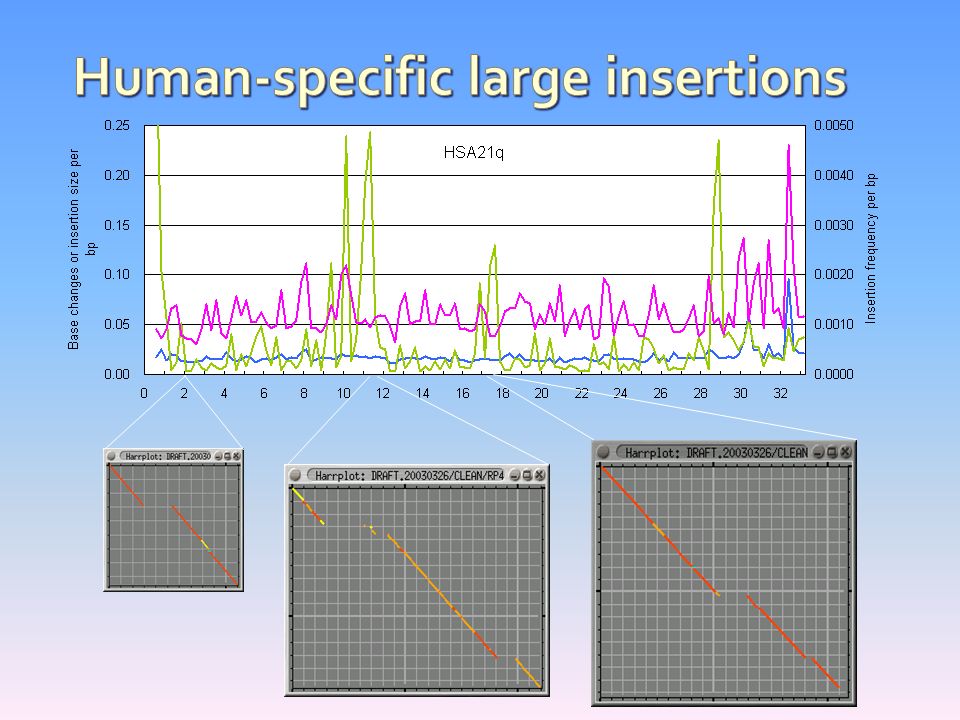
Compare with small ‘representative’ human chromosome (21) Clone-based sequencing strategy Map chimp BAC-end sequences to human chr. 21 Screen libraries for additional clones to fill gap regions 3 gaps, over 99% coverage

24
Human Chr21 q-arm Chimp Chr22 q-arm 100% 85% 5Mb Identity

25
Human Chr21 q-arm Chimp Chr22 q-arm 100% 85% 1Mb Identity

27
Chimpanzee Sequencing & Analysis Consortium. Nature (205) 437:69-87
 437:69-87")
28
Overall : 1.44% SINE/Alu1.81% LINE/L11.38% CpG islands2.26% Simple repeats4.06%

29
Base change Insertion frequency Base change1.000- Insertion frequency0.9071.000 Insertion size0.0510.013

31
FamilySubfamilyHS21PTR22 LINE/L1L1HS112 LTR/ERV1HERVIP10FH145 MER41A-int102 MER4A1-int50 MER83B-int110 MER873212 SINE/AluAluYa5233 AluYb8372 AluYb971 DNA/MER2Tigger34267 LTR/ERV1LTR49-int1123 LTR/MaLRMLT1E-int05

32
Human-specific characteristics have been acquired during the 5 million years since the divergence between Pan and Homo. Phylogeny of Hominidae Time Gorilla Pan (Chimpanzee) Homo (Human) Pongo (Orangutan) 5 〜6 MYa Human(?) Chimpanzee Gorilla Orangutan
 Homo (Human) Pongo (Orangutan) 5 〜6 MYa Human( ) Chimpanzee Gorilla Orangutan.")
33
Homo ACGTGTTTGAAATATTACTGATTGTAA Pan ACGAGTTTGAAATATTATTGATTGTAA Gorilla ACGTGTTTGAATCATTATTGATTGTAA Orangutan ACGTGTTTAAATTATTATTGGTTGCAA LCA ACGTGTTTGAAATATTATTGATTGTAA Gorilla Pan (Chimpanzee) Homo Pongo (Orangutan) Time LCA Outgroup (LCA: The Last Common Ancestor)
 Homo Pongo (Orangutan) Time LCA Outgroup (LCA: The Last Common Ancestor)")
35
Human Chimpanzee Gorilla Orangutan IN/DEL examination based on 10,292,002 finished sequences RIKEN total PCR primers designable good amplification for both* insertion to the human sequence 267158139 insertion to the chimp sequence 222147128 489305267 * positive amplification found for both chimp and human template DNA

36
106 1 2 3 4 1 2 3 4 1 1 2 Example 1 Deletion in Human Lineage Example 2 Insertion in Human Lineage 1 2 3 4 1 2 3 4 1 1 2 Pt Hs Gg Pp 117 129 Example 3 Deletion in Chimp Lineage 1 2 3 4 1 2 3 4 1 1 2 Pt Hs Gg Pp 1900 980 2900 4200 1300 4200 106 1 2 3 4 1 2 3 4 1 1 2 154 Example 4 Allelic Deletion in Chimp Lineage 1 2 3 4 1 2 3 4 1 1 2 Pt Hs Gg Pp 1200 2400

37
284 genes 223 known 19 novel CDS 25 novel transcripts 12 putative 5 predicted 85 pseudogenes

38
We lacked information for 6 genes located in sequencing gaps 6 hsa21 genes are absent from the ptr22 sequence (H2BFS, 5 KAP genes from the 21q22.1 cluster) 4 hsa21 genes appear to be pseudogenes in chimp 3 ptr22 pseudogenes are absent from the hsa21 sequence 1 hsa21 pseudogene has a complete ORF in ptr22
 4 hsa21 genes appear to be pseudogenes in chimp 3 ptr22 pseudogenes are absent from the hsa21 sequence 1 hsa21 pseudogene has a complete ORF in ptr22")
39
83% of genes have at least one amino acid replacement 10% of the potential ptr22 proteins are predicted to have a different length Amino acid insertion or deletion Different start codon Different stop codon Other, more complex rearrangement

40
Shorter in chimp: ADAMTS5 Longer in chimp: C21orf30

41
17 bp deletion in chimpanzee Human and chimpanzee splice sites are different Splice-site diversity

42
C21orf71 C21orf9 TCP10L C21orf96 FLJ32835 The human chr21 genes ordered according to their chromosomal position Sequence identity

43
Human-specific replacements 1. KIAA0184 2. COL6A2 3. HUNK 4. AGPAT3 5. DSCR3 6. PWP2H 7. STCH 8. SLC5A3 9. CHAF1B 10. SIM2 11. KCNE2 12. APP 13. C21orf98 14. C21orf61 15. IFNAR1 16. UBASH3A 17. TMPRSS3 18. DSCR1 19. C21orf7 20. ADARB1 21. TSGA2 22. IFNAR2 23. C21orf63 24. KCNE1 25. C21orf2 26. C21orf55 27. ATP5A 28. CLDN8 29. C21orf56 30. DNMTA1 Chimp-specific replacements 1. BACE2 2. TIAM1 3. BACH1 4. FAM3B 5. C21orf33 6. ADAMTS1 7. C21orf103 8. ITGB2 9. HLCS 10. DNMT3L 11. IFNGR2 12. PPIA3L 13. C21orf59 14. MRPL39 15. CLDN17 16. KRTAP11-1 17. CCT8 18. DSCR2 19. TFF2 20. BTG3 21. HSF2BP 22. C21orf115

46
Chimpanzee Sequencing & Analysis Consortium. Nature (205) 437:69-87
 437:69-87")
47
Correralate phenotype with genotype Using Affymetrix arrays it could be shown that the amount of transcript/gene varies in a species-specific manner (Enard et al. 2001). -> What DNA sequence differences are responsible for the observed differences in transcript-levels?
. -> What DNA sequence differences are responsible for the observed differences in transcript-levels .")
48
Transcription start site (TSS) Promoter Enhancer 3‘UTR 5‘UTR Transcriptional control RNA stability
 Promoter Enhancer 3‘UTR 5‘UTR Transcriptional control RNA stability")
49
ANNOTATED GENES DETECTED GENES UPREGULATED (IN HUMAN) DOWNREGULATED (IN HUMAN) 237 genes annotated for chromosome 21 189 represented on the affymetrix A-E arrays
 DOWNREGULATED (IN HUMAN) 237 genes annotated for chromosome represented on the affymetrix A-E arrays")
50
189 annotated genes represented on the Affymetrix A-E arrays (Hellmann, Pääbo)
")
52
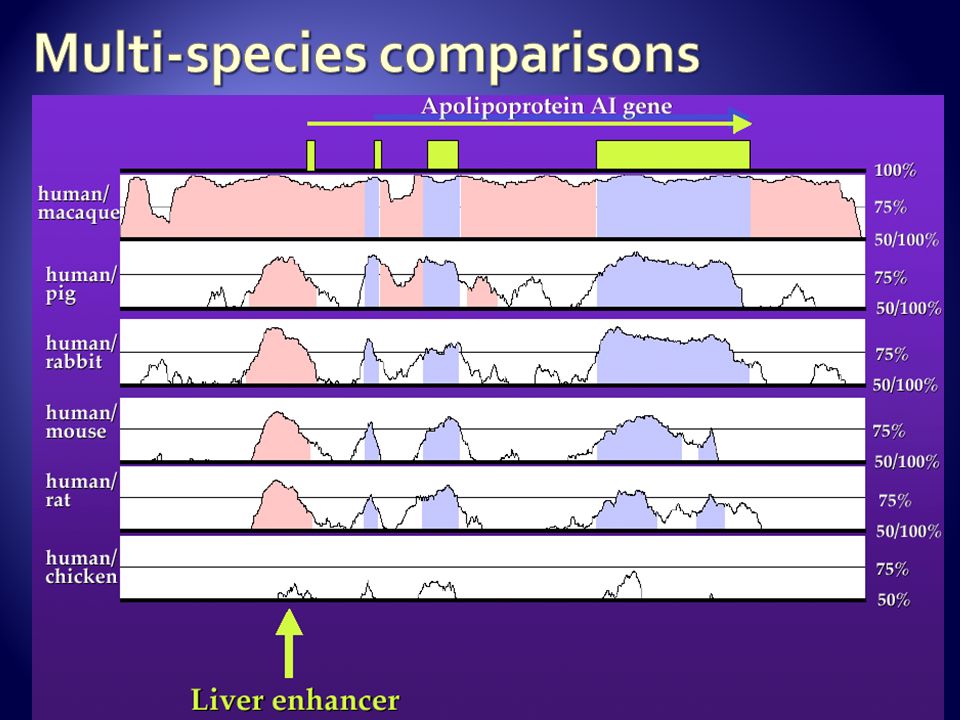
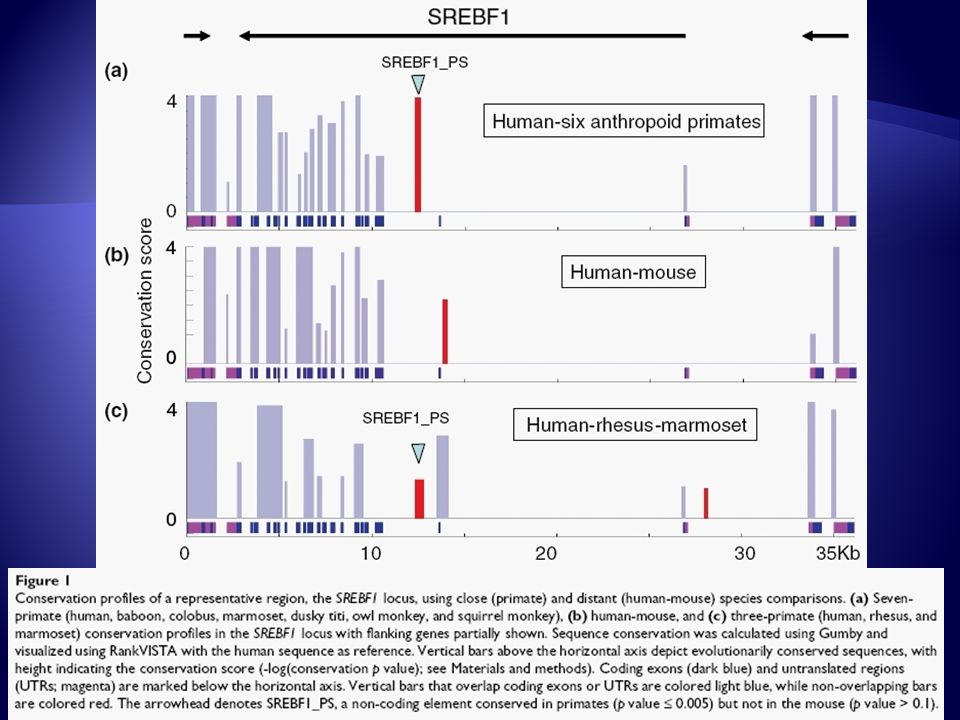
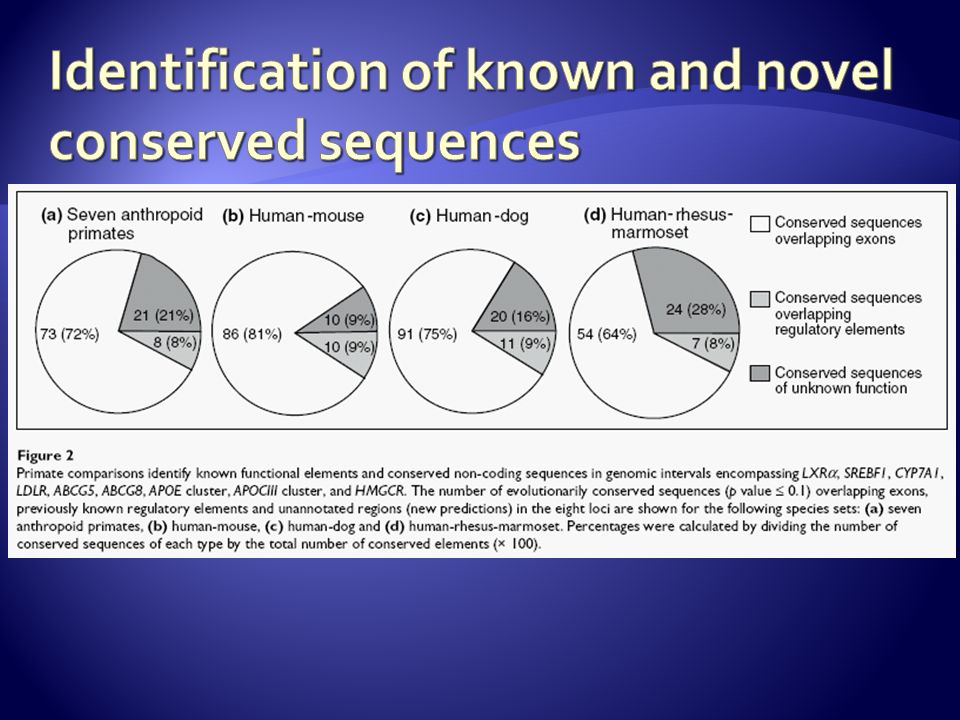
Identifying cis-regulatory elements in the human genome is a major challenge of the post-genomic era Promoters and enhancers that regulate gene expression in normal and diseased cells and tissues Inter-species sequence comparisons have emerged as a major technique for identifying human regulatory elements Particularly those to the sequenced mouse, chicken and fish genomes A significant fraction of empirically defined human regulatory modules Too weakly conserved in other mammalian genomes, such as the mouse, to distinguish them from nonfunctional DNA Completely undetectable in nonmammalian genomes Identification of such significantly divergent functional sequences will require complementary methods in order to complete the functional annotation of the human genome Deep intra-primate sequence comparison is a novel alternative to the commonly used distant species comparisons

56
Non-coding sequences with primate-specific conservation include three regulatory elements

57
Nature (2003) 424:788-793
 424:")
61
Transcript A-B combines at least one exon (complete or partial overlap) from both Gene A & Gene B – Usually only supported by a few mRNA/EST sequences, and rarely by a CCDS Currently, about 32 known cases found by searching NCBI Entrez (including 8 from chr 11 recently submitted by our group) Transcript A-B combines at least one exon (complete or partial overlap) from both Gene A & Gene B – Usually only supported by a few mRNA/EST sequences, and rarely by a CCDS Currently, about 32 known cases found by searching NCBI Entrez (including 8 from chr 11 recently submitted by our group) Child gene A Child gene B Conjoined Gene A – B Fused transcript formed by combining the exons of two or more distinct genes (child genes) Exon Intron
 from both Gene A & Gene B – Usually only supported by a few mRNA/EST sequences, and rarely by a CCDS Currently, about 32 known cases found by searching NCBI Entrez (including 8 from chr 11 recently submitted by our group) Transcript A-B combines at least one exon (complete or partial overlap) from both Gene A & Gene B – Usually only supported by a few mRNA/EST sequences, and rarely by a CCDS Currently, about 32 known cases found by searching NCBI Entrez (including 8 from chr 11 recently submitted by our group) Child gene A Child gene B Conjoined Gene A – B Fused transcript formed by combining the exons of two or more distinct genes (child genes) Exon Intron")
62
Chr1 SRP9 – EPHX1 fusion (1 EST evidence-DA417873) Alternate splicing and novel exons observed in fused mRNA
 Alternate splicing and novel exons observed in fused mRNA")
63
Number of mRNAs examined 456 (326 conjoined genes) At least one exon* from both child genes conserved in Number Chimpanzee mRNAs 125 (69 conjoined genes) Mouse mRNAs 30 (15 conjoined genes) Both Chimpanzee and Mouse mRNAs 25 (11 conjoined genes) 27% Conjoined genes conserved in Chimpanzee 6.5% Conjoined genes conserved in Mouse * Exons considered were part of conjoined gene mRNAs
 At least one exon* from both child genes conserved in Number Chimpanzee mRNAs 125 (69 conjoined genes) Mouse mRNAs 30 (15 conjoined genes) Both Chimpanzee and Mouse mRNAs 25 (11 conjoined genes) 27% Conjoined genes conserved in Chimpanzee 6.5% Conjoined genes conserved in Mouse * Exons considered were part of conjoined gene mRNAs")
64
RIKEN Yoshiyuki Sakaki Tulika P. Srivastava Vineet K. Sharma Asao Fujiyama Masahira Hattori Atsushi Toyoda Yoko Kuroki Yasushi Totoki Hideki Noguchi Hidemi Watanabe Takehiko Itoh (MRI) Chimpanzee Chr 22 Sequencing Consortium Chinese National Human Genome Center at Shanghai, China KRIBB Genome Research Center, Daejeon, Korea National Yang Ming University Genome Research Center, Taipei, Taiwan National Institute of Genetics, Mishima, Japan RIKEN Genomic Sciences Center, Yokohama, Japan GBF, Dept. of Genome Analysis, Braunschweig, Germany Institute for Molecular Biotechnology, Jena, Germany Max-Planck Institute for Molecular Genetics, Berlin, Germany
 Chimpanzee Chr 22 Sequencing Consortium Chinese National Human Genome Center at Shanghai, China KRIBB Genome Research Center, Daejeon, Korea National Yang Ming University Genome Research Center, Taipei, Taiwan National Institute of Genetics, Mishima, Japan RIKEN Genomic Sciences Center, Yokohama, Japan GBF, Dept. of Genome Analysis, Braunschweig, Germany Institute for Molecular Biotechnology, Jena, Germany Max-Planck Institute for Molecular Genetics, Berlin, Germany.")
Similar presentations


 A rapid and reliable display of any requested portion of genomes.>")


>")
, 5 Dec 2002 Genome Research 13(3), March 2003.>")

