Download presentation
Presentation is loading. Please wait.

1
13 November 2015, Rome Food and Agriculture Organization of the United Nations (FAO)
")
3
New work on methodologically robust Agricultural Capital Stock statistics funded by One of Five FAO Strategic Objectives (SO) for the 2014-2015 biennium : To Enable inclusive and efficient agricultural and food systemsTo Enable inclusive and efficient agricultural and food systems (SO4) Output/Activity required from Statistics Division: To develop and implement methodologies for the measurement of capital stock and mechanization To develop, collect/compile, validate, and disseminate data on annual capital stock estimates Work and approach supported by FAO Legislated Bodies (Committee on Agriculture, African Commission on Agricultural Statistics, Asia-Pacific Commission on Agricultural Statistics, Latin America-Caribbean-FAO Working Group on Agricultural Statistics)
 for the biennium : To Enable inclusive and efficient agricultural and food systemsTo Enable inclusive and efficient agricultural and food systems (SO4) Output/Activity required from Statistics Division: To develop and implement methodologies for the measurement of capital stock and mechanization To develop, collect/compile, validate, and disseminate data on annual capital stock estimates Work and approach supported by FAO Legislated Bodies (Committee on Agriculture, African Commission on Agricultural Statistics, Asia-Pacific Commission on Agricultural Statistics, Latin America-Caribbean-FAO Working Group on Agricultural Statistics)")
4
a) Capital Stock related variables Total economy Agriculture, Forestry & Fishery (AFF) Agriculture (Ag) Gross fixed capital formation ✔ ✔ ✔ Net capital stock ✘✔✔ Gross capital stock ✘✔✔ Consumption of fixed capital ✘✔✔ b) Macro-economic variables not in a) Value added¹ ✔³✔³ ✔✔ Gross Output² ✘✔✔ Operating surplus, gross ✘✔✔ Operating surplus, net ✘ ✔ ✔ Compensation of employees² ✘✔✔ Employment² ✘✔✔ c) Other labour variables (for OECD countries only) Wages and salaries, N. of employees, Self-employed, Full-time equivalents - total engaged & employees, Hours worked - total engaged & employees ✘✔✔ ¹ necessary for calculating the investment ratio and capital stock ² supporting variables in the calculation capital stock ³ it refers to the Gross Domestic Product (GDP)
.")
6
Farm structures, including major improvements to other buildings and structures Transport equipment Machinery and equipment Communications equipment, office machinery and computers Produced intangible fixed assets, e.g. software, R&D Major improvements to tangible non-produced assets, e.g. land Livestock Trees

8
1.Current FAOSTAT database, with data up to 2007, based on aggregation of separate calculations of asset categories; 2.A new national-accounts based Capital Stock database.

10
countriesitem2000200320052007 DenmarkLand Development98.0 DenmarkLivestock (Fixed Assets)100.0 DenmarkLivestock (inventory)100.0 DenmarkMachinery & Equipment87.5 DenmarkPlantation Crops95.5 DenmarkStructures for Livestock95.5 DenmarkCapital Stock + (Total)94.8 94.9 EcuadorLand Development98.0 EcuadorLivestock (Fixed Assets)100.0 EcuadorLivestock (inventory)100.0 EcuadorMachinery & Equipment87.5 EcuadorPlantation Crops95.5 EcuadorStructures for Livestock95.5 EcuadorCapital Stock + (Total)97.897.9
100.0 DenmarkLivestock (inventory)100.0 DenmarkMachinery & Equipment87.5 DenmarkPlantation Crops95.5 DenmarkStructures for Livestock95.5 DenmarkCapital Stock + (Total) EcuadorLand Development98.0 EcuadorLivestock (Fixed Assets)100.0 EcuadorLivestock (inventory)100.0 EcuadorMachinery & Equipment87.5 EcuadorPlantation Crops95.5 EcuadorStructures for Livestock95.5 EcuadorCapital Stock + (Total)")
11
countriesitem2000200320052007 FranceLand Development98.0 FranceLivestock (Fixed Assets)100.0 FranceLivestock (inventory)100.0 FranceMachinery & Equipment87.5 FrancePlantation Crops95.5 FranceStructures for Livestock95.5 FranceCapital Stock + (Total)93.693.593.793.6 NigerLand Development98.0 NigerLivestock (Fixed Assets)100.0 NigerLivestock (inventory)100.0 NigerMachinery & Equipment87.5 NigerPlantation Crops95.5 NigerStructures for Livestock95.5 NigerCapital Stock + (Total)98.9 99.0
100.0 FranceLivestock (inventory)100.0 FranceMachinery & Equipment87.5 FrancePlantation Crops95.5 FranceStructures for Livestock95.5 FranceCapital Stock + (Total) NigerLand Development98.0 NigerLivestock (Fixed Assets)100.0 NigerLivestock (inventory)100.0 NigerMachinery & Equipment87.5 NigerPlantation Crops95.5 NigerStructures for Livestock95.5 NigerCapital Stock + (Total)")
12
Source: FAOSTAT Sources: OECD and FAO SST Gross capital stock, millions 2005 USD GCS Gross outputValue added Countries item 2005 DK/ EC Denmark Land Development2,9930.4 Denmark Livestock (Fixed Assets)3,6930.6 Denmark Livestock (inventory)6520.6 Denmark Machinery & Equipment 4,2969.4 Denmark Plantation Crops 240.006 Denmark Structures for Livestock8771.8 Denmark Capital Stock + (Total) 12,535 0.6 63,065 1.80.9 Ecuador Land Development7,030 Ecuador Livestock (Fixed Assets)6,108 Ecuador Livestock (inventory)1,078 Ecuador Machinery & Equipment 456 Ecuador Plantation Crops 4,199 Ecuador Structures for Livestock486 Ecuador Capital Stock + (Total) 19,358 4,820 GCS for Ecuador is calculated from reported values of GFCF
3, Denmark Livestock (inventory) Denmark Machinery & Equipment 4, Denmark Plantation Crops Denmark Structures for Livestock Denmark Capital Stock + (Total) 12, , Ecuador Land Development7,030 Ecuador Livestock (Fixed Assets)6,108 Ecuador Livestock (inventory)1,078 Ecuador Machinery & Equipment 456 Ecuador Plantation Crops 4,199 Ecuador Structures for Livestock486 Ecuador Capital Stock + (Total) 19,358 4,820 GCS for Ecuador is calculated from reported values of GFCF")
13
Source: FAOSTAT Sources: OECD and FAO SST Gross capital stock, millions 2005 USD GCS Gross outputValue added Countries item 2005 FR/ EC France Land Development19,0502.7 France Livestock (Fixed Assets)18,7833.1 France Livestock (inventory)3,3153.1 France Machinery & Equipment 40,59089.1 France Plantation Crops 3,6950.9 France Structures for Livestock10,72422.1 France Capital Stock + (Total) 96,156 5.0 227,347 17.313.0 Ecuador Land Development7,030 Ecuador Livestock (Fixed Assets)6,108 Ecuador Livestock (inventory)1,078 Ecuador Machinery & Equipment 456 Ecuador Plantation Crops 4,199 Ecuador Structures for Livestock486 Ecuador Capital Stock + (Total) 19,358 4,820
18, France Livestock (inventory)3, France Machinery & Equipment 40, France Plantation Crops 3, France Structures for Livestock10, France Capital Stock + (Total) 96, , Ecuador Land Development7,030 Ecuador Livestock (Fixed Assets)6,108 Ecuador Livestock (inventory)1,078 Ecuador Machinery & Equipment 456 Ecuador Plantation Crops 4,199 Ecuador Structures for Livestock486 Ecuador Capital Stock + (Total) 19,358 4,820")
14
Gross Capital Stock 2005, millions 2005 USDNet Capital Stock, millions 2005 USD FAOSTATOECD (ISIC Rev.3:01) FAOSTAT /OECDFAOSTATOECD (ISIC Rev.3:01) FAOSTAT/OECD Australia119,275 74,345 1.6115,979 61,417 1.9 Austria15,412 59,601 0.314,017 46,344 0.3 Belgium6,912 17,349 0.46,623 8,056 0.8 Canada100,954 68,212 1.594,596 39,678 2.4 Czech Republic11,852 14,859 0.811,133 7,167 1.6 Denmark12,535 63,065 0.211,897 33,992 0.4 Estonia2,171 796 2.71,987 596 3.3 Finland12,265 30,403 0.411,101 15,219 0.7 France96,156 227,347 0.490,052 120,560 0.7 Germany84,125 290,611 0.376,597 146,516 0.5 Hungary11,370 31,888 0.410,766 18,203 0.6 Iceland985 991 1.0898 754 1.2 Ireland20,470 19,766 1.019,573 11,104 1.8 Israel2,421 5,020 0.52,316 3,208 0.7 Italy85,127 426,349 0.278,328 217,319 0.4 FAOSTAT ≤ 50% of reported GCS FAOSTAT ≥ 150% of reported GCS
 FAOSTAT /OECDFAOSTATOECD (ISIC Rev.3:01) FAOSTAT/OECD Australia119,275 74, ,979 61, Austria15,412 59, ,017 46, Belgium6,912 17, ,623 8, Canada100,954 68, ,596 39, Czech Republic11,852 14, ,133 7, Denmark12,535 63, ,897 33, Estonia2, , Finland12,265 30, ,101 15, France96, , , , Germany84, , , , Hungary11,370 31, ,766 18, Iceland Ireland20,470 19, ,573 11, Israel2,421 5, ,316 3, Italy85, , , , FAOSTAT ≤ 50% of reported GCS FAOSTAT ≥ 150% of reported GCS")
15
Gross Capital Stock 2005, millions 2005 USDNet Capital Stock, millions 2005 USD FAOSTATOECD (ISIC Rev.3:01) FAOSTAT /OECDFAOSTATOECD (ISIC Rev.3:01) FAOSTAT/OECD Japan293,689 477,191 0.6266,445 309,337 0.9 Luxembourg496 2,071 0.2445 1,027 0.4 Netherlands12,057 84,645 0.111,591 48,290 0.2 Norway9,157 18,079 0.58,345 14,612 0.6 Poland74,080 83,994 0.967,304 23,597 2.9 Portugal14,785 14,691 1.013,976 6,976 2.0 Republic of Korea16,332 92,978 0.215,318 61,129 0.3 Slovakia6,513 8,285 0.86,249 3,127 2.0 Slovenia2,861 3,729 0.82,588 1,450 1.8 Spain83,135 117,695 0.778,239 86,362 0.9 Sweden14,662 30,878 0.513,656 18,808 0.7 Switzerland8,535 33,961 0.37,945 17,208 0.5 United Kingdom49,011 77,269 0.645,891 37,062 1.2 United States of America 617,633727,1660.8577,252397,8551.5 FAOSTAT ≤ 50% of reported GCS FAOSTAT ≥ 150% of reported GCS
 FAOSTAT /OECDFAOSTATOECD (ISIC Rev.3:01) FAOSTAT/OECD Japan293, , , , Luxembourg496 2, , Netherlands12,057 84, ,591 48, Norway9,157 18, ,345 14, Poland74,080 83, ,304 23, Portugal14,785 14, ,976 6, Republic of Korea16,332 92, ,318 61, Slovakia6,513 8, ,249 3, Slovenia2,861 3, ,588 1, Spain83, , ,239 86, Sweden14,662 30, ,656 18, Switzerland8,535 33, ,945 17, United Kingdom49,011 77, ,891 37, United States of America 617,633727, ,252397, FAOSTAT ≤ 50% of reported GCS FAOSTAT ≥ 150% of reported GCS")
16
LAND DEVELOPMENT “Land development = ∑ {(arable land) x (unit price) + (irrigated land) x (unit price)} Plantation crops = ∑ (land under permanent crop) x (unit price)” AGRICULTURE MACHINERY “Machinery and equipment = ∑ {(number of machinery for i) x (unit price of machinery for i) + (economically active population in agriculture) x US $35)} Where i stands for tractor, harvester & threshers and milking machine. US $ 35 has been taken from 1995 series after adjusting for price rises.”

18
Global database on Agricultural Capital Stock and related structural statistics, Covering 223 countries and territories for 1970-2013, with supporting metadata/documentation Industrial Coverage: Total Economy; Agriculture, Forestry & Fishing (AFF), ISIC Rev.3:A+B; Agriculture (Ag) subsector, ISIC Rev.3:01 Variables Capital Stock related variables: GFCF, Net Capital Stock (NCS), Gross Capital Stock (GCS), Consumption of Fixed Capital (CFC) Other SNA variables: Value-Added¹, Gross Output², Gross Operating Surplus, Net Operating Surplus, Compensation of Employees², Employment² Other Employment Variables (for OECD countries only): Wages and salaries, Number of employees, Number of self-employed, Full-time equivalents - total engaged, Full-time equivalents – employees, Hours worked - total engaged, Hours worked – employees Other indicators: Investment Ratio (IR), and Agriculture Orientation Index (AOI) ¹ necessary for calculating the investment ratio and capital stock ² supporting variables in the calculation capital stock
, ISIC Rev.3:A+B; Agriculture (Ag) subsector, ISIC Rev.3:01 Variables Capital Stock related variables: GFCF, Net Capital Stock (NCS), Gross Capital Stock (GCS), Consumption of Fixed Capital (CFC) Other SNA variables: Value-Added¹, Gross Output², Gross Operating Surplus, Net Operating Surplus, Compensation of Employees², Employment² Other Employment Variables (for OECD countries only): Wages and salaries, Number of employees, Number of self-employed, Full-time equivalents - total engaged, Full-time equivalents – employees, Hours worked - total engaged, Hours worked – employees Other indicators: Investment Ratio (IR), and Agriculture Orientation Index (AOI) ¹ necessary for calculating the investment ratio and capital stock ² supporting variables in the calculation capital stock")
19
Agriculture, forestry and fishery GFCF in 2013 estimated at $363 billion globally (2005 USD), up 5% from 2012 and 50% from 2000. Asia showed highest level of agricultural investment in 2013, with GFCF of $131 billion (2005 USD) in 2013, surpassing Europe which led until 2008. Note: Analysis begins in 2000 due to missing or unreliable data for many countries prior to 2000
 in 2013, surpassing Europe which led until Note: Analysis begins in 2000 due to missing or unreliable data for many countries prior to")
20
In developed countries, the GFCF Agriculture Orientation Index (AOI) usually exceeds 1, indicating a higher level of investment in AFF relative to its share of the economy. Developing countries have a GFCF Agriculture Orientation Index (AOI) less than 1, indicating a lower share of agricultural investment relative to its economic share.
 less than 1, indicating a lower share of agricultural investment relative to its economic share..")
22
1.Data Source: selection varies by country and variable UNSD: National Accounts Estimates (UNSD : NAE), Official Country Data (UNSD : OCD) OECD: Structural Analysis database (OECD-STAN), National Accounts Database (OECD-NA) World Input Output Database (WIOD) 2.Data Bridging Bridging across data series within a single data sources Bridging across ISIC revisions 3. and 4. Bridging across data sources Note: Bridging was essential to create a long time series for capital stock related variables 3.FAO Estimation/imputation Imputation/estimation missing observations in an existing series Estimations of capital stock related variables, and variables required for these estimations (Value-Added, Gross Output) Note: No estimation or imputation was conducted for other variables
 Note: No estimation or imputation was conducted for other variables.")
23
INDUSTRIES COVEREDISIC Rev 3 AGRICULTURE, FORESTRY, FISHERYA+B AGRICULTURE HUNTING AND RELATED SERVICIESA01 No. of countries with data Total economyA+BA01 I. NATIONAL ACCOUNTS ESTIMATES (UNSD) GDP (current and fixed prices, LCU and $) >200 GFCF (current and fixed prices, LCU and $) >200 GFCF deflator >200 GDP/capita (current prices, LCU and $) >200 Value added ISIC Rev3: A+B (current and fixed prices, LCU and $) >200 Value added deflator >200 II. OFFICIAL COUNTRY DATA (UNSD) OUTPUT 14898 Less Intermediate consumption VALUE ADDED, GROSS 157105 COMPENSATION OF EMPLOYEES 12681 OPERATING SURPLUS, GROSS 13478 MIXED INCOME, GROSS 2518 Less CONSUMPTION OF FIXED CAPITAL 9856 OPERATING SURPLUS, NET 10455 MIXED INCOME, NET 1511 GROSS FIXED CAPITAL FORMATION 8754 CLOSING STOCK OF FIXED ASSETS 2322 EMPLOYMENT 7050 Data for additional countries from STAN, OECD-NA and WIOD
 GDP (current and fixed prices, LCU and $) >200 GFCF (current and fixed prices, LCU and $) >200 GFCF deflator >200 GDP/capita (current prices, LCU and $) >200 Value added ISIC Rev3: A+B (current and fixed prices, LCU and $) >200 Value added deflator >200 II. OFFICIAL COUNTRY DATA (UNSD) OUTPUT Less Intermediate consumption VALUE ADDED, GROSS COMPENSATION OF EMPLOYEES OPERATING SURPLUS, GROSS MIXED INCOME, GROSS 2518 Less CONSUMPTION OF FIXED CAPITAL 9856 OPERATING SURPLUS, NET MIXED INCOME, NET 1511 GROSS FIXED CAPITAL FORMATION 8754 CLOSING STOCK OF FIXED ASSETS 2322 EMPLOYMENT 7050 Data for additional countries from STAN, OECD-NA and WIOD.")
24
For OECD countries, by order of preference: 1.OECD: Structural Analysis database (OECD-STAN) 2.OECD - National Accounts Database (OECD-NA) 3.UNSD : Official Country Data 4.World Input Output Database (WIOD) For all other countries, by order of preference: 1.UNSD : Official Country Data 2.non-OECD countries covered in OECD-STAN and OECD-NA 3.World Input Output Database (WIOD)
 2.OECD - National Accounts Database (OECD-NA) 3.UNSD : Official Country Data 4.World Input Output Database (WIOD) For all other countries, by order of preference: 1.UNSD : Official Country Data 2.non-OECD countries covered in OECD-STAN and OECD-NA 3.World Input Output Database (WIOD)")
25
1. WHAT IS THE BRIDGING ? It is a process that connects two or more : fully specified data stores for a limited time or on an ongoing basis N.B.: Before the bridging is undertaken, we “rebase” the constant values using the 2005 as a base year. Moreover, only values in LCU are bridged. 2. WHY WE USE THE BRIDGING ? In order to have long data series, as data in different series / ISIC Revisions / Sources are not comparable.

26
3. WHEN WE USE THE BRIDGING ? i.Series-bridging This involves UNSD - Official Country Data, as data are reported in different series. Different series numbers are used to store different time-series versions of national accounts statistics, e.g. different SNA national accounts methodology, different currencies, fiscal years, or by different sources. NB: Priority is given to the most recent series ii.ISIC Revisions-bridging The present dataset reports data in ISIC Rev.3, as most of the countries still report information in ISIC Rev.3. The bridging of various revisions of ISIC involves the UNSD - Official Country Data & the OECD – STAN database. If no data for a certain year is available in ISIC Rev.3, but it is available in ISIC Rev.4, then the latter will be bridged into ISIC Rev.3.

27
iii.The sources-bridging In order to expand the time series, different sources are bridged. How do we use the sources ? 1. OECD (STAN and National Accounts) : it is used as the primary source for OECD countries (the dbs include also some non-OECD countries, e.g. China, Brazil) NB: data from OECD-NA are in ISIC Rev.4 only - converted into ISIC Rev.3. 2. UNSD (Official Country Data) : it is usually used for non-OECD countries. 3. WIOD : it is used when no other source is available.
 : it is used as the primary source for OECD countries (the dbs include also some non-OECD countries, e.g. China, Brazil) NB: data from OECD-NA are in ISIC Rev.4 only - converted into ISIC Rev UNSD (Official Country Data) : it is usually used for non-OECD countries. 3. WIOD : it is used when no other source is available..")
28
4. HOW THE BRIDGING IS UNDERTAKEN ? The bridging is possible only when there is overlap between at least two data for the same year. Once the two series to be bridged have been identified, we calculate their conversion factor (as a ratio of the two series): We have used the last available year or the last 3-years average, depending on the trend of the series: if the trend is more or less stable, then we assume that the last available year is sufficient, otherwise if the values varies significantly over the years, then an average has been taken. The bridging is not recommended when the two series differ significantly, e.g. when the conversion factor is greater than 1.5 or is smaller than 0.5.
: We have used the last available year or the last 3-years average, depending on the trend of the series: if the trend is more or less stable, then we assume that the last available year is sufficient, otherwise if the values varies significantly over the years, then an average has been taken. The bridging is not recommended when the two series differ significantly, e.g. when the conversion factor is greater than 1.5 or is smaller than")
29
Series-bridging Gross Fixed Capital Formation, ISIC Rev.3:A+B No overlap Different currency Bridging not possible The bridging is possible

30
a.If reported data are available only for a limited number of years : the missing years' data are imputed based on data on the most recent, or an average of the most recent, available investment ratio (GFCF/VA). b.If there are no data at all : imputation for GFCF in Ag are based on (1) value-added ratio for Ag over AFF to GFCF in AFF; imputation for GFCF in Ag & GFCF in AFF are based on (2) regression equations (linear and logarithmic) in which the endogenous variable is the investment ratio and the exogenous variable GDP/capita. It would have been preferable to use VA/EMPL as explanatory variable but many employment series are missing or are of dubious quality. The parameters of the equation are estimated based on the data from the countries from which data are available. The R 2 value of the regressions vary between 0.9 (logarithmic regression for middle and high income countries) and 0.74 (linear regression for low income countries). When reported country data on CFC are available these are used for estimating GFCF, when the latter are missing, as the averages of CFC and GFCF over a medium term period are normally of the same magnitude.
 value-added ratio for Ag over AFF to GFCF in AFF; imputation for GFCF in Ag & GFCF in AFF are based on (2) regression equations (linear and logarithmic) in which the endogenous variable is the investment ratio and the exogenous variable GDP/capita. It would have been preferable to use VA/EMPL as explanatory variable but many employment series are missing or are of dubious quality. The parameters of the equation are estimated based on the data from the countries from which data are available. The R 2 value of the regressions vary between 0.9 (logarithmic regression for middle and high income countries) and 0.74 (linear regression for low income countries). When reported country data on CFC are available these are used for estimating GFCF, when the latter are missing, as the averages of CFC and GFCF over a medium term period are normally of the same magnitude..")
31
Data on Net Capital Stock (NCS), Gross Capital Stock (GCS) and Consumption of Fixed Capital (CFC) is available only for a limited number of countries (mainly OECD countries). For all other countries data have been calculated by FAO using the Double Declining Balance Method. In applying this method, assumption were made of depreciation rates which range from 0.03 to 0.08 depending on the economic level of the countries. There is large degree of arbitrary judgements in applying these deprecation rates. Hence, data should be interpreted with great care as they only might give an order of magnitude and not information about the exact level.

32
b) Macro-economic variables not in a) Agriculture, Forestry & Fishery (AFF)Agriculture (Ag) Value added Missing data are replaced by bridged data of Value Added, UNSD-NAE. If there are no Official Country Data at all then the UNSD-NAE have been used. Missing data are replaced by bridged data of Value Added, UNSD-NAE from those years when data are available. If there are no Official Country Data at all, then the whole data series are imputed, using UNSD-NAE for Agriculture, forestry, fishery (ISIC Rev.3:A+B) as the basis and then multiply by the value-added ratio of Agriculture (ISIC Rev.3:01) over Agriculture, forestry, fishery (ISIC Rev.3:A+B) for neighbouring countries with the same level of economic development and structure. Output Missing data in country series of Gross Output, Official Country Data, are imputed using the ratio of Gross Output/Value Added of adjacent years. In case the data series are empty then Gross Output is estimated using the ratio of Gross Output/Value Added for neighbouring countries with the same level of economic development. Missing data points in country series of Gross Output, Official Country Data, are imputed using the ratio of Gross Output/Value Added of adjacent years. In case the data series are empty then Gross Output is estimated using the ratio of Gross Output/Value Added for neighbouring countries, with the same level of economic development and structure, applied to available data on Value added, National Accounts Estimates for Agriculture, forestry, fishery (ISIC Rev.3: A+B)
 as the basis and then multiply by the value-added ratio of Agriculture (ISIC Rev.3:01) over Agriculture, forestry, fishery (ISIC Rev.3:A+B) for neighbouring countries with the same level of economic development and structure. Output Missing data in country series of Gross Output, Official Country Data, are imputed using the ratio of Gross Output/Value Added of adjacent years. In case the data series are empty then Gross Output is estimated using the ratio of Gross Output/Value Added for neighbouring countries with the same level of economic development. Missing data points in country series of Gross Output, Official Country Data, are imputed using the ratio of Gross Output/Value Added of adjacent years. In case the data series are empty then Gross Output is estimated using the ratio of Gross Output/Value Added for neighbouring countries, with the same level of economic development and structure, applied to available data on Value added, National Accounts Estimates for Agriculture, forestry, fishery (ISIC Rev.3: A+B).")
33
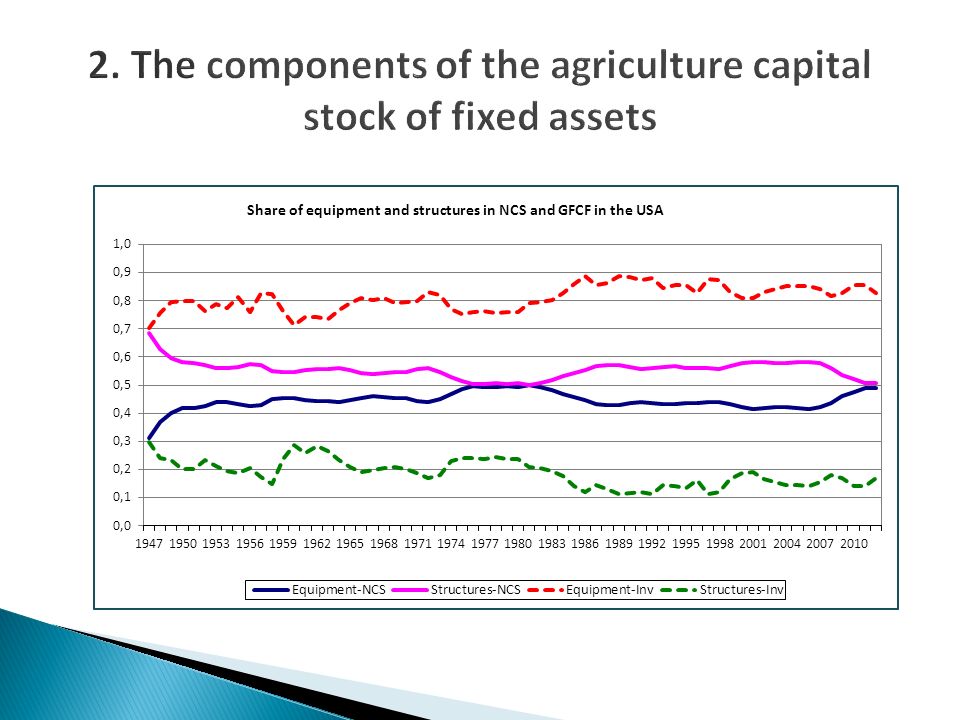
The fact that a large amount of data on GFCF is imputed or estimated is not the only weakness of the database. Another weakness is that we have no information on how large share of GFCF is machinery and how large share is structures. The present database on Gross Fixed Capital Formation is a test database. The methodology and input data will continuously be improved - in particular when FAO data on machinery investment become available.

35
Double-declining balance method (proposed by the OECD Capital Stock Manual, the SNA 2008 and BEA) Where W tE and W tB are the end-year and beginning-of-the year net capital stocks, I t is gross fixed capital formation, δ (I t /2+W t B) is consumption of fixed capital, δ is the depreciation rate δ=R/T A where T A is the average service life of an asset, and R is a parameter around 2. W tE = W tB + I t – δ (I t /2+W tB ) = I t (1 - δ/2) + W tB (1 – δ)
 = I t (1 - δ/2) + W tB (1 – δ).")
36
A starting stock for some period t₀ has to be computed Using capital survey information or Estimate for the long-run growth rate of volume investment when geometric age-efficiency or age-price profiles apply net stock at the beginning of the benchmark year t₀ can approximated by W t0 = I t0 / (δ+ θ) Θ = the long-run growth rate of volume GDP, or in our case, value added in agriculture
 Θ = the long-run growth rate of volume GDP, or in our case, value added in agriculture")
38
Depreciation rates for different groups of countries Assumed growth rates for the initial capital stock Deflators Imputations when there are missing data and when there are no data at all Stability of bridging data series (Rev 4 to Rev 3 and between different sources) How to get reliable data on GFCF in agriculture machinery (the instability of COMTRADE and PRODCOM data)
 How to get reliable data on GFCF in agriculture machinery (the instability of COMTRADE and PRODCOM data)")
Similar presentations


 “European R&D Benchmarking (2002)” Science, Technology and Innovation Policy Student Presentations Students: Miguel.>")


 The Global Role of Wages: Productivity, Employment and Equity.>")
 OECD Working Party on Financial Statistics 29 November ->")


