Download presentation
Presentation is loading. Please wait.

1
USDA National Agricultural Statistics Service Gary Keough, State Statistician, New England Field Office Maple Syrup 2015 Production and 2014 Prices

2
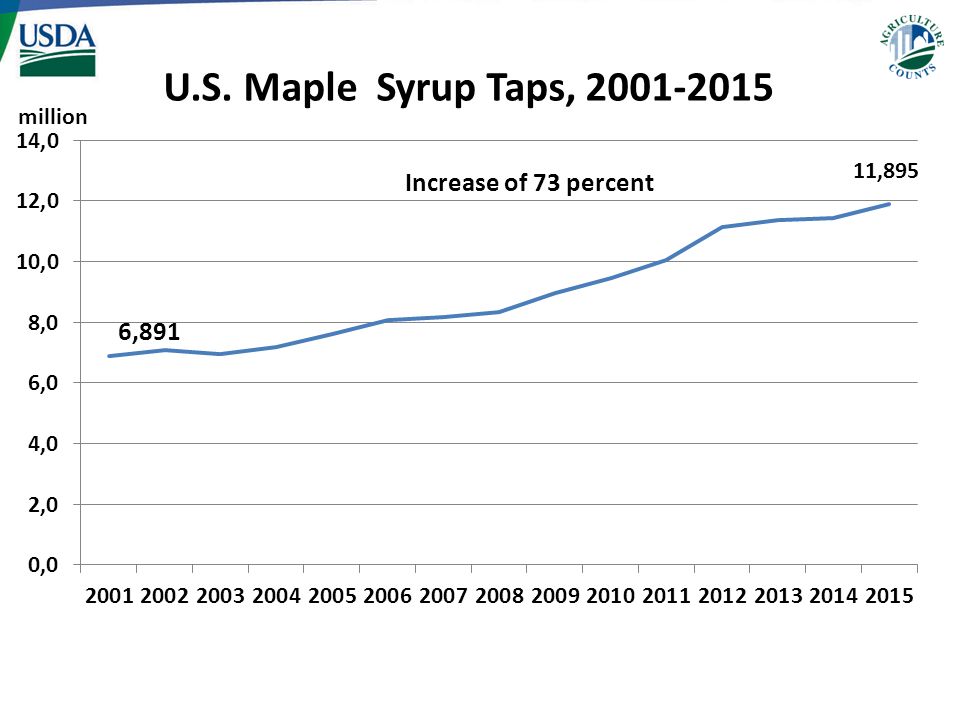
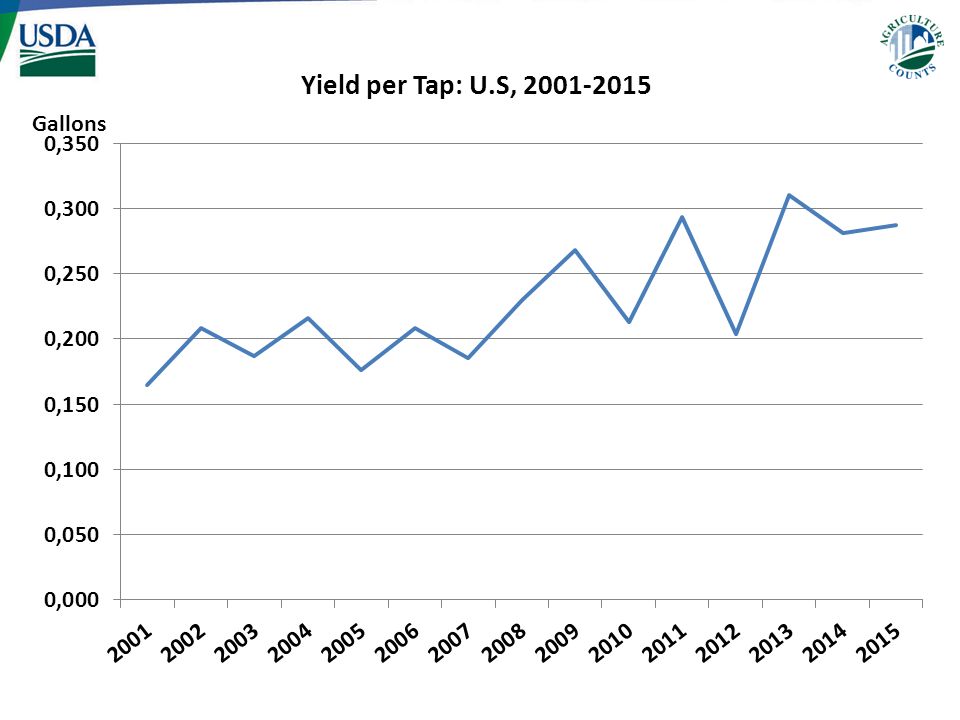
U.S. – 3.414 million gallons, 37.554 million pounds, up 6% from 2014’s revised production of 3.211 million gallons – 11.895 million taps, up 4% from 2014 revised 11.431 million taps – 0.287 gallons, 3.157 pounds per tap, up 2% 2015 Maple Syrup Production Highlights

3
All States except Ohio showed increased production Season lasted 26 days compared to 29 days last year Number of taps increase in all States except Ohio which declined 10,000 taps and Maine which had no change 2015 Maple Syrup Production Highlights

4
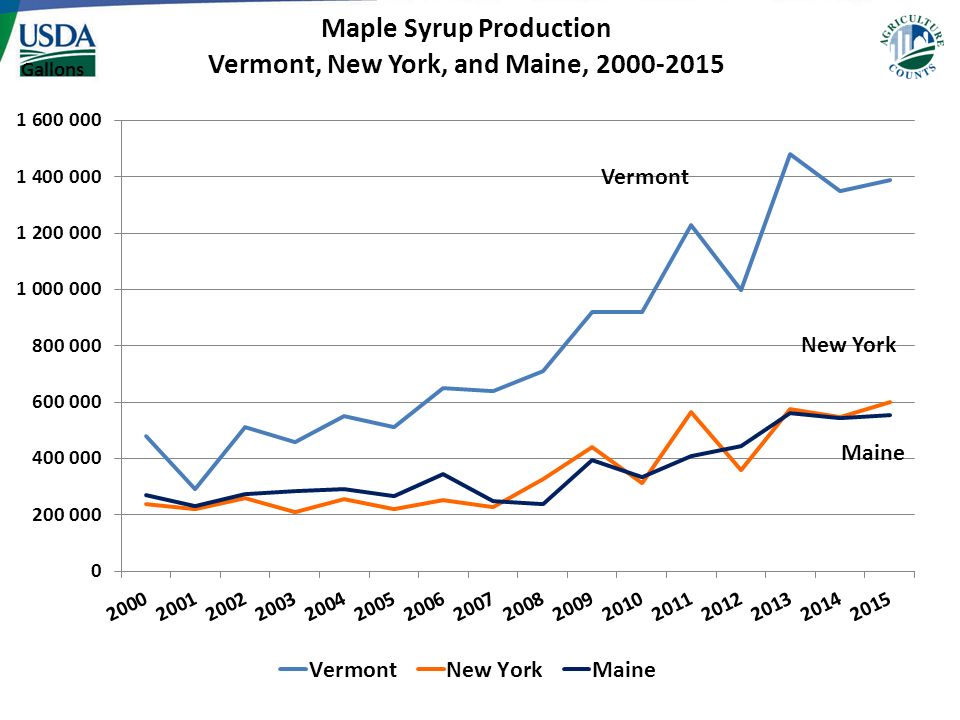
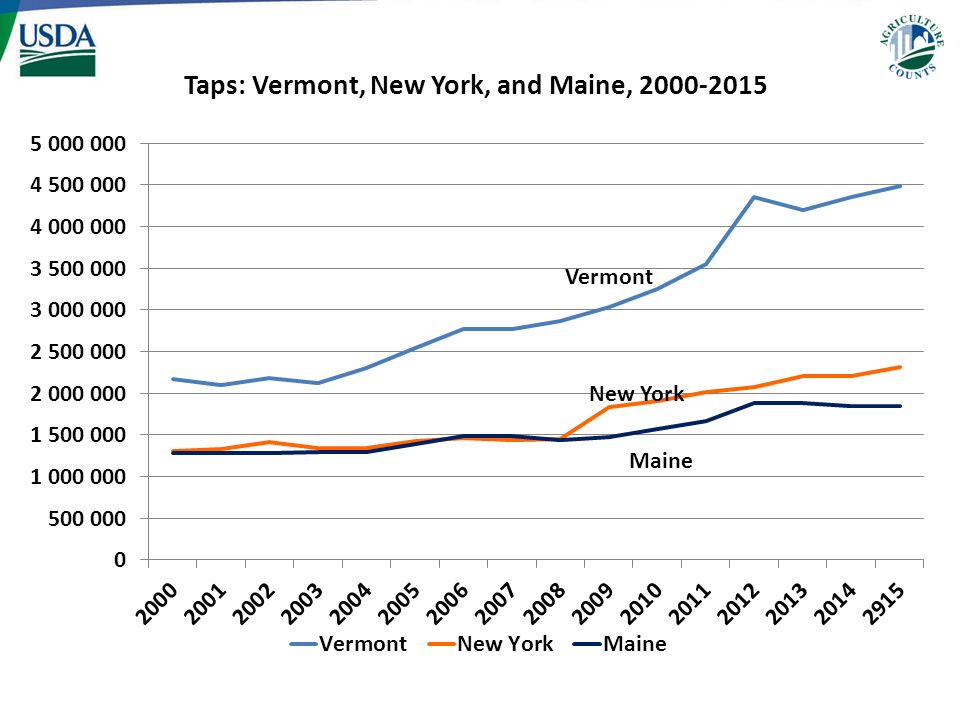
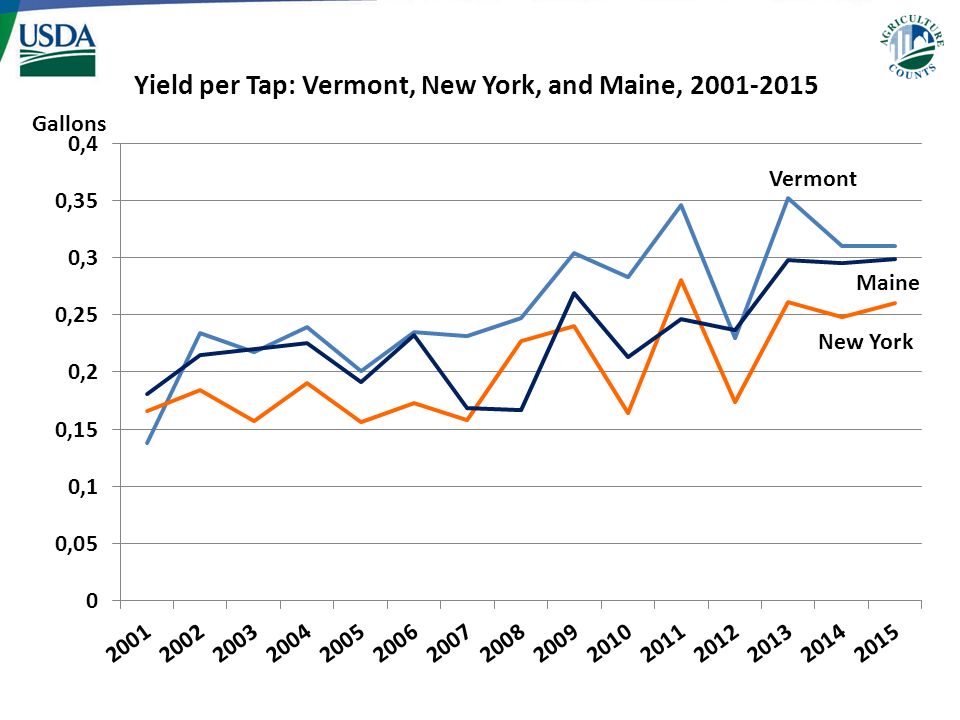
Vermont – 1,390,000 gallons, 15.29 million pounds, up 3% – 4,490,000 taps, up 3% – 0.310 gallons, 3.41 pounds per tap, unchanged New York – 601,000 gallons, 6.10 million pounds, up 10% – 2,310,000 taps, up 5% – 0.260 gallons, 2.86 pounds per tap, up 5% Maine – 553,000 gallons, 6.611 million pounds, up 1% – 1,850,000 taps, unchanged – 0.299 gallons, 3.289 pounds per tap, up 1%

5
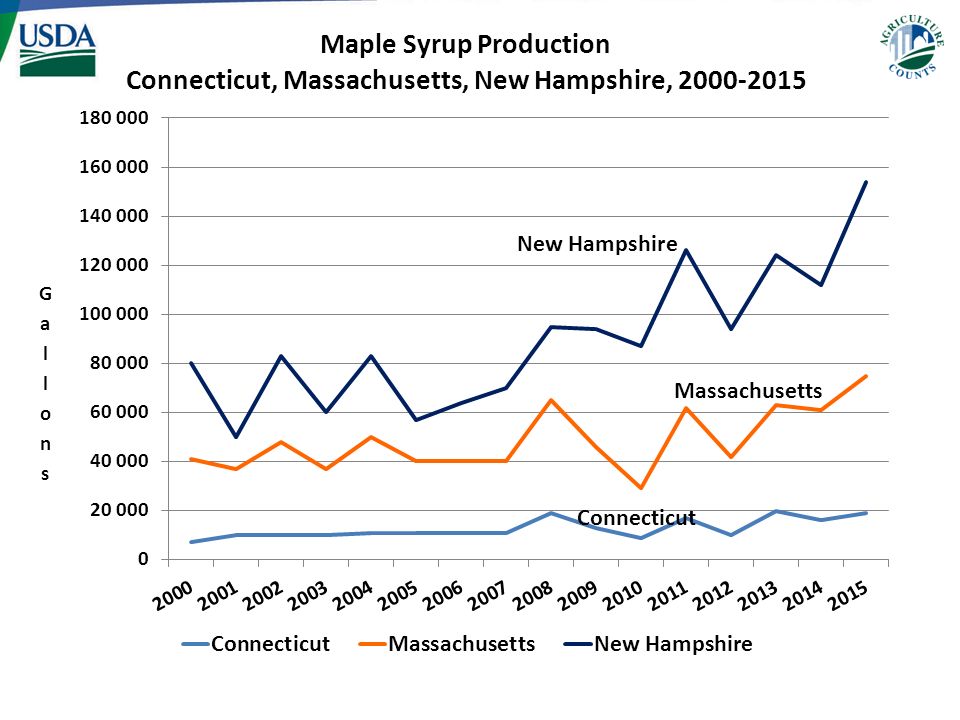
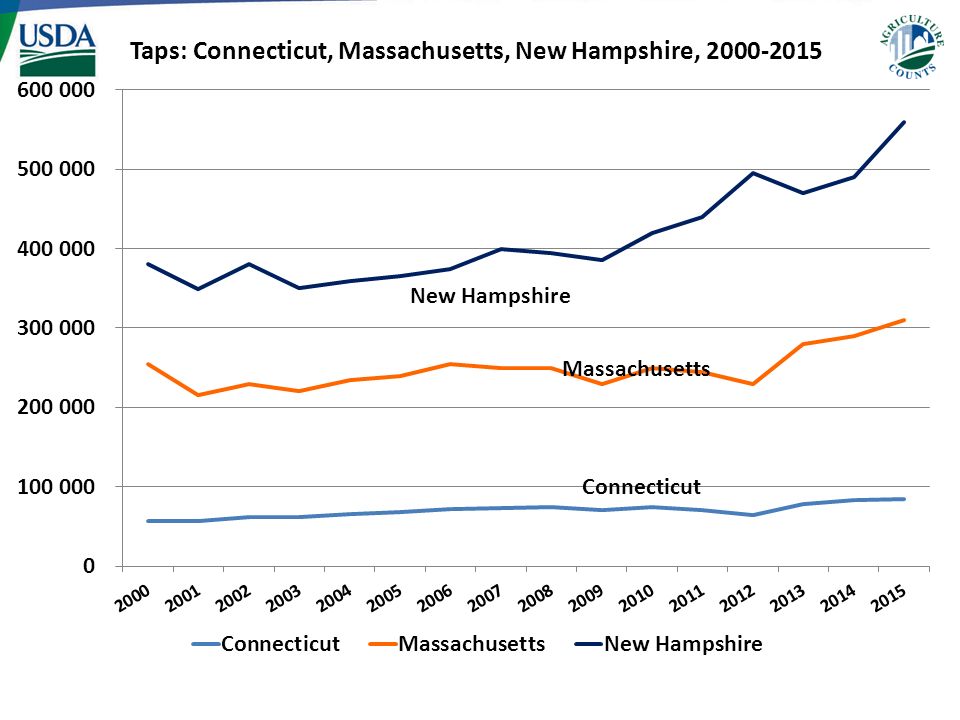
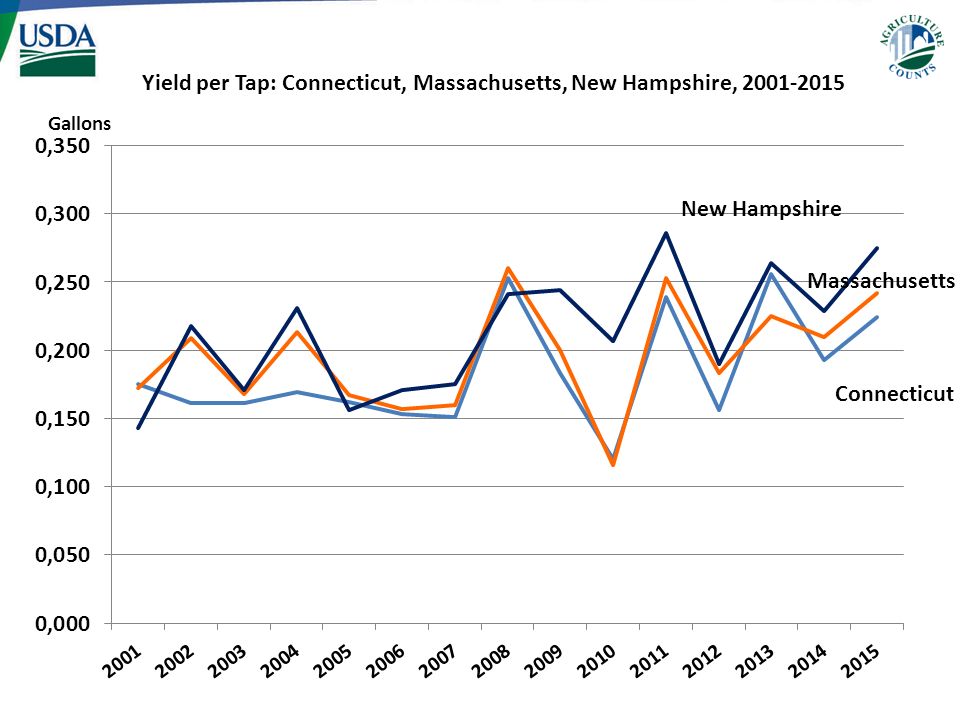
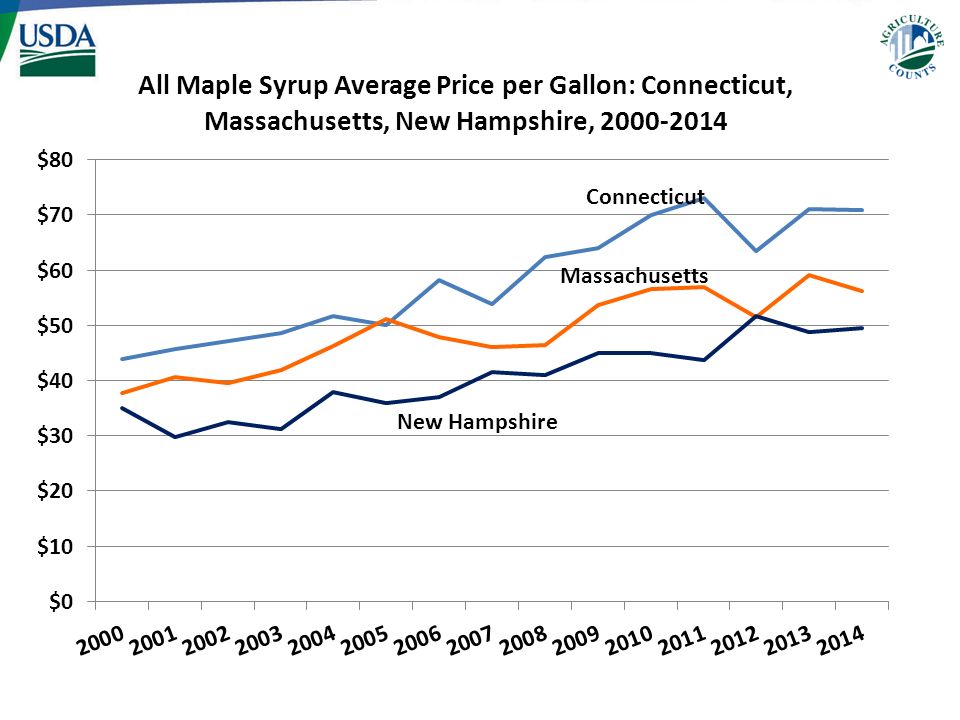
2015 Maple Syrup Production Highlights New Hampshire – 154,000 gallons, 1.694 million pounds, up 38% – 560,000 taps, up 14% – 0.275 gallons per tap, 3.025 pounds, up 20% Massachusetts – 75,000 gallons, 825,000 pounds, up 23% – 310,000 taps, up 7% – 0.242 gallons per tap, 2.662 pounds per tap, up 15% Connecticut – 19,000 gallons, 209,000 pounds, up 19% – 85,000 taps, up 2% – 0.224 gallons per tap, 2.464 pounds per tap, up 16%

6
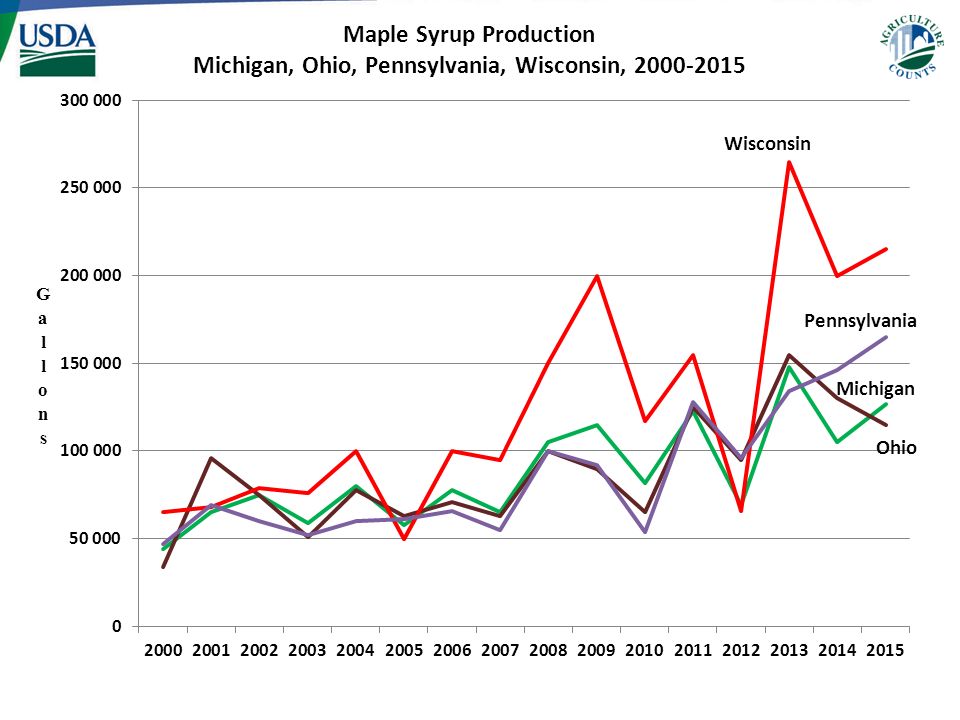
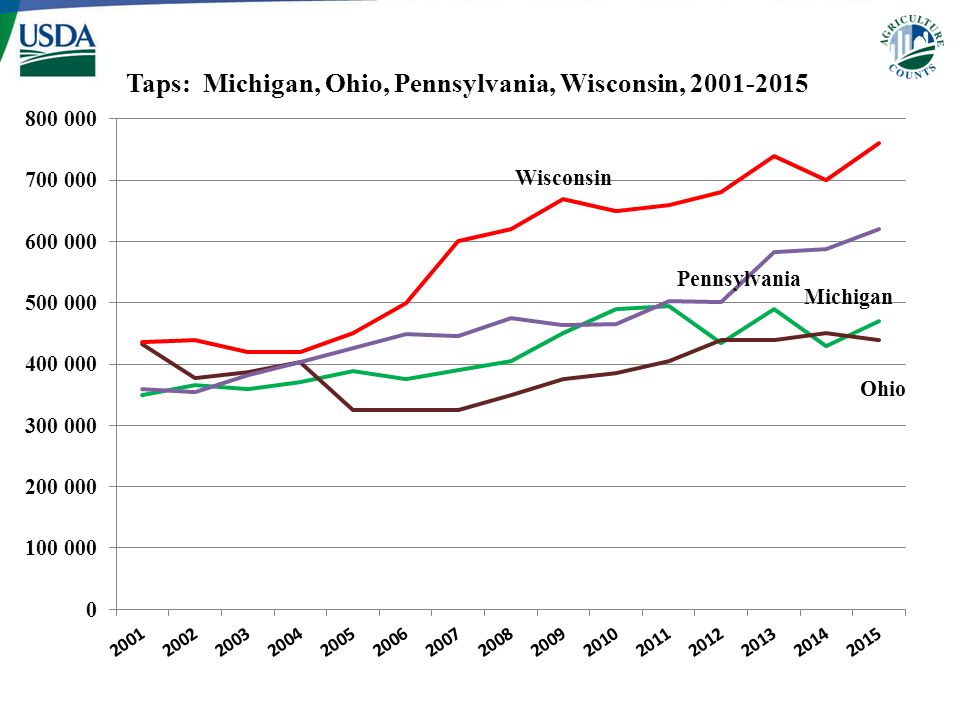
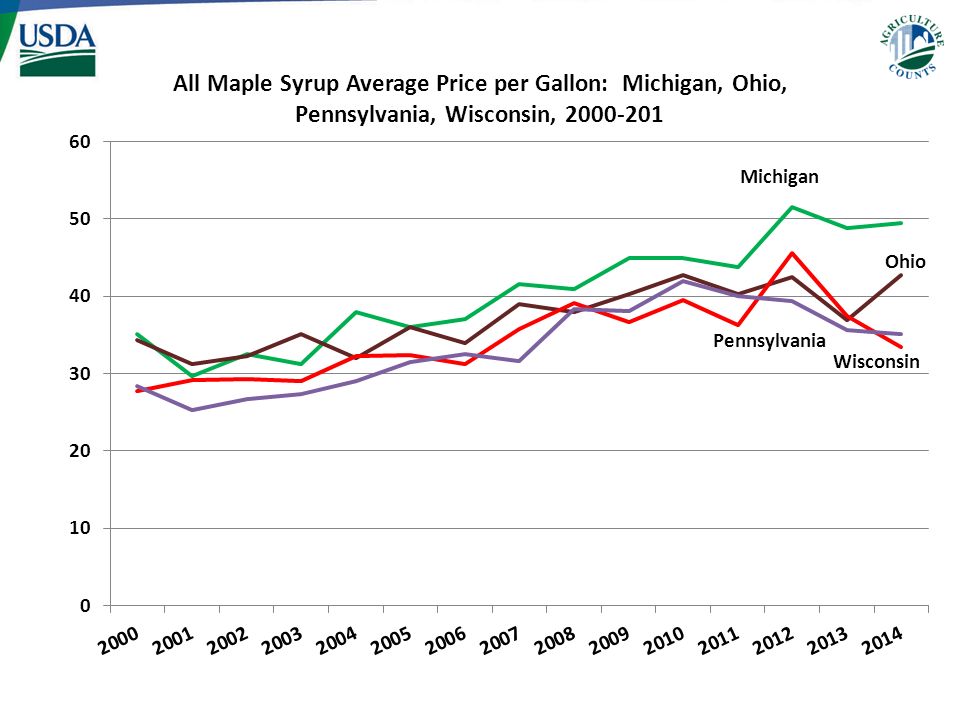
Pennsylvania – 165,000 gallons, 1.815 million pounds, up 13% – 620,000 taps, up 5% – 0.266 gallons per tap, 2.926 pounds, up 7% Wisconsin – 215,000 gallons, 2.365 million pounds, up 8% – 760,000 taps, up 9% – 0.283 gallons per tap, 3.113 pounds, down 1% Michigan – 127,000 gallons, 1.397 million pounds, up 21% – 470,000 taps, up 9% – 0.270 gallons per tap, 2.97 pounds, up 11% Ohio – 115,000 gallons, 1.265 million pounds, down 12% – 440,000 taps, down 2% – 0.261 gallons per tap, 2.871 pounds down 10% 2015 Maple Syrup Production Highlights

7
Maple Syrup Season – States and United States: 2013-2015 Date season opened 1/Date season closed 2/Average season length 3/ 201320142015201320142015201320142015 State(date)(days) Connecticut2-Jan14-Jan1-Feb28-Apr22-Apr20-Apr413527 Maine13-Jan14-Jan9-Feb30-Apr11-May8-May392927 Massachusetts8-Jan5-Feb14-Mar15-Apr26-Apr11-Apr363128 Michigan8-Feb19-Feb1-Mar29-Apr6-May27-Apr322426 New Hampshire30-Jan10-Jan18-Mar26-Apr1-May13-Apr383026 New York1-Jan10-Jan12-Jan1-May3-May16-May403226 Ohio4-Jan13-Jan19-Jan18-Apr3-May23-Apr373027 Pennsylvania10-Jan5-Feb15-Jan8-May30-Apr 393228 Vermont8-Jan10-Jan1-Jan1-May23-May5-May412826 Wisconsin15-Feb8-Mar28-Feb28-May4-May15-Apr2923 United States(X) 372926 (X) Not applicable. 1/ Approximately the first day that sap was collected. 2/ Approximately the last day that sap was collected. 3/ The average number of days that sap was collected.

8
Maple Syrup Average Open and Close Season Dates – States and United States: 2013-2015 Season Opened 1/Season Closed 2/ 201320142015201320142015 State(date) Connecticut12-Feb26-Feb10-Mar25-Mar2-Apr6-Apr Maine4-Mar21-Mar 12-Apr19-Apr17-Apr Massachusetts26-Feb9-Mar14-Mar3-Apr9-Apr11-Apr Michigan9-Mar21-Mar13-Mar10-Apr14-Apr8-Apr New Hampshire28-Feb14-Mar18-Mar7-Apr13-Apr New York27-Feb13-Mar17-Mar9-Apr14-Apr12-Apr Ohio20-Feb4-Mar7-Mar29-Mar2-Apr3-Apr Pennsylvania26-Feb6-Mar10-Mar5-Apr8-Apr6-Apr Vermont3-Mar20-Mar22-Mar13-Apr17-Apr Wisconsin25-Mar28-Mar14-Mar23-Apr19-Apr6-Apr 1/ Approximate average opened date based on reported data. 2/ Approximate average closed date based on reported data.

9
Million Gallons U.S. Maple Syrup Production, 2000-2015

10
Gallons 2015 Maple Production by State United States 2015 Maple Syrup Production: 3.414 million gallons

15
United States 2015 Maple Syrup Taps: 11,895,000 U.S. Maple Taps 2015 Taps by State

23
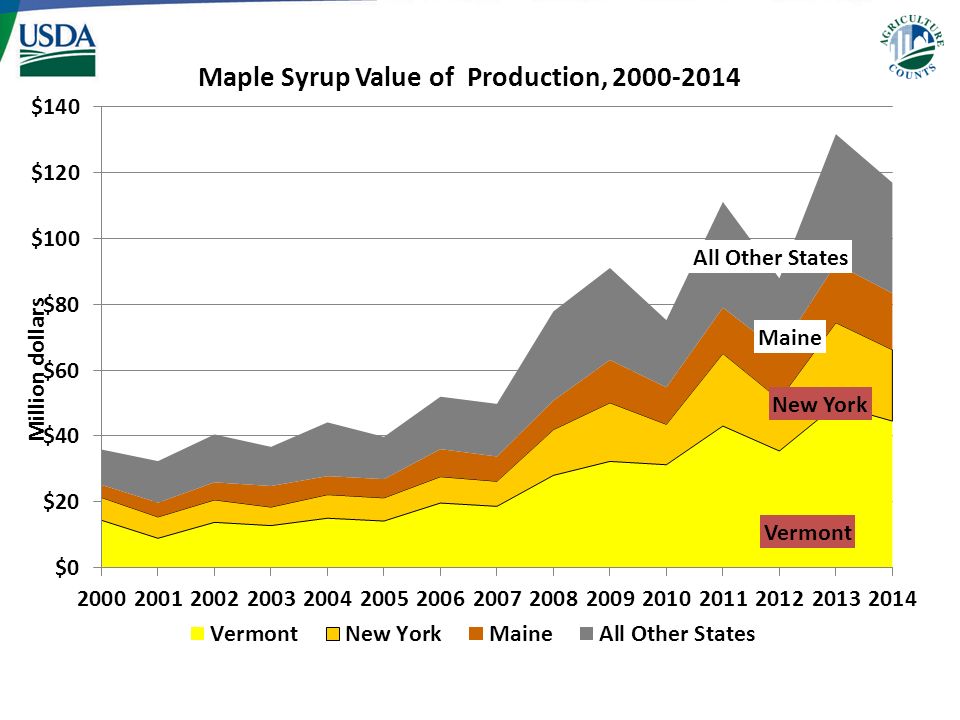
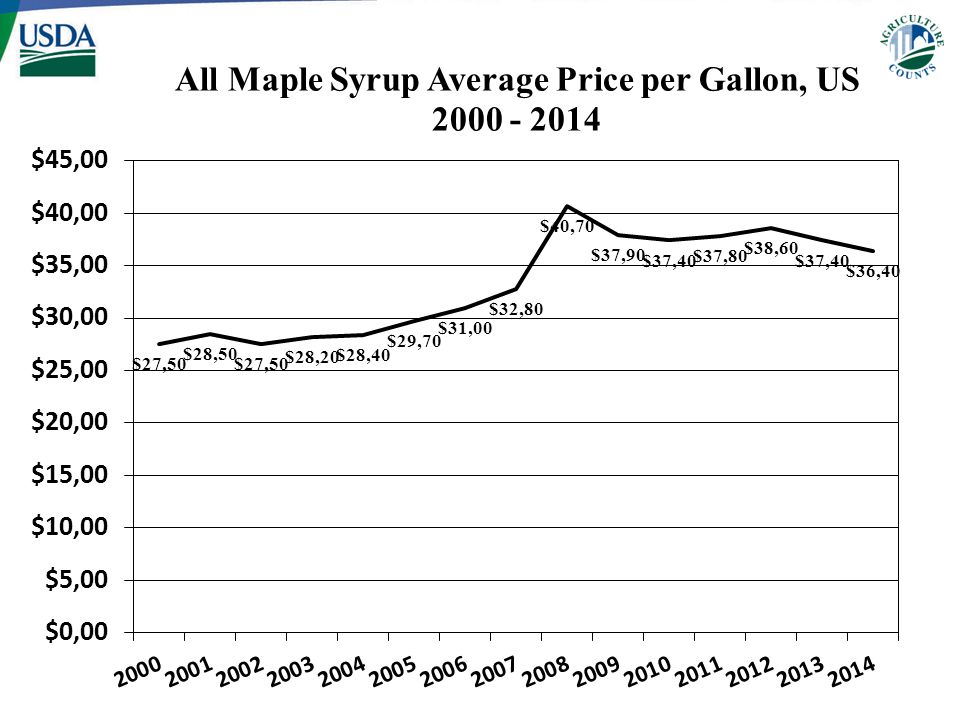
2014 Maple Syrup Prices and Value of Production U.S. – Total value of production: $117.0 million down 12% from 2013 2014 Production was was down 9% – Average price received: $36.40 per gallon Down 3% from $37.40 in 2013

24
2014 Maple Syrup Prices and Value of Production Value of production decreased in all States except Pennsylvania Average price received per gallon – Decreased in Connecticut, Maine, Massachusetts, New York, Pennsylvania, Vermont, and Wisconsin – Increased in Michigan, New Hampshire, and Ohio – Bulk price lower in every State except Massachusetts – Percentage of 2014 crop sold in bulk fluctuated less than 5 percent in all States except Massachusetts (+9%) Pennsylvania (down 9%)
 Pennsylvania (down 9%)")
31
Finding NASS Maple Survey Reports

32
Maple Survey results are published in NASS June Crop Production – Publications Select any month from calendar Select Crop Production (around 10 th of month) Expand list of 2010s reports Finding NASS Maple Survey Reports
 Expand list of 2010s reports Finding NASS Maple Survey Reports")
33
Maple Report from Northeastern Regional Field Office from any of the Northeastern Region’s States websites

34
From Publications – Select New Releases or Special Reports – List of reports by date – 2015 Maple Syrup release was on 6/11/2015 Maple Report from Northeastern Regional Field Office from any of the Northeastern Region’s States websites

35
Presentations are available from any New England State website

36
Or upload published data using our Quick Stats query tool at http://quickstats.nass.usda.gov/ http://quickstats.nass.usda.gov/ Also available under Data and Statistics from Home page

37
Proposed Changes to USDA NASS Maple Estimation Program Proposed States that will be added beginning in 2016 – Minnesota – Indiana – West Virginia No States will be dropped

38
Keyes to improving accuracy Accurate reporting – Encourage producers to respond and report as accurately as possible

39
Keyes to improving accuracy We need to know who is producing Work with your State Statistician

40
Providing contact information on line

41
Importance of Statistics Accurate statistics are needed for: decision-making promoting the maple syrup industry educates policy makers facilitates financial assistance maple-related research

42
Confidentiality Names, addresses, and personal identifiers are fully protected by NASS with the force of law. Only authorized persons working for NASS as employees or sworn agents, who are subject to fines and imprisonment for unauthorized disclosure, can access individual record data and only for approved official purposes. Data security is a top priority during preparation of NASS reports. Published statistics from NASS surveys and censuses will not disclose reported data from an individual.

43
USDA NASS Maple Syrup Contact info: Northeast Regional Field Office King Whetstone, Director 4050 Crums Mill Road Suite 203 Harrisburg, Pennsylvania 17112 Phone: (717) 787-3904 Email: : nassrfoner@nass.usda.gov New England Field Office Gary Keough, State Statistician 53 Pleasant Street, Rm 3450 Concord, NH 03301-9902 Phone: (603) 227-3129 New York Field Office Blair Smith, State Statistician 10B Airline Drive Albany, NY 12235 Phone: (518) 457-5570 or 1-800-821-1276
 : New England Field Office Gary Keough, State Statistician 53 Pleasant Street, Rm 3450 Concord, NH Phone: (603) New York Field Office Blair Smith, State Statistician 10B Airline Drive Albany, NY Phone: (518) or")
44
USDA NASS Maple Syrup Contact info: Great Lakes Regional Field Office Marlow Johnson, Director 3001 Coolidge Road Suite 400 East Lansing, MI 48823 Phone: 1-800-453-7501 Email: : nassrfoglr@nass.usda.gov Ohio Field Office Sheryl Turner, State Statistician Bromfield Admin Bldg, Rm 103, 8995 E Main St. Reynoldsburg, OH 43068 Phone: (614) 728-2100 or (800) 858-8144 Indiana Field Office Greg Matli, State Statistician Charles A Halleck Federal Bldg. 230 N 4th St. Suite 104 Lafayette, IN 47901 Phone: (765)494-8371 or (800)363-0469
 or (800) Indiana Field Office Greg Matli, State Statistician Charles A Halleck Federal Bldg. 230 N 4th St. Suite 104 Lafayette, IN Phone: (765) or (800)")
45
USDA NASS Maple Syrup Contact info: Upper Midwest Regional Field Office Greg Thessen, Regional Director 833 Federal Building 210 Walnut Street Des Moines, IA 50309 Phone: (515) 284-4340 or (800) 772-0825 Email: nassrfoumr@nass.usda.gov Minnesota Field Office Dan Lofthus, State Statistician 375 Jackson Street Ste 610 St. Paul, MN 55101 Phone: (651) 728-3113 Wisconsin Field Office Greg Bussler, State Statistician 2811 Agriculture Dr. Madison, WI 537186777 Phone: (608) 224-4848 or (800) 789-9277 FAX: (800) 838-6277
 Wisconsin Field Office Greg Bussler, State Statistician 2811 Agriculture Dr. Madison, WI Phone: (608) or (800) FAX: (800)")
46
USDA NASS Maple Syrup Contact info: Eastern Mountain Regional Field Office David Knopf, Regional Director P.O. Box 1120 Louisville, Ky 40201 Phone: 1-800-928-5277 Email: nassfoemr@nass.usda.govnassfoemr@nass.usda.gov West Virginia Field Office Charmaine Wilson, State Statistician 1900 Kanawha Blvd. E. Charleston, WV 25305-0170 Phone: (304) 357-5123 or (800) 535-7088
 or (800)")
47
Thank you and have a GREAT season!! 2006 NAMSC Meeting, Green Bay, WI

Similar presentations


 Florida (FL) Georgia (GA) Mississippi (MS) Louisiana (LA) Arkansas (AR) Tennessee (TN)>")


 Recent Trends March 2006 (all-time high of $1.213 trillion) – July 2009 ($958.0 billion)>")

