Download presentation
Presentation is loading. Please wait.

3
You can calculate: Central tendency Variability You could graph the data

4
You can calculate: Central tendency Variability You could graph the data

5
Bivariate Distribution

6
Positive Correlation

8
Regression Line

9
Correlation r = 1.00

10
Regression Line..... r =.64

11
Regression Line.... r =.64.

12
Practice

13
Regression Line

14
.....

15
.....

17
Negative Correlation

18
r = - 1.00

19
Negative Correlation..... r = -.85

21
Zero Correlation

22
..... r =.00

23
Correlation Coefficient The sign of a correlation (+ or -) only tells you the direction of the relationship The value of the correlation only tells you about the size of the relationship (i.e., how close the scores are to the regression line)
 only tells you the direction of the relationship The value of the correlation only tells you about the size of the relationship (i.e., how close the scores are to the regression line)")
24
Excel Example

25
Which is a bigger effect? r =.40 or r = -.40 How are they different?

26
Interpreting an r value What is a “big r” Rule of thumb: Smallr =.10 Mediumr =.30 Larger =.50

27
Practice Do you think the following variables are positively, negatively or uncorrelated to each other? Alcohol consumption & Driving skills Miles of running a day & speed in a foot race Height & GPA Forearm length & foot length Test #1 score and Test#2 score

29
Statistics Needed Need to find the best place to draw the regression line on a scatter plot Need to quantify the cluster of scores around this regression line (i.e., the correlation coefficient)
")
30
Covariance Correlations are based on the statistic called covariance Reflects the degree to which two variables vary together –Expressed in deviations measured in the original units in which X and Y are measured

31
Note how it is similar to a variance –If Ys were changed to Xs it would be s 2 How it works (positive vs. negative vs. zero)
.")
32
Computational formula

33
Ingredients: ∑XY ∑X ∑Y N

36
N = 5

37
∑XY = 84 ∑Y = 23 ∑X = 15 N = 5

38
∑XY = 84 ∑Y = 23 ∑X = 15 N = 5

39
∑XY = 84 ∑Y = 23 ∑X = 15 N = 5

40
∑XY = 84 ∑Y = 23 ∑X = 15 N = 5

41
∑XY = 84 ∑Y = 23 ∑X = 15 N = 5

42
Problem! The size of the covariance depends on the standard deviation of the variables COV XY = 3.75 might occur because –There is a strong correlation between X and Y, but small standard deviations –There is a weak correlation between X and Y, but large standard deviations

43
Solution Need to “standardize” the covariance Remember how we standardized single scores

44
Correlation

48
Practice You are interested in if candy intake is related to childhood depression. You collect data from 5 children.

49
Practice CandyDepression Charlie555 Augustus743 Veruca459 Mike3108 Violet465 S candy = 1.52S depression = 24.82

50
Practice Candy (X) Depression (Y) XY Charlie555275 Augustus743301 Veruca459236 Mike3108324 Violet465260 ∑
 Depression (Y) XY Charlie Augustus Veruca Mike Violet ∑")
51
Practice Candy (X) Depression (Y) XY Charlie555275 Augustus743301 Veruca459236 Mike3108324 Violet465260 ∑233301396
 Depression (Y) XY Charlie Augustus Veruca Mike Violet ∑")
52
∑XY = 1396 ∑Y = 330 ∑X = 23 N = 5

53
∑XY = 1396 ∑Y = 330 ∑X = 23 N = 5

54
Correlation COV = -30.5 Sx = 1.52 Sy = 24.82

55
Correlation COV = -30.5 Sx = 1.52 Sy = 24.82

56
Hypothesis testing of r Is there a significant relationship between X and Y (or are they independent) –Like the X 2
 –Like the X 2")
57
Steps for testing r value 1) State the hypothesis 2) Find t-critical 3) Calculate r value 4) Calculate t-observed 5) Decision 6) Put answer into words
 State the hypothesis 2) Find t-critical 3) Calculate r value 4) Calculate t-observed 5) Decision 6) Put answer into words")
58
Practice Determine if candy consumption is significantly related to depression. –Test at alpha =.05

59
Practice CandyDepression Charlie555 Augustus743 Veruca459 Mike3108 Violet465 S candy = 1.52S depression = 24.82

60
Step 1 H 1 : r is not equal to 0 –The two variables are related to each other H 0 : r is equal to zero –The two variables are not related to each other

61
Step 2 Calculate df = N - 2 Page 747 –First Column are df –Look at an alpha of.05 with two-tails

62
t distribution df = 3 0

63
t distribution t crit = 3.182 t crit = -3.182 0

64
t distribution t crit = 3.182 t crit = -3.182 0

65
Step 3 COV = -30.5 Sx = 1.52 Sy = 24.82

66
Step 4 Calculate t-observed

67
Step 4 Calculate t-observed

68
Step 4 Calculate t-observed

69
Step 5 If t obs falls in the critical region: –Reject H 0, and accept H 1 If t obs does not fall in the critical region: –Fail to reject H 0

70
t distribution t crit = 3.182 t crit = -3.182 0

71
t distribution t crit = 3.182 t crit = -3.182 0 -2.39

72
Step 5 If t obs falls in the critical region: –Reject H 0, and accept H 1 If t obs does not fall in the critical region:If t obs does not fall in the critical region: –Fail to reject H 0

73
Step 6 Determine if candy consumption is significantly related to depression. –Test at alpha =.05 Candy consumption is not significantly related to depression –Note: this finding is due to the small sample size

74
Practice Is there a significant (.05) relationship between aggression and happiness?
 relationship between aggression and happiness")
75
Mean aggression = 14.50; S 2 aggression = 19.63 Mean happiness = 6.00; S 2 happiness = 4.67

76
Answer Cov = -7.33 r = -.76 t crit = 4.303 Thus, fail to reject Ho Aggression was not significantly related to happiness

78
Practice Situation 1 Based on a sample of 100 subjects you find the correlation between extraversion is happiness is r=.15. Determine if this value is significantly different than zero. Situation 2 Based on a sample of 600 subjects you find the correlation between extraversion is happiness is r=.15. Determine if this value is significantly different than zero.

79
Step 1 Situation 1 H 1 : r is not equal to 0 –The two variables are related to each other H 0 : r is equal to zero –The two variables are not related to each other Situation 2 H 1 : r is not equal to 0 –The two variables are related to each other H 0 : r is equal to zero –The two variables are not related to each other

80
Step 2 Situation 1 df = 98 t crit = +1.985 and -1.984 Situation 2 df = 598 t crit = +1.96 and -1.96

81
Step 3 Situation 1 r =.15 Situation 2 r =.15

82
Step 4 Situation 1 Situation 2

83
Step 5 Situation 1 If t obs falls in the critical region: –Reject H 0, and accept H 1 If t obs does not fall in the critical region: –Fail to reject H 0 Situation 2 If t obs falls in the critical region: –Reject H 0, and accept H 1 If t obs does not fall in the critical region: –Fail to reject H 0

84
Step 6 Situation 1 Based on a sample of 100 subjects you find the correlation between extraversion is happiness is r=.15. Determine if this value is significantly different than zero. There is not a significant relationship between extraversion and happiness Situation 2 Based on a sample of 600 subjects you find the correlation between extraversion is happiness is r=.15. Determine if this value is significantly different than zero. There is a significant relationship between extraversion and happiness.

Similar presentations

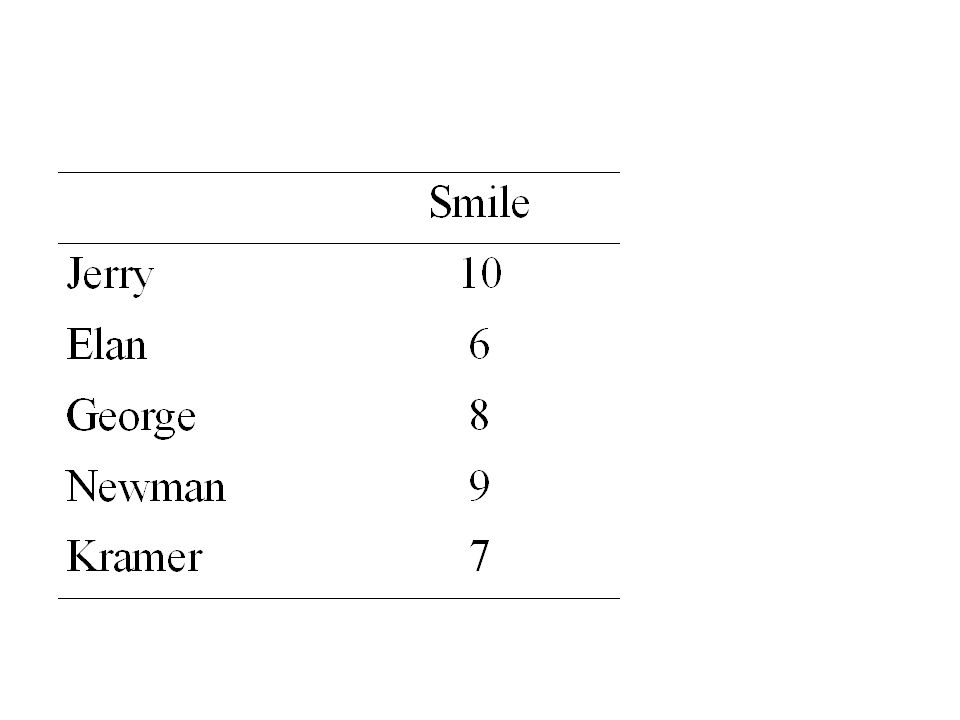

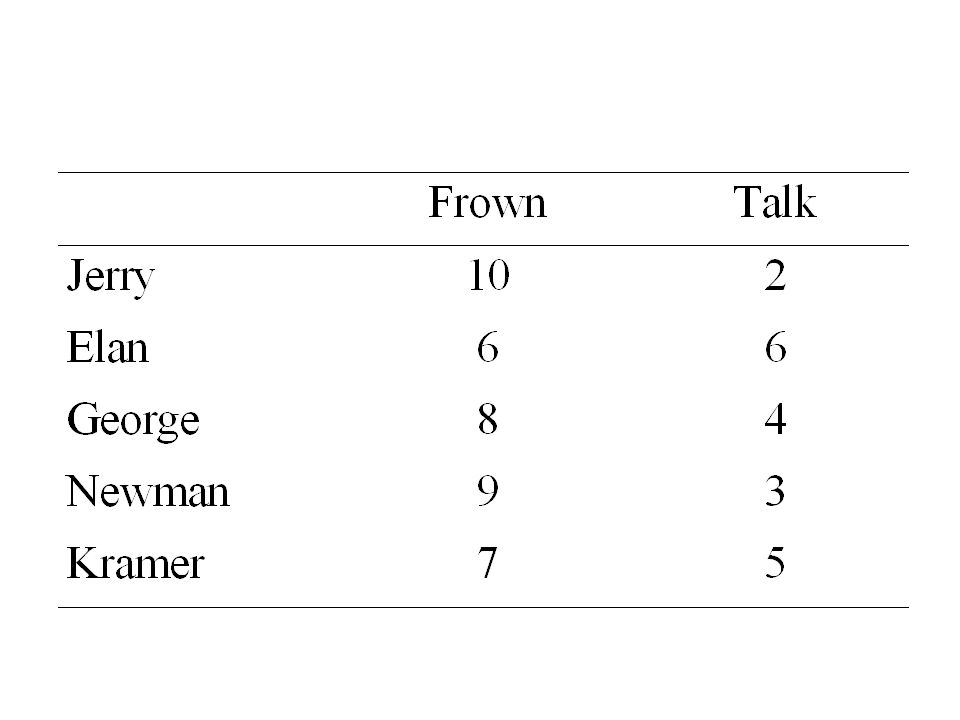
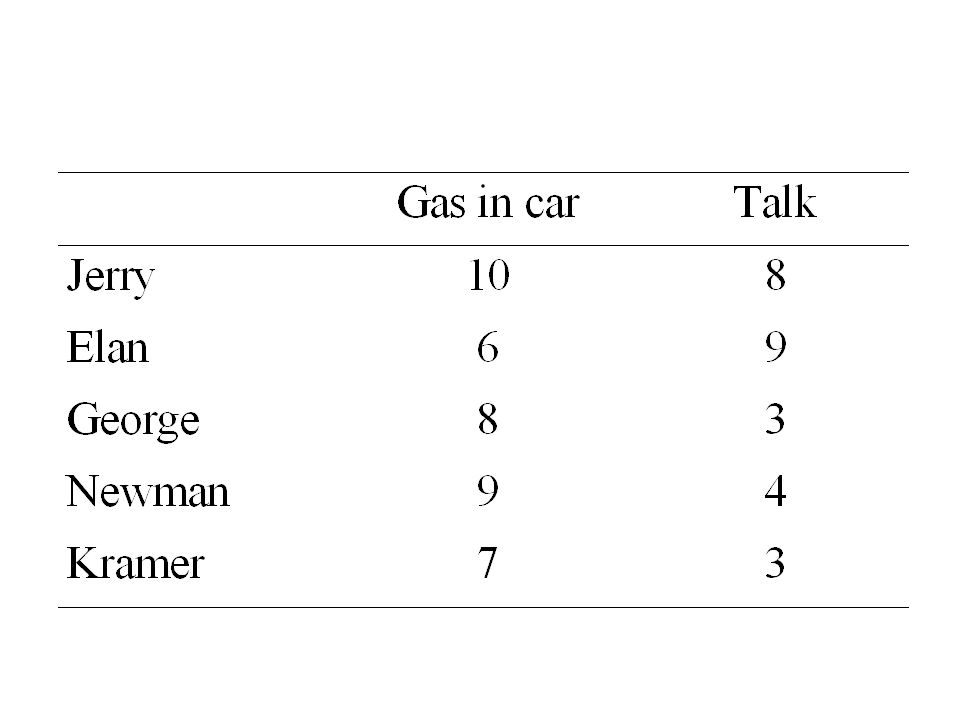


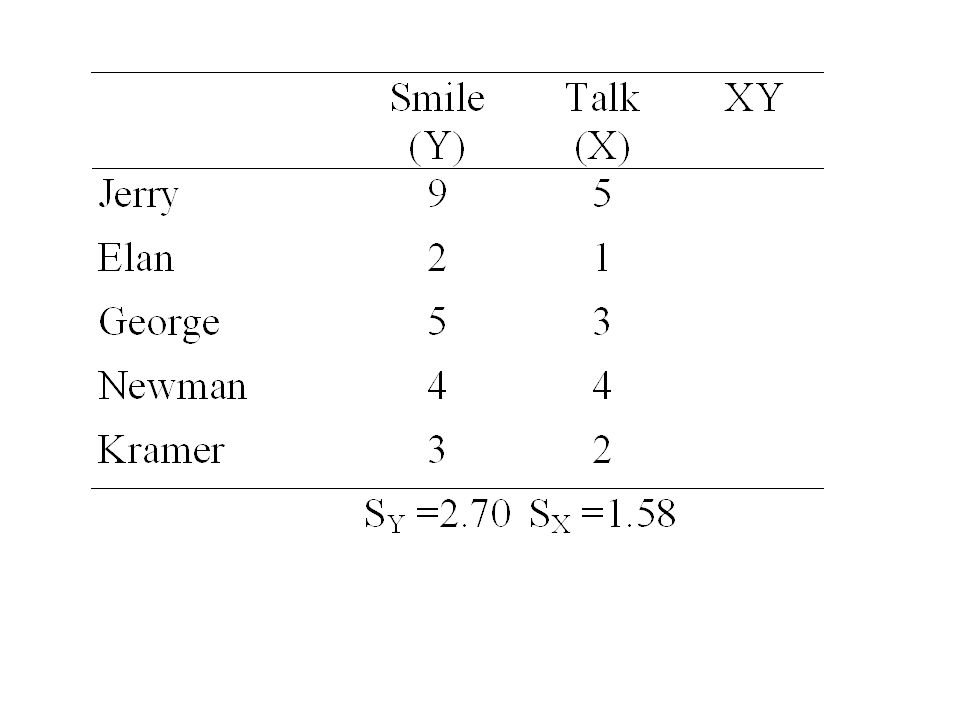


 Table I χ 2 test for independence (19.9) Table.>")
 Association Between Variables Measured at the Interval-Ratio Level: Bivariate Correlation and Regression.>")


