Download presentation
Presentation is loading. Please wait.

1
The concept of a Master Sample: Lower Columbia Example Phil Larsen Pacific States Marine Fisheries Commission c/o USEPA 200 SW 35 th St. Corvallis, OR 97330 Email: Larsen.Phil@epa.gov Phone: 541 754 4362

2
Background Many agencies are interested in regional scale monitoring of stream networks and watersheds, using similar attributes and similar/same protocols Can’t afford to monitor everywhere (i.e., can’t census) Conducting a sample survey a sound way to characterize a region by monitoring a representative set of sites
 Conducting a sample survey a sound way to characterize a region by monitoring a representative set of sites")
3
LCFRB: Habitat Monitoring Key Entities Federal –5 agencies State –5 agencies Local –At least 12

4
From Stevens and Olsen, 2004 Spatially balanced sampling of natural resources. JASA 99: 262-278 select a spatially balanced sample of finite, linear, and areal resources with patterned and possibly periodic responses use arbitrarily variable inclusion probability with imperfect frame information, in the presence of substantial nonresponse. Sampling the gamut of natural resources requires a technique that can…

5
Spatially Balanced Sampling GRTS: Generalized Random-Tessellation Stratified design –Incorporates randomization –Is spatially balanced –Creates an ordered list of sites See: www.epa.gov/nheerl/arm for details

7
Combining Data Data from different sample surveys can be combined if certain design principles are followed –Similar target populations are well defined –The same frame represents the target populations (i.e., use the same digital stream trace coverage) –Randomization in site selection –Common protocols are used to measure stream attributes
 –Randomization in site selection –Common protocols are used to measure stream attributes")
8
A Desirable Goal Create a design that allows and facilitates integration up front rather than after the fact. Current GRTS design allows selection of a “master” sample that can be subset to meet specific needs at a variety of spatial scales

9
Washington Frame: USGS 1:100,000 scale digital hydrography (perennial and intermittent) Selected a statewide sample of about 125,500 points on the network as an ordered list –Any subset drawn in order is a spatially balanced sample Distance between points is approximately 1 km. Assigned a set of classification variables for sorting the sample

10
The Master Sample (An ordered list of sites) Site ID Location (Lat/Long) County Quad 100 Strahler order Perennial/intermittent Ecoregion –Level 2 –Level 3 –Level 4 USGS Hydro units –By number –By name WRIA –Name –Area other geo-referenced variables
 Site ID Location (Lat/Long) County Quad 100 Strahler order Perennial/intermittent Ecoregion –Level 2 –Level 3 –Level 4 USGS Hydro units –By number –By name WRIA –Name –Area other geo-referenced variables")
11
LCFRB: Stratification Scheme Table 6 Ecoregion WRIA Subbasin (different from USGS subbasin?) Physiographic zone (different from ecoregion?) Stream order
 Physiographic zone (different from ecoregion ) Stream order")
12
siteID WAW05541- 000001 WAW05541- 000002 WAW05541- 000003 lon_ddnad27-121.58-118.09-121.99 lat_ddnad2748.9747.2646.78 lon_dmsnad27-121 35 15.065846-118 5 51.862175-121 59 41.505539 lat_dmsnad2748 58 39.93494147 16 10.93999146 47 11.904925 xalbersnad27US-1873590-1666430-1967970 yalbersnad27US313947028920702914850 stratum111 md_caty111 nest1_wt111 str_nameSILESIA CR, W FK*A strahler211 PerenIntermitPIP major150 minor1412 minor206100 minor3000 sinuous1.091.151.12 stateWA countyWHATCOMLINCOLNPIERCE quad100MT BAKERRITZVILLECENTRALIA quad75MT SEFRITSPRAGUE LKASHFORD WA Master Sample File

13
Example Pick a statewide sample –50 sites in each of the 5 OR DEQ reporting regions –Equal balance among headwater (1 st order) wadeable (2 nd, 3 rd order) non-wadeable (4 th + order) streams About 17 sites per stratum
 wadeable (2 nd, 3 rd order) non-wadeable (4 th + order) streams About 17 sites per stratum")
14
Example Solution –Create stream groups: headwater, wadeable, non-wadeable from stream order assignments –Sort the list by DEQ region and stream group within DEQ region, maintaining the original order of sites –Pick the first 17 sites on the list within each DEQ region and stream order group

16
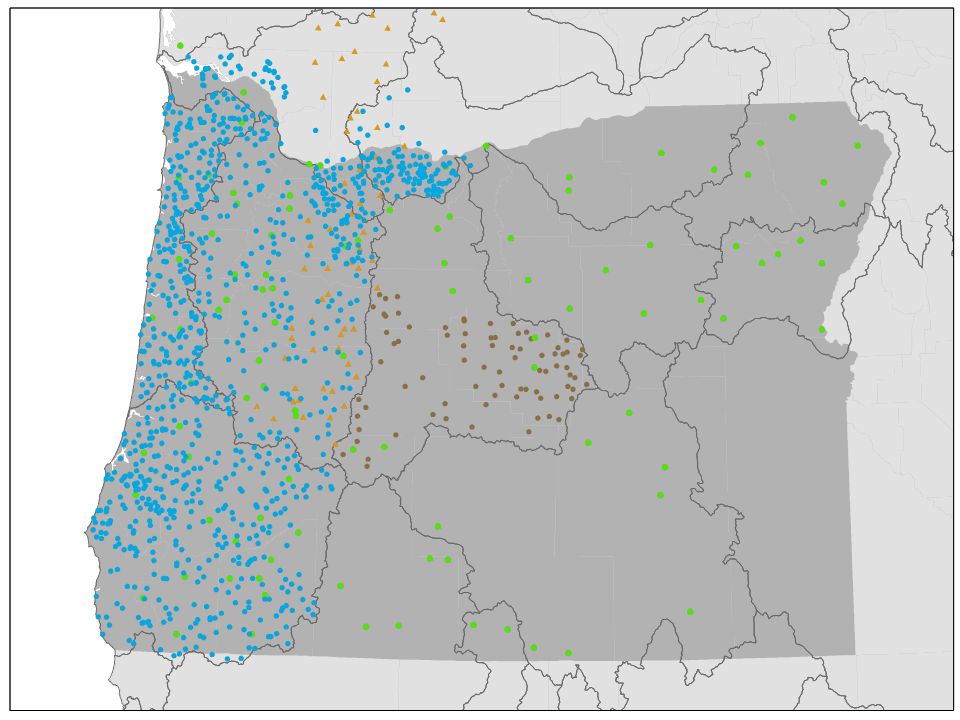
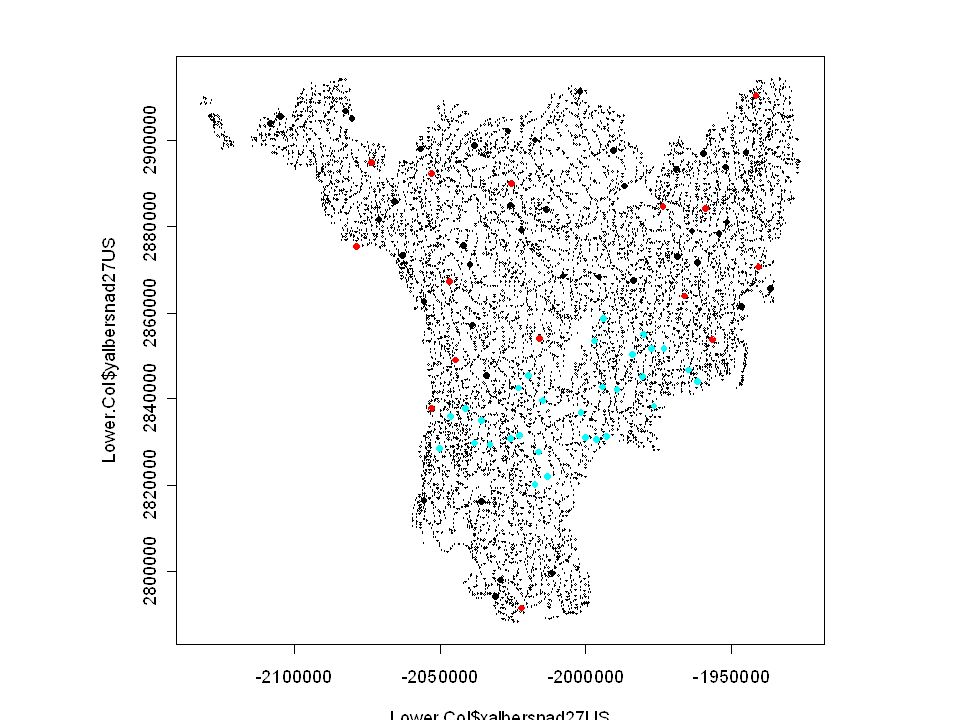
Intensify in three sub-basins

17
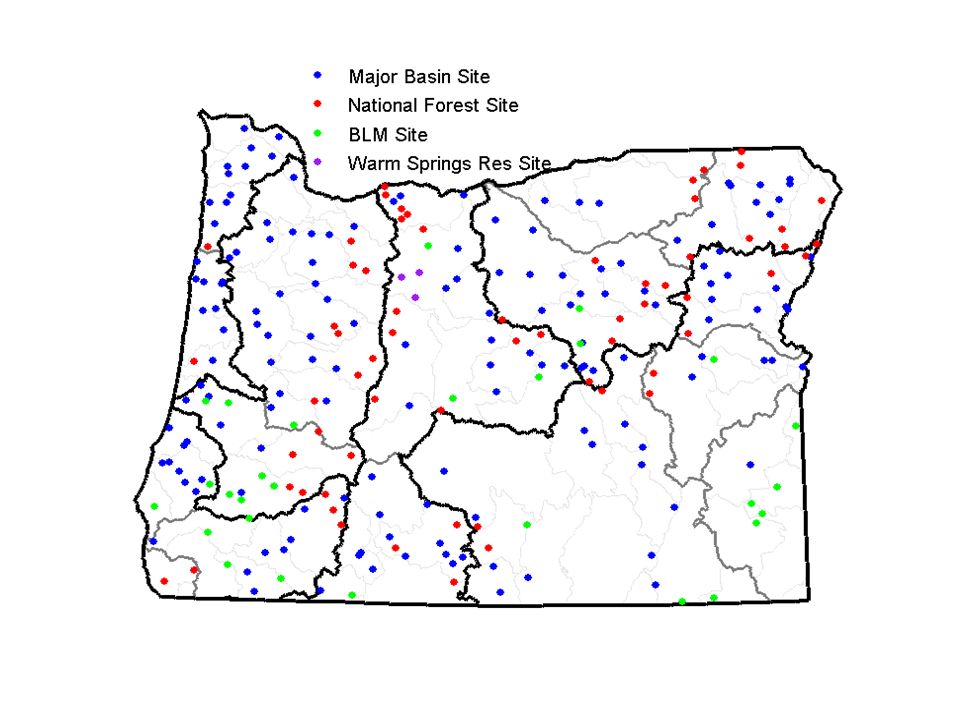
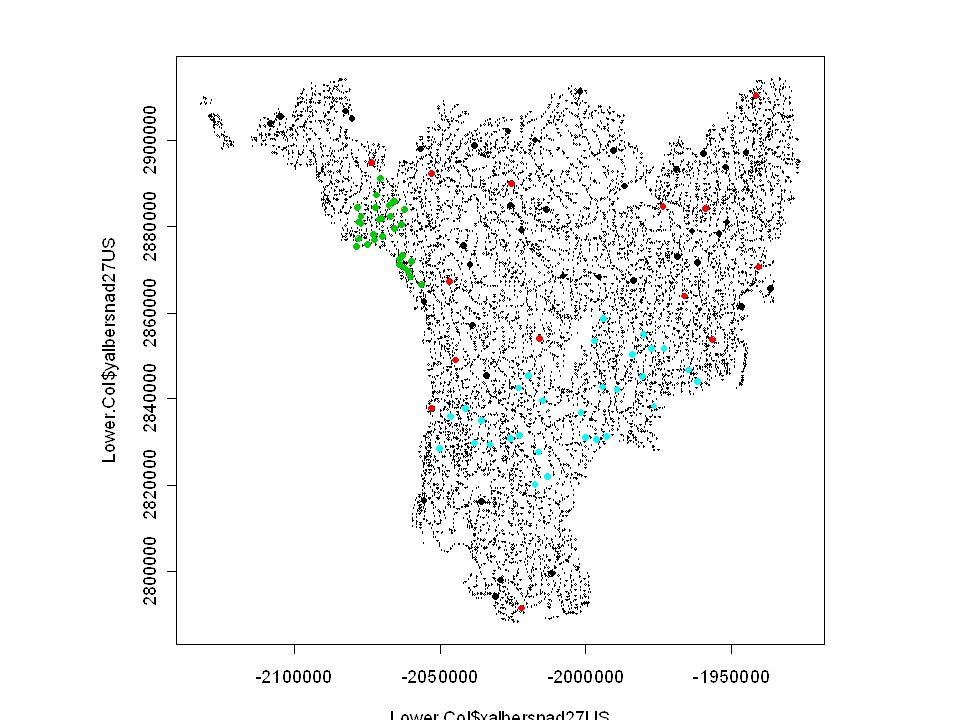
Intensify in one National Forest and one BLM District

18
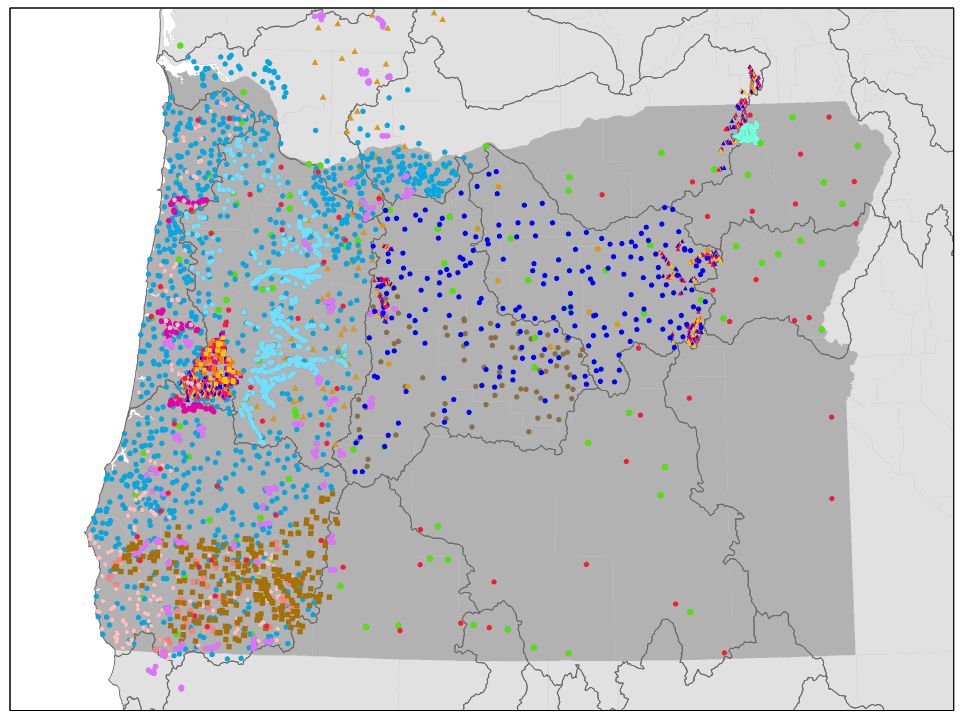
Combine stream network and watershed selection

19
Washington Master Sample Example Designs

20
TEMPORAL DESIGN: AUGMENTED SERIALLY ALTERNATING Note: although not indicated here, within year revisits to sites are important to evaluate seasonal variation and field crew performance. Figure courtesy of Scott Urquhart.

21
Example Design Characteristics Equal # of sites by Strahler order categories: 1 st, 2 nd, 3 rd + State-Wide design –1054 unique sites allocated to 6 panels –Panels 1 to 5 visit once every 5 years –Panel 6 visit annually –1550 site-visits over 5 years –310 sites per year

22
State-Wide 5 Year: 6 Panel Design

23
State-Wide: Panel 1

24
Example Design Characteristics WRIA design –17 sites each WRIA for total 1054 sites –1054 unique sites allocated to 6 panels –Panels 1 to 5 visit once every 5 years –Panel 6 visit annually –1550 site-visits over 5 years –310 sites per year Intensive design –50 total sites in 3 WRIAs –17 sites from WRIA 5 year design and 33 additional sites

25
WRIA 5 Year Design

26
WRIA Design: Panel 1

27
Intensive Studies + WRIA 5 Year Design

28
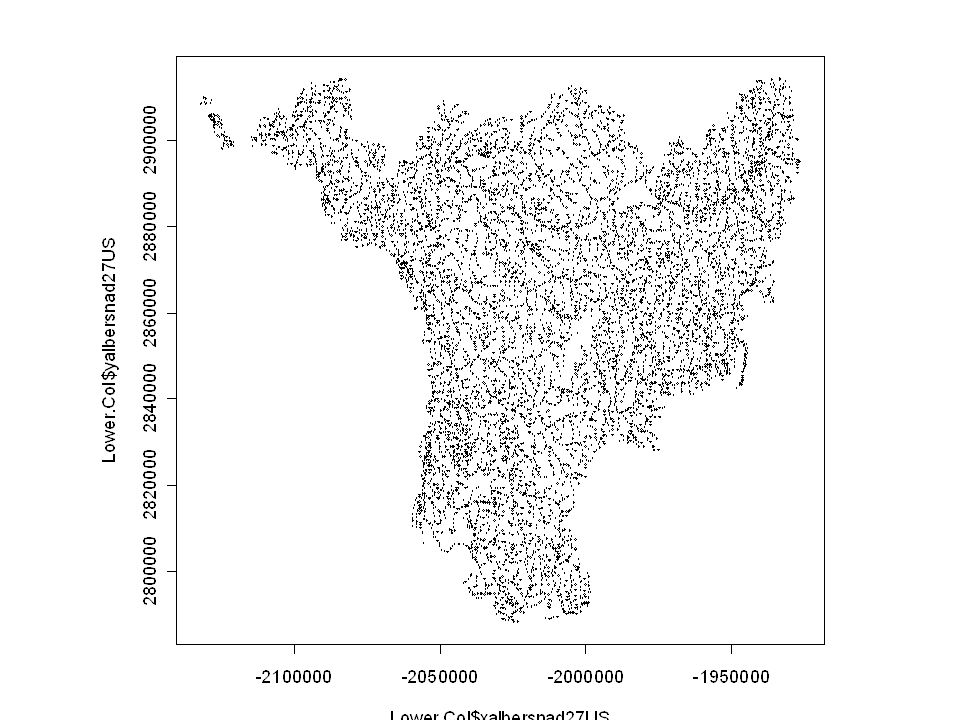
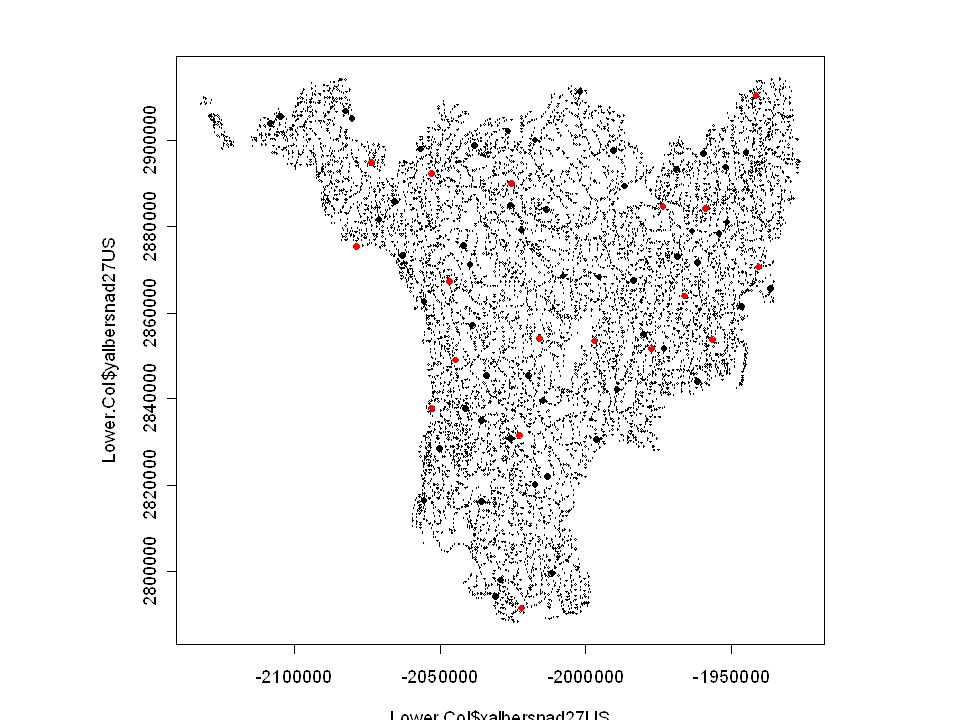
LC Master Sample

29
0123456 Cowlitz106277277942728313132 Lewis961518364213160850 Salmon- Washougal8552311013046220 Willapa548122000 Grays/Eloch oman805631841013260 Number of sites by WRIA and Stream Order

30
Panel 1: 54 status sites (from table 8)
")
31
Panel 2: 18 annual sites (from table 8)
")
32
Lewis: 30 special interest

33
Diagonstic: 30 Germany

34
LCFRB: Habitat Status Monitoring (p. 2) Landscape: Census/complete coverage –Watershed –Uplands/Hill slopes –Wetlands Stream Corridor: Sample survey –Channel Conditions –Riparian zone –Floodplain Water: –Quantity ? –Quality
 Landscape: Census/complete coverage –Watershed –Uplands/Hill slopes –Wetlands Stream Corridor: Sample survey –Channel Conditions –Riparian zone –Floodplain Water: –Quantity . –Quality.")
35
LCFRB: Stratification Scheme Table 6 Ecoregion WRIA Subbasin (different from USGS subbasin?) Physiographic zone (different from ecoregion?) Stream order
 Physiographic zone (different from ecoregion ) Stream order")
36
Salmon Recovery Priority Tiers (p. 24): Some questions Four tiers –Are these mapped? –Can they be identified in the office or field? Tiers as strata? Tier 1 as an index stratum for trend sites?

37
LCFRB: Sample Type (p. 21; table 8) Survey: Status –Master sample Index: Trend –Master sample via an index stratum, e.g., Tier 1 sites Diagnostic –Master sample possible if diagnostic strata can be identified Focal: site specific project evaluation Probability vs. judgmental (or hand selected) sites
 Survey: Status –Master sample Index: Trend –Master sample via an index stratum, e.g., Tier 1 sites Diagnostic –Master sample possible if diagnostic strata can be identified Focal: site specific project evaluation Probability vs. judgmental (or hand selected) sites.")
38
Stream Habitat Sampling Levels: Table 7 (p. 26) Indicator –Remote/office Reconnaissance –On the ground rapid assessment Inventory –Reach/habitat Intensive –Site Concept of Nested samples
 Indicator –Remote/office Reconnaissance –On the ground rapid assessment Inventory –Reach/habitat Intensive –Site Concept of Nested samples.")
39
Landscape Scale Compile at 12 yr intervals Metrics –Road density –Mass wasting –Impervious surfaces –Land use/land cover –Channel migration –Wetland availability –Floodplain connectivity Key question: who will oversee the “collective” landscape data base and its updates? Need to improve the stream network frame –1:100 K NHD+ –1:24 K DNR

40
Utility of a Master Sample An exploratory tool to examine different site allocations easily. A framework for an actual integrated, multi-agency state-wide or regional monitoring program.

42
SITE DEQ ODFW AREMP PIBO

43
Flexibility/Potential Add classification variables by assigning sites to new classes –Requires georeferenced data Facilitates integration across programs –What sites already being monitored by another agency? Encourages: –Communication about monitoring designs among agencies –Development of common databases to share data easily –Agreement on common protocols

44
To Make This Work, We Need: A standard frame that everyone would use, even if imperfect A process for correcting the frame as errors arise (i.e., frame maintenance) Institutional Management –Database Frame and corrections GIS coverages for classification/stratification Monitoring programs: who is doing what where? Monitoring results

45
Phil Larsen: Larsen.phil@epa.gov Tony Olsen: Olsen.tony@epa.gov Don Stevens: Stevens@stat.orst.edu Oregon State University www.epa.gov/nheerl/arm

49
Three Monitoring Scales Landscape Stream Corridor Water

Similar presentations


 Karl M. Polivka, Pacific Northwest Research Station, USDA Forest Service.>")


 and Bill Senior (Qld Environment and.>")


