Download presentation
Presentation is loading. Please wait.

1
Estimating Mean Earthquake Recurrence From Paleoseismic and Historic Data

2
What Do We Need to Know? The Grand Inversion is long-term and time independent. It needs the rate, R, of earthquakes rupturing a place on a fault. This can be thought of as the number of earthquakes, N, during time, T. Then rate is R=N/T. Note that, the Mean Recurrence Interval, MRI = T/N. So MRI = 1/R.

3
Time Independent ≠ Poisson We are integrating over a long time period. We are not looking at the time dependence. But that does not mean we want to use a Poisson fit to the data. We want to estimate the MRI from the distribution that best and most robustly fits the data and provides useful uncertainty limits. Note that uncertainty do not include variability in process that last longer than our observations.

4
Lognormal Distribution Mode of lognormal MRI

5
Simulator Recurrence

6
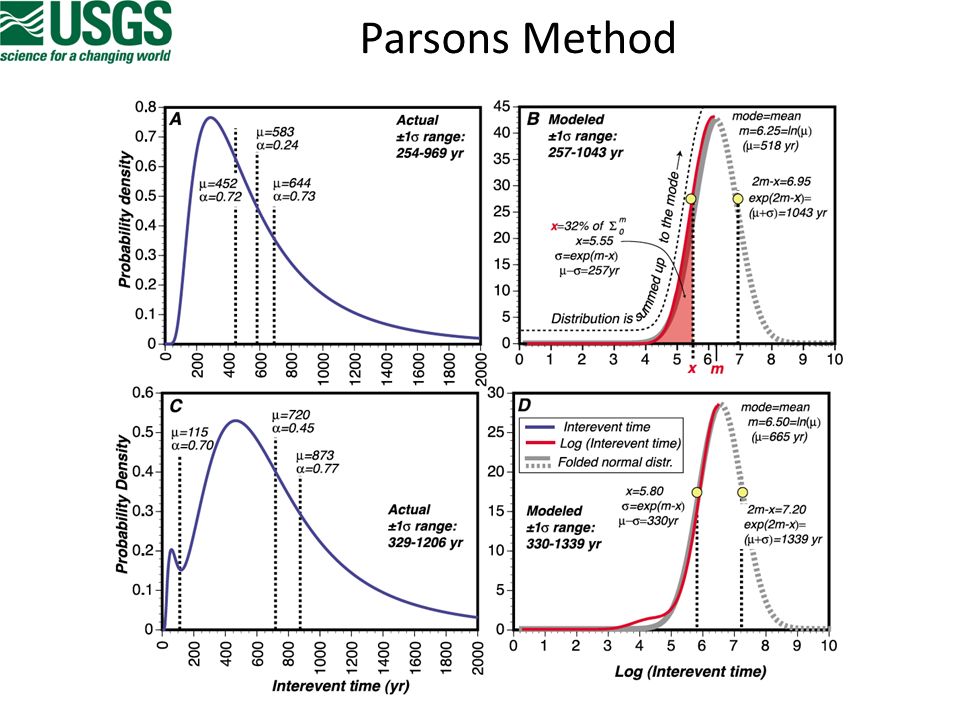
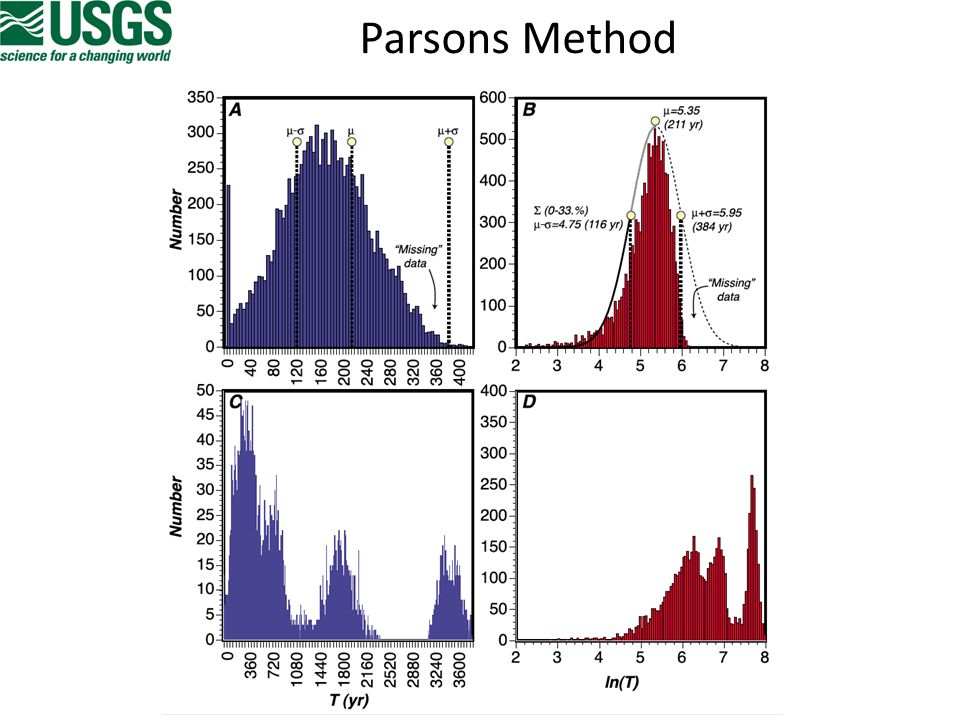
Parsons Method Samples inter-event times from data uncertainty. Creates ten inter-event time distributions with many data. Assumes only that the data have a mode and are symmetric about that mode in log space. Assumes that the mode is the log(MRI). Can’t convert to true MRI without additional assumptions about distribution shape. Computes uncertainty by numerically integrating the distribution in log space at low times. Folds that uncertainty about the mode to get the high limit. Is robust with respect to missing long recurrence intervals and underlying distribution.
. Can’t convert to true MRI without additional assumptions about distribution shape. Computes uncertainty by numerically integrating the distribution in log space at low times. Folds that uncertainty about the mode to get the high limit. Is robust with respect to missing long recurrence intervals and underlying distribution..")
7
Parsons Method

10
Pros: Not distribution specific Issues: But is the mode a good estimate of the mean? Are the quantiles of the data, uncertainty on the mean or variability of the data? Why don’t uncertainties decrease with more data?

11
Biasi Method Samples inter-event times from data uncertainty. Creates many inter-event time distributions with original amount of data. Assumes that the data are lognormal. Uses maximum likelihood to calculate MRI and uncertainty on MRI including the open interval. Averages over the many trials to get final results. Glenn’s tests suggested that missing long intervals were not a problem but tests were not as severe as Tom’s tests.

12
Biasi Draft Issues Did not convert from log mean to MRI Was focused on Poisson analysis. Given 16% and 84% quantiles of values were really 8% and 92%.

13
Biasi Tests Tested maximum likelihood method on lognormal distributions and one multimodal lognormal distribution, but not other distributions. Recovery of MRI is good to within confidence limits. Confidence limits are good but not perfect. Confidence limits do decrease with increasing amount of data. But we did not simulate dating uncertainty.

16
Immediate Recommendations Both methods have strengths and weaknesses, may work better or worse on different sites. If we had adequate data, then we wouldn’t be having this discussion. Use Biasi’s Method with: Lognormal distribution Open Intervals Corrected MRI and uncertainties Realize that confidence intervals are good but not perfect.

17
Longer-Term Recommendations Further explore possible missing data at long recurrence times. Test on simulator data or both methods on same random data. If data have multiple modes, then is there mode-switching? Can Tom’s method be modified to provide better information on MRI and its uncertainty while avoiding additional assumptions about the underlying distribution.

Similar presentations


 of representative samples or strength parameters or slope.>")
 Addictions Department.>")


