Download presentation
Presentation is loading. Please wait.

1
Confidence Interval for a population mean Section 10.1

2
Things to remember: Proportions:Means: np ≥ 10normal if n(1 – p) ≥ 10 population is; CLT Population ≥ 10*n To check for Normal approx.: To check for Independence:
 ≥ 10 population is; CLT Population ≥ 10*n To check for Normal approx.: To check for Independence:")
3
Conditions for constructing a confidence interval The construction of a confidence interval : Data come from an SRS from the population of interest Observations are independent. The sampling distribution is approximately normal

4
Constructing a Confidence Interval Estimate ± margin of error Estimate ± (critical value)(std. dev. of statistic) (statistic)
 (statistic).")
5
Critical Value Depends on: The confidence level (ex. 95% confident) The sampling distribution
 The sampling distribution")
6
Critical Value z* The number z* with probability p lying to its right under the standard normal curve is called the upper p critical value of the standard normal distribution.

7
Example 10.4, pg. 544 Finding z* If we want to find the 80% confidence interval…

8
What is the area just under A? .9000 Look this up in Table A!!!! A

9
What is the area just under A? .9000 Look this up in Table A!!!! z* = 1.28 A

10
Common Confidence Intervals Confidence Level Tail Areaz* 90%0.051.645 95%0.0251.960 99%0.0052.576

11
To construct a Confidence Interval: State – know what parameters we’re estimating & at what confidence level Plan – choose method & check conditions Do – if conditions are met, perform calculations Conclude – interpret the interval in the context of the problem

12
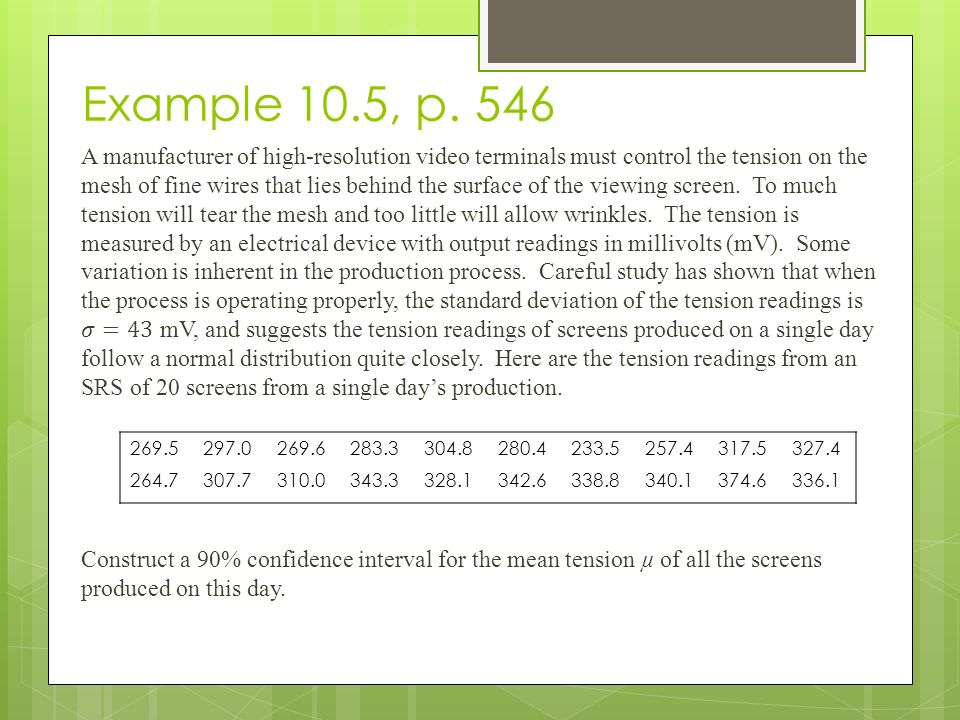
Example 10.5, p. 546 269.5297.0269.6283.3304.8280.4233.5257.4317.5327.4 264.7307.7310.0343.3328.1342.6338.8340.1374.6336.1
13
269.5297.0269.6283.3304.8280.4233.5257.4317.5327.4 264.7307.7310.0343.3328.1342.6338.8340.1374.6336.1

14
269.5297.0269.6283.3304.8280.4233.5257.4317.5327.4 264.7307.7310.0343.3328.1342.6338.8340.1374.6336.1 Yes!

15
269.5297.0269.6283.3304.8280.4233.5257.4317.5327.4 264.7307.7310.0343.3328.1342.6338.8340.1374.6336.1

16
Construct a 90% confidence interval for the mean tension µ of all the screens produced on this day. Conclude – interpret the interval in the context of the problem We are 90% confident that the true mean tension in the entire batch of video terminals produced that day is between 290.5 and 322.1 mV. 269.5297.0269.6283.3304.8280.4233.5257.4317.5327.4 264.7307.7310.0343.3328.1342.6338.8340.1374.6336.1

17
Confidence Level for a Population Mean µ

18
P. 548: 10.5, 10.7 b Due: Wednesday Homework

Similar presentations


 (Small Samples)>")

>")


>")


