Download presentation
Presentation is loading. Please wait.

1
How to kill a galaxy (A review of galaxy properties as a function of environment) Michael Balogh University of Waterloo, Canada (Look for new job postings on AAS)
 Michael Balogh University of Waterloo, Canada (Look for new job postings on AAS)")
2
Collaborators Richard Bower, Simon Morris, Dave Wilman No picture: Vince Eke, Cedric Lacey, Fumiaki Nakata Durham Ivan Baldry & Karl Glazebrook Johns Hopkins Baugh, Cole, Frenk (Durham) Bob Nichol, Chris Miller & Alex Gray Carnegie Mellon John Mulchaey & Gus Oemler OCIW Ray Carlberg Toronto Ian Lewis (Oxford) and the 2dFGRS team No picture: Taddy Kodama
 Bob Nichol, Chris Miller & Alex Gray Carnegie Mellon John Mulchaey & Gus Oemler OCIW Ray Carlberg Toronto Ian Lewis (Oxford) and the 2dFGRS team No picture: Taddy Kodama")
3
Outline 1.Background and motivation 2.Low redshift: SDSS and 2dFGRS 3.Groups and clusters at z~0.5 4.GALFORM predictions 5.Conclusions

4
Outline 1.Background and motivation 2.Low redshift: SDSS and 2dFGRS 3. Groups and clusters at z~0.5 4. GALFORM predictions 5. Conclusions

5
B) External? Hierarchical build-up of structure inhibits star formation A) Internal? i.e. gas consumption and “normal” aging Why Does Star Formation Stop? (Hopkins et al 2004)
.")
6
Galaxy clusters: the end of star formation? “Dead” galaxies (i.e. little gas or star formation) found in rich clusters Hierarchical formation models predict number of clusters increases with time. So perhaps dense environments are responsible for terminating star formation?
 found in rich clusters Hierarchical formation models predict number of clusters increases with time. So perhaps dense environments are responsible for terminating star formation .")
7
Nature or Nurture? Nature? Elliptical galaxies only form in protoclusters at high redshift. Rest of population is due to infall. or Nurture? Galaxy evolution proceeds along a different path within dense environments. –If this is true in groups and clusters, then environment could be the driving force of recent galaxy evolution…

8
Early type galaxies Bower, Lucey & Ellis 1992 Tight colour-magnitude relation (Faber 1973; Visvanathan & Sandage 1977; Terlevich et al. 2001) van Dokkum & Franx 1996: M/L evolution consistent with high formation redshift
 van Dokkum & Franx 1996: M/L evolution consistent with high formation redshift.")
9
E Morphology-Density Relation Dressler 1980 Clusters Field S0 Spirals

10
Morphology-density: evolution Dressler et al. 1997; Couch et al. 1994; 1998 Fasano et al. 2000 Wide field HST: Treu et al. 2003 Log surface density Number of galaxies Redshift N S0 /N E Low redshift Z~0.5

11
HI deficiency Bravo-Alfaro et al. 2000 Davies & Lewis 1973 VLA imaging of Coma spirals Mark I and II imaging of Virgo galaxies 18 nearby clusters: Solanes et al. 2001

12
Emission line fraction in SDSS and 2dFGRS (Balogh et al. 2004) A901/902 supercluster (Gray et al. 2004) correlation with dark matter density Fraction of emission-line galaxies depends strongly on environment, on all scales Trend holds in groups, field, cluster outskirts (Lewis et al. 2002; Gomez et al. 2003) Fraction never reaches 100%, even at lowest densities Star formation Cluster infall regions
 A901/902 supercluster (Gray et al. 2004) correlation with dark matter density Fraction of emission-line galaxies depends strongly on environment, on all scales Trend holds in groups, field, cluster outskirts (Lewis et al. 2002; Gomez et al. 2003) Fraction never reaches 100%, even at lowest densities Star formation Cluster infall regions.")
13
Emission lines Dressler, Thompson & Shectman 1985; Also Gisler 1978 Cluster galaxies of given morphological type show less nebular emission than field galaxies suggests star formation is suppressed in cluster galaxies Emission line fraction

14
H distribution Koopmann & Kenney 2004 also: Vogt et al. 2004 Cluster galaxies often show peculiar distribution of H emission: usually truncated, or globally suppressed In some cases, star formation is centrally enhanced (Moss & Whittle 1993; 2000) Virgo spirals H for Virgo galaxy H for normal galaxy
 Virgo spirals H for Virgo galaxy H for normal galaxy.")
15
Additional physics? Ram-pressure stripping (Gunn & Gott 1972) Collisions / harassment (Moore et al. 1995) “Strangulation” (Larson et al. 1980; Balogh et al. 2000)
 Strangulation (Larson et al. 1980; Balogh et al. 2000).")
16
Additional physics? Ram-pressure stripping (Gunn & Gott 1972) Collisions / harassment (Moore et al. 1995) “Strangulation” (Larson et al. 1980; Balogh et al. 2000) Quilis, Moore & Bower 2000 short timescale Kenney et al. 2003
 Strangulation (Larson et al. 1980; Balogh et al. 2000) Quilis, Moore & Bower 2000 short timescale Kenney et al")
17
Additional physics? Ram-pressure stripping (Gunn & Gott 1972) Collisions / harassment (Moore et al. 1995) “Strangulation” (Larson et al. 1980; Balogh et al. 2000) important in groups? Also tidal effects from LSS? (Gnedin 2003)
 Strangulation (Larson et al. 1980; Balogh et al. 2000) important in groups. Also tidal effects from LSS. (Gnedin 2003).")
18
Additional physics? Ram-pressure stripping (Gunn & Gott 1972) Collisions / harassment (Moore et al. 1995) “Strangulation” (Larson et al. 1980; Balogh et al. 2000) –Either through tidal disruption, or shock-heating to level at which it can’t cool (e.g. Springel & Hernquist 2001) long timescale
 Strangulation (Larson et al. 1980; Balogh et al. 2000) –Either through tidal disruption, or shock-heating to level at which it can’t cool (e.g. Springel & Hernquist 2001) long timescale.")
19
Additional physics? Ram-pressure stripping (Gunn & Gott 1972) Collisions / harassment (Moore et al. 1995) “Strangulation” (Larson et al. 1980; Balogh et al. 2000) –Either through tidal disruption, or shock-heating to level at which it can’t cool (e.g. Springel & Hernquist 2001) long timescale
 Strangulation (Larson et al. 1980; Balogh et al. 2000) –Either through tidal disruption, or shock-heating to level at which it can’t cool (e.g. Springel & Hernquist 2001) long timescale.")
20
Ram pressure stripping of the disk could transform a spiral into a S0 (Gunn & Gott 1972; Solanes & Salvador-Solé 2001) Strangulation may lead to anemic or passive spiral galaxies (Shiyoa et al. 2002) S to S0 transformation? Kenney et al. 2003 Vollmer et al. 2004 Non-SF spiral galaxies from SDSS (Goto et al. 2003) First noted by Poggianti et al. (1999) in z~0.5 clusters
 S to S0 transformation. Kenney et al Vollmer et al Non-SF spiral galaxies from SDSS (Goto et al. 2003) First noted by Poggianti et al. (1999) in z~0.5 clusters.")
21
S to S0 transformation? But bulges of S0 galaxies larger than those of spirals (Dressler 1980; Christlein & Zabludoff 2004) Requires S0 formation preferentially from spirals with large bulges (Larson, Tinsley & Caldwell 1980) perhaps due to extended merger history in dense regions (Balogh et al. 2002) Dressler 1980 Bulge size
 Requires S0 formation preferentially from spirals with large bulges (Larson, Tinsley & Caldwell 1980) perhaps due to extended merger history in dense regions (Balogh et al. 2002) Dressler 1980 Bulge size.")
22
1.S0 galaxies found far from the cluster core –Galaxies well beyond R virial may have already been through cluster core (e.g. Balogh et al. 2000; Mamon et al. 2004; Gill et al. 2004) 2. Morphology-density relation holds equally well for irregular clusters, centrally-concentrated clusters, and groups - but may be able to induce bursts strong enough to consume the gas Gill et al. 2004 Groups (Postman & Geller 1984) Local galaxy density (3d) Spiral fraction Arguments against ram pressure stripping:
 2. Morphology-density relation holds equally well for irregular clusters, centrally-concentrated clusters, and groups - but may be able to induce bursts strong enough to consume the gas Gill et al Groups (Postman & Geller 1984) Local galaxy density (3d) Spiral fraction Arguments against ram pressure stripping:.")
23
Observations: z~0.3 Strangulation model: – infall rate + assumed decay rate of star formation => radial gradient in SFR Radial gradients in CNOC clusters suggest ~2 Gyr Balogh, Navarro & Morris (2000)
")
24
Outline 1.Background and motivation 2.Low redshift: SDSS and 2dFGRS 3.Groups and clusters at z~0.5 4.GALFORM predictions 5.Conclusions

25
Colour-magnitude relation CMR for spiral galaxies also observed (e.g. Chester & Roberts 1964; Visvanathan 1981; Tully, Mould & Aaronson 1982) SDSS allows full distribution to be quantified with high precision ( Baldry et al. 2003; Hogg et al. 2003; Blanton et al. 2003) Sloan DSS data
 SDSS allows full distribution to be quantified with high precision ( Baldry et al. 2003; Hogg et al. 2003; Blanton et al. 2003) Sloan DSS data.")
26
Baldry et al. 2003 (u-r) Analysis of colours in SDSS data: Colour distribution in 0.5 mag bins can be fit with two Gaussians Mean and dispersion of each distribution depends strongly on luminosity Dispersion includes variation in dust, metallicity, SF history, and photometric errors Bimodality exists out to z~1 (Bell et al. 2004) Bright Faint
 Analysis of colours in SDSS data: Colour distribution in 0.5 mag bins can be fit with two Gaussians Mean and dispersion of each distribution depends strongly on luminosity Dispersion includes variation in dust, metallicity, SF history, and photometric errors Bimodality exists out to z~1 (Bell et al. 2004) Bright Faint.")
27
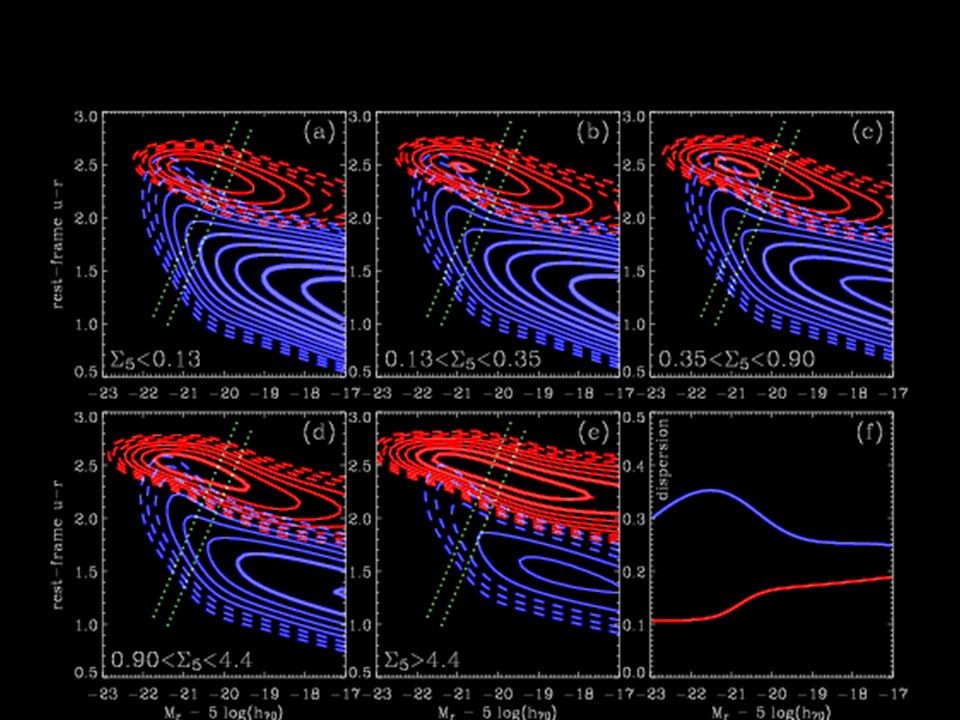
24346 galaxies from SDSS DR1. magnitude limited with z<0.08 density estimates based on M r <-20 Balogh et al. 2004

29
Fraction of red galaxies depends strongly on density. This is the primary influence of environment on the colour distribution. Mean colours depend weakly on environment: transitions between two populations must be rapid (or rare at the present day)
.")
30
How rapid must the blue red transition be? colour evolves rapidly if timescale for star formation to stop is short if transformations occur uniformly in time: need <0.5 Gyr if transformations are more common in the past, longer timescales permitted Blue Peak Red Peak

31
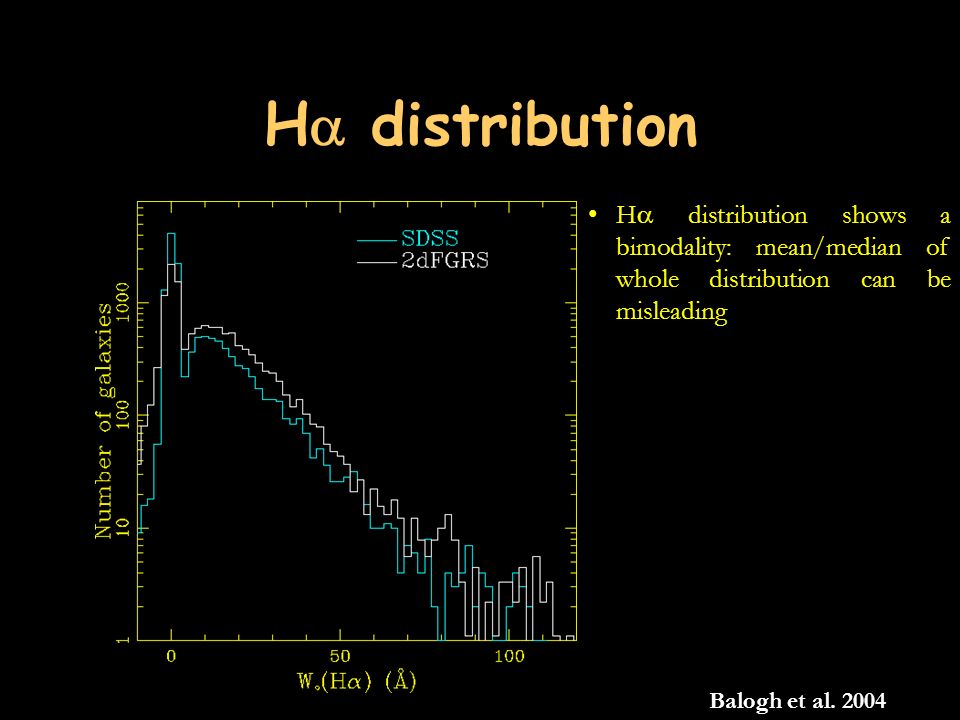
H distribution H distribution shows a bimodality: mean/median of whole distribution can be misleading Balogh et al. 2004
32
The star-forming population Amongst the star- forming population, there is no trend in H distribution with density Hard to explain with simple, slow-decay models (e.g. Balogh et al. 2000)
.")
33
Isolated Galaxies Selection of isolated galaxies: –non-group members, with low densities on 1 and 5.5 Mpc scales ~30% of isolated galaxies show negligible SF –environment must not be only driver of evolution. All galaxies Bright galaxies

34
Summary: SDSS & 2dFGRS SFH depends on environment and galaxy luminosity (mass) in a separable way. Colour and H distributions suggest any transformations must have a short timescale, or have occurred preferentially in the past – but how do you reconcile this with large fraction of Virgo spirals with unusual H distributions? hmmm…

35
Outline 1.Background 2.Low redshift: SDSS and 2dFGRS 3.Groups and clusters at z~0.5 4.GALFORM predictions 5.Conclusions

36
Evolution in clusters and groups Results from low redshift surveys suggests we focus on two separate effects: 1.Evolution in the fraction of active galaxies 2.Evolution in the SFR distribution of those active galaxies Orientation: if environment drives evolution, expect to see weaker evolution in clusters and groups than in isolated galaxies…

37
Butcher-Oemler Effect Andreon, Lobo & Iovino 2004 Concentrated clusters at high redshift may have more blue galaxies than concentrated clusters at low redshift But blue fraction depends strongly on luminosity and radius so care needs to be taken to evaluate blue fraction at same luminosity limit, and within same (appropriate) radius. Margoniner et al. 2001 Redshift Blue fraction

38
M V < -20 High density Low density All galaxies Redshift Red galaxy fraction Evolution of the red sequence (Bell et al 2004) “Butcher-Oemler effect” also seen in the general field
 Butcher-Oemler effect also seen in the general field")
39
Clusters Field 2dF Nakata et al., MNRAS, submitted Postman, Lubin & Oke 2001 van Dokkum et al. 2000 Fisher et al. 1998 Czoske et al. 2001 Cluster SFR evolution Based on sparsely-sampled [OII] spectroscopy Suggests fraction of star-forming galaxies evolves only weakly in clusters Different from colour evolution?

40
Cluster SFR evolution Kodama et al. 2004 Couch et al. 2001 Balogh et al. 2002 Fujita et al. 2003 Tresse et al. 2002 Complete H studies: Even at z=0.5, total SFR in clusters lower than in surrounding field Field z~0.3 z~0.5

41
Cluster SFR evolution Complete H based SFR estimates Evolution in total SFR per cluster not well constrained considerable scatter of unknown origin systematic uncertainties in mass estimates make scaling uncertain Kodama et al. 2004 Finn et al. 2003

42
Cluster SFR evolution Complete H based SFR estimates Evolution in total SFR per cluster not well constrained considerable scatter of unknown origin systematic uncertainties in mass estimates make scaling uncertain Kodama et al. 2004 Finn et al. in prep Finn et al. 2003

43
Evolution in groups z~0.05: 2dFGRS (Eke et al. 2004) –Based on friends-of-friends linking algorithm –calibrated with simulations. Reproduces mean characteristics (e.g. velocity dispersion) of parent dark matter haloes z~0.45: CNOC2 (Carlberg et al. 2001) –selected from redshift survey, 0.3<z<0.55 –Cycle 12 HST imaging + deeper spectroscopy with LDSS2-Magellan
 –Based on friends-of-friends linking algorithm –calibrated with simulations. Reproduces mean characteristics (e.g. velocity dispersion) of parent dark matter haloes z~0.45: CNOC2 (Carlberg et al. 2001) –selected from redshift survey, 0.3<z<0.55 –Cycle 12 HST imaging + deeper spectroscopy with LDSS2-Magellan.")
44
Group comparison Wilman et al. in 2004 Fraction of non-SF galaxies Use [OII] equivalent width to find fraction of galaxies without significant star formation most galaxies in groups at z~0.4 have significant star formation – in contrast with local groups

45
Wilman et al. 2004 Fraction of non-SF galaxies increases with redshift for both groups and field Fraction of non-SF galaxies Groups Group SFR evolution Fraction of non-SF galaxies Field

46
Group SFR evolution Wilman et al. 2004 shape of [OII] distribution evolves with redshift but does not depend on environment Result sensitive to aperture effects

47
Outline 1.Background 2.Low redshift: SDSS and 2dFGRS 3.Groups and clusters at z~0.5 4.GALFORM predictions 5.Conclusions

48
WIP: GALFORM model GALFORM is Durham model of galaxy formation (Cole et al. 2000) –parameters fixed to reproduce global properties of galaxies at z=0 (e.g. luminosity function) and abundance of SCUBA galaxies at high redshift Use mock catalogues of 2dFGRS which include all selection biasses Predict H from Lyman continuum photons, choose dust model to match observed H distribution. This is the weak point at the moment. Assume hot gas is stripped from galaxies when they merge with larger halo (i.e. groups and clusters) which leads to strangulation of SFR (gradual decline)
 –parameters fixed to reproduce global properties of galaxies at z=0 (e.g. luminosity function) and abundance of SCUBA galaxies at high redshift Use mock catalogues of 2dFGRS which include all selection biasses Predict H from Lyman continuum photons, choose dust model to match observed H distribution. This is the weak point at the moment. Assume hot gas is stripped from galaxies when they merge with larger halo (i.e. groups and clusters) which leads to strangulation of SFR (gradual decline).")
49
GALFORM predictions Fraction of SF galaxies declines with increasing density as in data Similar results found by Diaferio et al. (2001; z=0.3 CNOC clusters) and Okamoto et al. (2003; morphology- density relation) Normalisation depends on SFR-H transformation, but trend is robust
 and Okamoto et al. (2003; morphology- density relation) Normalisation depends on SFR-H transformation, but trend is robust.")
50
GALFORM predictions Over most of the density range, correlation between stellar mass and SFR fraction is invariant Therefore SFR-density correlation is due to mass- density correlation At highest densities, models predict fewer SF galaxies at fixed mass due to strangulation Trend with mass driven by selection effects which make analysis difficult

51
GALFORM predictions 1.Fraction of SF galaxies declines with increasing density as in data 2.At low densities, H distribution independent of environment

52
GALFORM predictions 1.Fraction of SF galaxies declines with increasing density as in data 2.At low densities, H distribution independent of environment

53
GALFORM predictions 1.Fraction of SF galaxies declines with increasing density as in data 2.At low densities, H distribution independent of environment 3.In densest environments, H distribution skewed toward low values * This is sensitive to SFR-H transformation however

54
Conclusions On average, galaxies in groups have less star formation than field galaxies Presence of non-star forming galaxies in the lowest densities means environment cannot be the only driver of galaxy evolution Galaxy interactions and mergers: –Build larger bulges in dense environments –Consume available gas in rapid starburst –Present in all environments, but more so at higher densities –Establish red sequence in clusters at early times Strangulation, ram-pressure add additional suppression in dense regions at late times

Similar presentations
To what extent,>")

>")


>")
