Download presentation
Presentation is loading. Please wait.

1
Databanks + New tools = New insights THE AXIOM S imple A tom D epth I ndex C alculator protein fold barcoding CATH – ADAPT…

2
protein foldingBirth of the Earth Digging inside objects to discover their origins SADIC: a new tool to analyze atom depth

3
* Chakravarty S, Varadarajan R. Residue depth: a novel parameter for the analysis of protein structure and stability. Structure Fold Des. 1999 7:723-732 * Pintar A, Carugo O, Pongor S. Atom depth as a descriptor of the protein interior. Biophys J. 2003 84:2553-2561. atom depth calculated as the distance with: the closest external water* the closest dot of the water accessible surface* the closest surface exposed atom* atom depth HEWL 4lzt 2D

4
atom depth 2D Daniele Varrazzo, Andrea Bernini1, Ottavia Spiga, Arianna Ciutti, Stefano Chiellini,Vincenzo Venditti, Luisa Bracci and Neri Niccolai. Three-dimensional Computation of Atomic Depth in Complex Molecular Structures Bioinformatics 2005 21:2856-2860 Calculation of exposed volumes 3D HEWL 4lzt 2D

5
atom depth Calculation of exposed volumes HEWL 4lzt 3D Daniele Varrazzo, Andrea Bernini1, Ottavia Spiga, Arianna Ciutti, Stefano Chiellini,Vincenzo Venditti, Luisa Bracci and Neri Niccolai. Three-dimensional Computation of Atomic Depth in Complex Molecular Structures Bioinformatics 2005 21:2856-2860

6
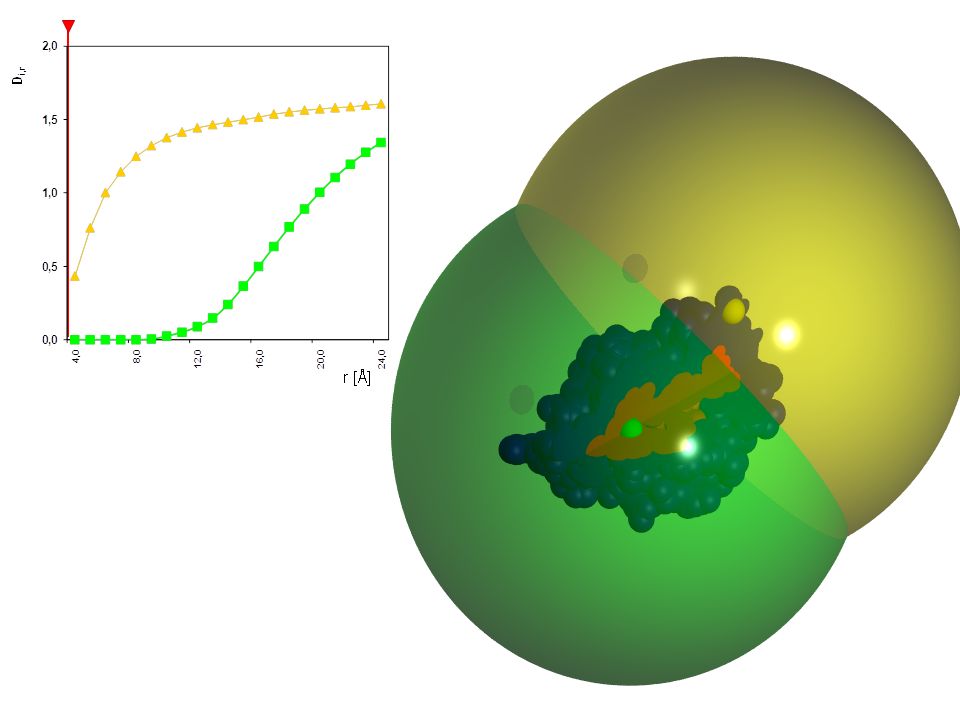
Calculation of exposed volumes Depth index: D i,r = 2V i,r / V 0,r where V i,r is the exposed volume of a sphere of radius r centered on atom i of the molecule and V 0,r is the exposed volume of the same sphere when centered on an isolated atom HEWL 4lzt atom depth 3D Daniele Varrazzo, Andrea Bernini1, Ottavia Spiga, Arianna Ciutti, Stefano Chiellini,Vincenzo Venditti, Luisa Bracci and Neri Niccolai. Three-dimensional Computation of Atomic Depth in Complex Molecular Structures Bioinformatics 2005 21:2856-2860 the sphere radius r should have the biggest value which makes V i = 0 for the most buried atom

8
Thr 47 α carbon D i,9 = 1.59 Ile 58 α carbon D i,9 = 0.13 Trp 28 α carbon D i.9 = 0.03 58 47 28 atom depth 3D vs 2D HEWL 4lzt

9
3D atom depth analysis from PDB ID 1UBQ http://www.sbl.unisi.it/prococoa/ DiDi

10
SBL Bioinformatics Projects Projects SADIC correlated: 1.fold dependent aa compositions of protein cores; 2.towards i-SADIC. ---------------------------------------------------- Projects SADIC uncorrelated: 1.systematic analysis of PPI

11
D i analysis of protein atoms defining strutural layers in protein 3D structures each strutural layer includes atoms with similar D i ’s fast and accurate analysis of aa content of structural layers

12
3 VTR (chitinolytic enzyme 572 aa) D i analysis of protein atoms
 D i analysis of protein atoms")
13
N 0.19 CA 0.30 C 0.25 O 0.23 CB 0.50 CG 0.68 CD 0.91 CE 1.11 NZ 1.29 K63 N 0.38 CA 0.52 C 0.50 O 0.52 CB 0.76 CG 0.95 CD 1.17 OE1 1.24 OE2 1.24 E24 3D atom depth analysis N 0.10 CA 0.05 C 0.11 O 0.18 CB 0.02 CG 0.02 CD1 0.02 CD2 0.00 L43 D imax from PDB ID 1UBQ http://www.sbl.unisi.it/prococoa/

14
D imax analysis of protein residues defining aa occupancy in protein strutural layers each strutural layer includes residues with similar D imax ’s fast and accurate analysis of aa distribution in protein structures

15
D imax analysis of protein singles quite a few proteins like to stay single (at least in the crystalline state) Bioinformatiha 2, Firenze 18 ottobre -9
 Bioinformatiha 2, Firenze 18 ottobre -9")
16
a database of protein singles Experimental Method: X-RAY (79,770) Chain Type: Protein (74,456) Only 1 chain in asym. unit: (28,803) Oligomeric state: 1 (21,193) Number of Entities: 1 (3,517) Homologue Removal @ 95% identity (2,410) 2,410 proteins in the dataset 4,657,574 atoms 589,383 residues DOOPS:
 Oligomeric state: 1 (21,193) Number of Entities: 1 (3,517) Homologue 95% identity (2,410) 2,410 proteins in the dataset 4,657,574 atoms 589,383 residues DOOPS:.")
17
a database of protein singles 2,410 proteins in the dataset 4,657,574 atoms 589,383 residues DOOPS: Swiss-Prot: 540,958 proteins in the dataset (192 Maa) 0 2000 1000
")
18
calculation of % amino acid content in L 0 the first quantitative analysis of a large array of protein cores! D imax analysis of protein cores 2,410 proteins; 4,657,574 atoms; 589,383 residues DOOPS: ~20 % of total molecular volume Σ DOOPS aa(L 0 ) = 106,088 (from 2410 proteins) core aa if D imax < 0.2
 = 106,088 (from 2410 proteins) core aa if D imax < 0.2.")
19
ClassArchitecturesTopology Homologous superfamily Domains 1 (mainly α) 538687537,038 2 (mainly β) 2022952043,881 3 (α & β) 14594111390,029 4 (few sec. str.) 11041182,588 Total 4013132626173,536 D i analysis of protein cores folding clues from aa core composition? :
 ,588 Total ,536 D i analysis of protein cores folding clues from aa core composition. :.")
20
1.101.201.251.502.102.302.402.602.803.103.203.303.403.603.90total Proteins mono 213 (84) 84 (40) 19 (17) 10 (3) 17 (13) 57 (37) 94 (73) 134 (110) 12 (12) 84 (73) 52 (44) 139 (106) 218 203 10 (8) 49 (49) 1,190 (872) ( ) D i analysis of protein cores folding clues from aa core composition? # domain DOOPS + CATH selected Architectures with ≥ 10 PDB files :

21
Cys PDB ID 1UZK(A01) aa % average value (av) av + σ av + 2σ av - σ av - 2σ Towards protein folding barcodes ribbon Leu Phe PDB ID 1RG8(A00) trefoil Val PDB ID 2IMH(A01) four layer sandwich ClassArchitecturesTopology Homologous superfamily 15386875 220229520 3145941113 41104118 Total 4013132626 % L 0 1.101.201.251.502.102.302.402.602.803.103.203.303.403.603.90 overall ALA 13,2810,3221,4612,749,2610,058,439,325,510,6910,0812,5811,8814,9512,01 11.51 ARG 0,61,280,241,3900,641,720,7500,551,111,750,30,470,95 0.83 ASN 0,672,620,732,771,852,041,771,3602,12,90,961,522,82,1 1.70 ASP 1,612,620,242,911,231,272,031,7902,12,93,021,772,340,95 1.77 CYS 3,352,995,370,8322,842,041,464,420,922,832,11,491,861,43,05 2.63 GLN 0,61,50,241,111,231,151,811,6900,461,562,150,991,41,33 1.21 GLU 1,481,440,731,5201,151,191,0400,912,592,411,080,930,67 1.20 GLY 8,058,729,7613,8516,059,9216,210,829,178,7811,8111,3512,6413,089,91 10.81 HIS 1,011,62,441,110,620,760,790,5602,651,963,021,910,472,48 1.32 ILE 12,689,9510,738,596,7913,6110,6810,7813,7612,811,7712,5311,537,0111,34 11.74 LEU 23,8818,3422,4411,778,0217,1812,9713,9833,9416,5411,914,3314,2215,4213,63 16.27 LYS 0,670,9101,1100,380,490,5600,090,621,360,5500,67 0.58 MET 2,624,171,714,9902,82,653,151,832,932,762,412,393,271,91 2.49 PHE 6,446,792,934,574,327,127,066,7315,67,224,956,186,074,216,01 6.36 PRO 1,342,463,412,633,093,3132,7803,292,91,842,251,41,81 2.45 SER 3,494,553,665,963,095,345,565,132,752,835,354,434,236,075,34 4.85 THR 2,284,814,157,25,563,315,124,470,923,25,224,254,945,145,91 4.65 TRP 1,011,5502,773,70,381,632,782,752,191,520,661,260,472,1 1.43 TYR 2,623,690,244,572,471,272,694,380,923,293,121,582,3202,29 2.50 VAL 12,349,689,517,629,8816,2812,7513,5111,9314,5312,8811,716,2919,1615,54 13.7 # PDB 213 (84) 84 (40) 19 (17) 10 (3) 17 (13) 57 (37) 94 (73) 134 (110) 12 (12) 84 (73) 52 (44) 139 (106) 218 203 10 (8) 49 (49) 2,410 D i of 173,536 CATH domains 28 h, 5’ (average comp. time 1.72 s/domain) Calculations performed on 6 cores 990X CPU based computer Ala PDB ID 3CKC(A02) alpha horseshoe CATH-ADAPT CATHa da pt CATH - atom d epth a ssisted protein tomography
 Calculations performed on 6 cores 990X CPU based computer Ala PDB ID 3CKC(A02) alpha horseshoe CATH-ADAPT CATHa da pt CATH - atom d epth a ssisted protein tomography.")
22
Towards protein folding barcodes Putting the protein universe in order

23
Towards protein folding barcodes Putting the protein universe in order

24
towards i-SADIC (implemented SADIC)
")
25
towards i-SADIC (implemented SADIC) H/D exchange rate profiles
 H/D exchange rate profiles")
26
towards i-SADIC (implemented SADIC) H/D exchange rate profiles D D D D D D D D D D D D D D
 H/D exchange rate profiles D D D D D D D D D D D D D D")
27
towards i-SADIC (implemented SADIC) H/D exchange rate profiles
 H/D exchange rate profiles")
28
towards i-SADIC (implemented SADIC) H/D exchange rate profiles
 H/D exchange rate profiles")
29
towards i-SADIC (implemented SADIC) H/D exchange rate profiles
 H/D exchange rate profiles")
30
2D atom depth or 3D atom depth H/D exchange rate profiles data from Pedersen TG, Thomsen NK, Andersen KV, Madsen JC, Poulsen FM. Determination of the rate constants k1 and k2 of the Linderstrom-Lang model for protein amide hydrogen exchange. A study of the individual amides in hen egg-white lysozyme. J Mol Biol. 1993 230(2):651-660. dnw i = or atom distance with the nearest water molecule D i,9 = or atom depth index with a probe od radius 9 Å
: dnw i = or atom distance with the nearest water molecule D i,9 = or atom depth index with a probe od radius 9 Å.")
31
iSADIC atom depth 3D atom depth H/D exchange rate profiles data from Pedersen TG, Thomsen NK, Andersen KV, Madsen JC, Poulsen FM. Determination of the rate constants k1 and k2 of the Linderstrom-Lang model for protein amide hydrogen exchange. A study of the individual amides in hen egg-white lysozyme. J Mol Biol. 1993 230(2):651-660. D i,9 = or atom depth index with a probe od radius 9 Å iD i,9 = aD i,9 + bASA i cD i,9 + dDnw i
: D i,9 = or atom depth index with a probe od radius 9 Å iD i,9 = aD i,9 + bASA i cD i,9 + dDnw i.")
32
iSADIC atom depth 3D atom depth H/D exchange rate profiles iD i,9 = aD i,9 + bASA i cD i,9 + dDnw i

33
protein-protein interface analysis biological vs crystallographic interfaces

34
crystallographic dimers biological dimers

37
vs N ARG CA ARG C ARG O ARG CB ARG CG ARG CD ARG NE ARG CZ ARG NH1 ARG NH2 ARG H ARG HA ARG HB2 ARG HB3 ARG HG2 ARG HG3 ARG HD2 ARG HD3 ARG HE ARG HH11 ARG HH12 ARG HH21 ARG HH22 ARG N LYS CA LYS C LYS O LYS CB LYS CG LYS CD LYS CE LYS NZ LYS H LYS HA LYS HB2 LYS HB3 LYS HG2 LYS HG3 LYS HD2 LYS HD3 LYS HE2 LYS HE3 LYS HZ1 LYS HZ2 LYS HZ3 LYS

Similar presentations


![Review: Amino Acid Side Chains Aliphatic- Ala, Val, Leu, Ile, Gly Polar- Ser, Thr, Cys, Met, [Tyr, Trp] Acidic (and conjugate amide)- Asp, Asn, Glu, Gln.](/15/4531817/big_thumb.jpg "Review: Amino Acid Side Chains Aliphatic- Ala, Val, Leu, Ile, Gly Polar- Ser, Thr, Cys, Met, [Tyr, Trp] Acidic (and conjugate amide)- Asp, Asn, Glu, Gln.>")

 1’ C 5’ PO4 (free) DNA is a linear polymer of nucleotide subunits joined together by phosphodiester bonds - covalent bonds between.>")


 1. insoluble in polar solvents 2. soluble in nonpolar solvents 3. lipids are hydrophobic.>")
