Download presentation
Presentation is loading. Please wait.

1
Region 8 Math Collaborative 2015: Day Two Algebraic Thinking, Patterns, Geometry & Measurement

2
Collecting, Generating, & Representing Data 3 rd Grade: Represent real-world relationships using number pairs in a table and verbal descriptions. Readiness Standard. 4 th Grade: Represent problems using an input-output table and numerical expressions to generate a number pattern that follows a given rule representing the relationship of the values in the resulting sequence and their position in the sequence. 5 th Grade: Generate a numerical pattern when given a rule in the form y=ax or y=x + a and graph. Readiness Standard. (Using whole numbers, decimals and fractions with equal and unequal denominators) 5 th Grade: Graph in the first quadrant of the coordinate plane ordered pairs of numbers arising from mathematical and real-world problems, including those generated by number patterns or found in an input-output table. Readiness Standard.
 5 th Grade: Graph in the first quadrant of the coordinate plane ordered pairs of numbers arising from mathematical and real-world problems, including those generated by number patterns or found in an input-output table. Readiness Standard..")
4
Process Writing Write down a series of steps describing the process for graphing ordered pairs of numbers in the first quadrant of the coordinate plane. Work together with your partner sitting on the same side of the table as you to refine your process description. Agree on a single list of steps. Exchange papers with your table mates and then graph the following ordered pairs following the list of steps given to you. (7,4) (2,5) (4,7) (0,0) (1,6) Discuss the effectiveness of process writing to gain deeper understanding of a mathematical topic. 5 th Grade: Describe the process for graphing ordered pairs of numbers in the first quadrant of the coordinate plane. Supporting Standard.
 (2,5) (4,7) (0,0) (1,6) Discuss the effectiveness of process writing to gain deeper understanding of a mathematical topic. 5 th Grade: Describe the process for graphing ordered pairs of numbers in the first quadrant of the coordinate plane. Supporting Standard..")
5
Rectangular Rugs Using color tiles, build a series of rectangular rugs with a constant width of 4 inches. Record the length and resulting area of each rug using multiple representations: input-output table, input-output table with process column, ordered pairs, graph on coordinate plane. Identify the relationship between the input and output with an expression and with a rule. How would the expression and rule change if the constant width was 7 inches?

6
Rectangular Rugs Using color tiles, build a series of rectangular rugs with a constant width of 4 inches. Record the length and resulting half- perimeter of each rug using multiple representations: input-output table, input- output table with process column, ordered pairs, graph on coordinate plane. Identify the relationship between the input and output with an expression and with a rule. How would the expression and rule change if the constant width was 10 inches?

7
Extreme Outdoors: Zip Line Racing At summer camp teams have divided up to compete in a race that involves running, climbing, and zip lining. Each contestant must run a certain distance to a ladder on a tower that is twice as tall as the distance run, then climb the ladder to a zip line platform where they hook their harness onto the line and return to their starting point to tag the next team member. There are six members on each team. Zip line towers are set up twenty feet apart along a straight line path. Record the distance run and distance climbed by each contestant in a table. Identify the relationship between the input and output with an expression and with a rule. Draw a diagram to represent the race setup. Graph the ordered pairs from the table on a coordinate grid. How would the expression/rule describing the relationship change if the towers were three times taller than the distance run by each consecutive contestant?

8
Party Tables Use a measuring tool to measure the length and width of a single table in the room. Measure to the nearest inch. Record a sketch of the table with its dimensions. Determine the area of the table top using your measurements. Following the pattern of how the tables are pushed together for your group, draw a diagram of more and more tables grouped together. Record the total area of the table top after each new table is added to the group using multiple representations: input-output table, input-output table with process column, ordered pairs, graph on coordinate plane. Identify the relationship between the input and output with an expression and with a rule.

9
Puppy Love Maggie is three years older than Max. Represent the ages of Maggie and Max over time through multiple representations: input-output table, input- output table with process column, and ordered pairs. Identify the relationship between the input and output with an expression and with a rule. Plot the ordered pairs on a coordinate grid. How would the expression or rule change if Maggie had been 5 years older than Max? 10 years older than Max? Maggie Max

10
Yogurt Popsicles Jamie is making homemade yogurt popsicles for Rachel’s first birthday party. The recipe calls for ½ container of serving size yogurt per popsicle. Each attendee will be served one popsicle along with the birthday cake and other party food. Create an input-output table to represent the number of serving size yogurts that Jamie needs to buy to make the popsicles based on the number of attendees at the party. Create a list of number pairs that correspond to the input-output table. Plot the ordered pairs from the table on a coordinate grid. Identify the relationship between the input and output with an expression and with a rule. Use the rule to determine how many yogurts Jamie must buy to make 27 yogurt popsicles.

11
High-rise Housing Use 1-inch cubes to create a “high-rise apartment” structure where the building footprint is a square measuring 3 inches per side. Represent this geometric relationship using an input-output table and a numerical expression that could be used to find the total number of 1-inch cubes that are in the high-rise based on the number of floors in the building. Graph the ordered pairs from the table on a coordinate grid. Use the graph to estimate how many 1- inch cubes would be in a 12-story building. Verify using another method.

12
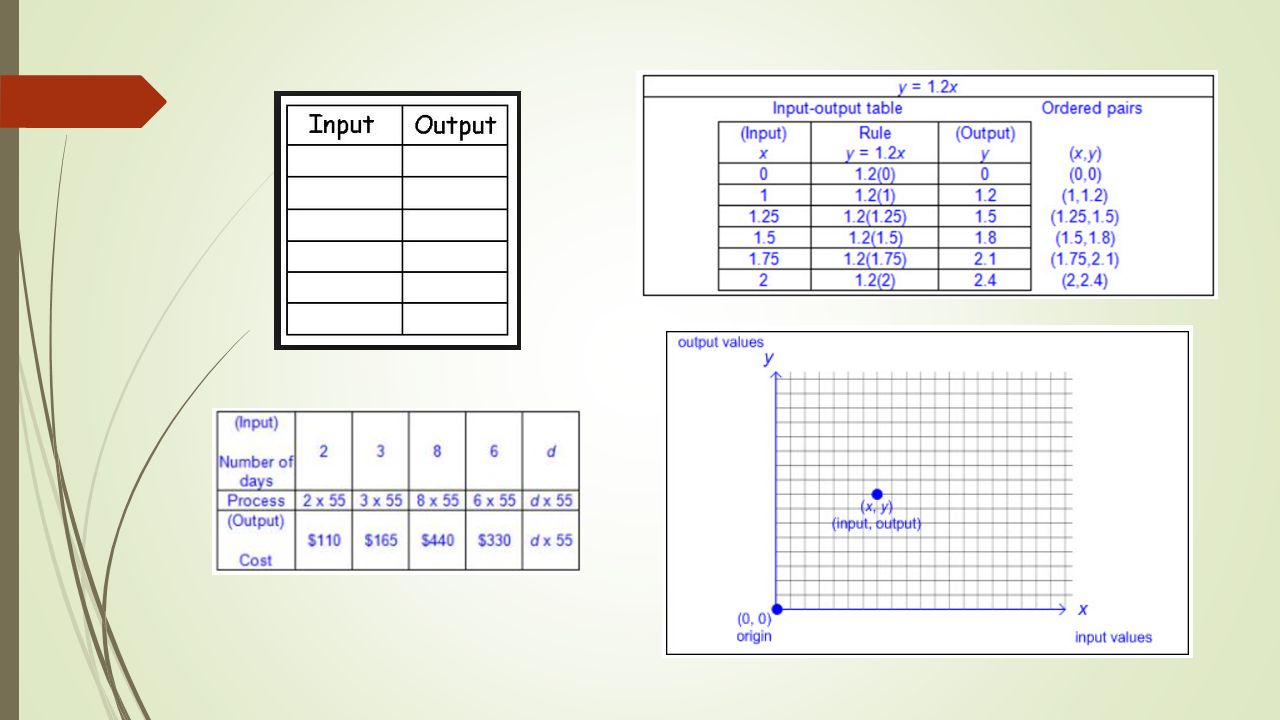
Doggie Daycare A doggy daycare charges $110 for two full days of daycare, $165 for three full days of daycare, $440 for eight full days of daycare, and $330 for six full days of daycare. Represent the situation using an input-output table and a numerical expression that could be used to find the cost of d, the number of full days of daycare. Plot the ordered pairs on a coordinate grid.

13
Polygon Possibilities A quadrilateral is made from at least two triangles, an octagon can be made from at least 6 triangles, a hexagon can be made from at least four triangles, and a nonagon can be made from at least 7 triangles. Represent this geometric relationship using an input-output table and a numerical expression that could be used to find the polygon that can be created from t, the number of triangles. Graph the relationship on a coordinate grid.

14
Summer Job Sara makes $20 for every lawn she mows. Use an input-output table to generate the numerical pattern. Identify the relationship between the input and output with an expression and with a rule. Graph the relationship on a coordinate grid.

15
Bead-Dazzled Sally is making beaded necklaces to sell during the annual Spring Craft Show. She created a table to keep track of the number of beads she used for making her necklaces. If the pattern continues, how many beads will Sally have used to make 7 necklaces?

Similar presentations


 Thirty-two people are coming to the reunion. B) Mrs. Comfort has ordered 8 square.>")


 Patterns, relationships, and algebraic thinking. The student represents a relationship in numerical, geometric, verbal, and symbolic form. The student.>")


 Identify place value.>")
 in Grades K-5?>")


