Download presentation
Presentation is loading. Please wait.

1
Weighting Household Surveys By David F. Pearson, Ph.D., P.E. April 2007

2
Household Surveys in Texas Small sample Stratified by household size and income Telephone recruitment and data retrieval

3
Sampling Plan Samples not proportional to population household distribution Plan uses population household distribution and expected trip making Survey samples weighted for results to represent population

4
Household Weight Based on surveyed households and estimated population of households Computed for each cell in stratification matrix

5
Household Weight Example 4,297 is household population of Size 1 with annual income between 0 and $9,999 48 is number of households surveyed of Size 1 with annual income between 0 and $9,999 89.52 is weight given to each household surveyed 2003 Smith County Household Weight Factors

6
Use of Weights - Examples Estimate population Estimate number of trips by purpose Estimate TLFDs by trip purpose Estimate vehicle availability distribution

7
Use of Weights - Examples Estimate employment, including self- employed individuals Develop household trip rates for use in TDMs Estimate persons by age and sex, including person trip rates

8
Results Dilemma Population estimates did not agree with expected values Population estimates by age and sex did not agree with expected values Employed persons were significantly different than estimates from other sources Concern – Potential bias

9
Revised Approach Develop additional weight based on results from household weights Apply additional weight only to person variables

10
Revised Approach Steps Estimate number of persons by age cohort and gender using household weights Compute person factor based on population of persons by age cohort and gender

11
Calculating Person Weight Factor i-age cohort, e.g., 40-to-44 years of age j-gender, e.g., male or female PW-person weight factor POP-population, i.e., number of persons EST-estimate of number of persons from applying household factor

12
How It Works Household variables weighted using household factor Examples of these variables include: - Number of vehicles available - Household income - Number of bicycles available - Household length of residence

13
How It Works Person variables weighted using household AND person factor Examples of these variables include: - Person trips - Persons licensed to drive - Persons employed (including occupation and industry) occupation and industry) - Student status - Days worked at home
 occupation and industry) - Student status - Days worked at home")
14
Area Characteristics

15
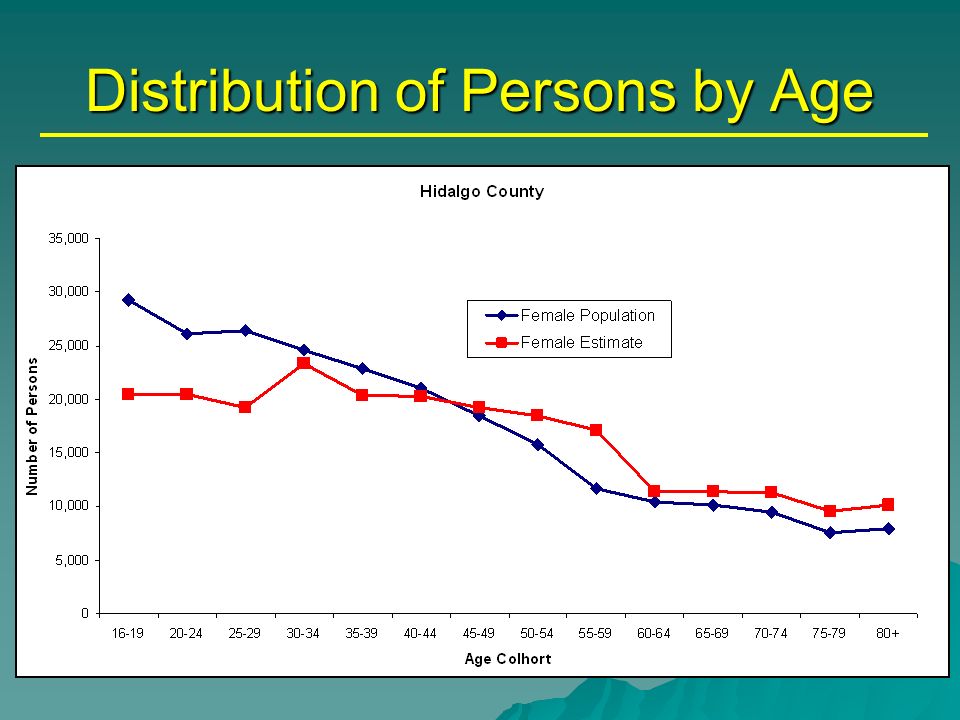
Distribution of Persons by Age

17
Person Trips per Person by Age

18
Distribution of Persons by Age

20
Person Trips per Person by Age

21
Comparison of Estimates Smith County

22
Comparison of Estimates Hidalgo County

23
Comparison of Trip Estimates Smith County

24
Comparison of Trip Estimates Hidalgo County

25
Employment Estimate Comparisons

26
Findings Use of two-stage weighting procedure – Improves estimates of HBW travel – Improves estimates of employed persons in area

27
Questions

Similar presentations


 K. Kromer Baker 1, A. T. Onaka 1, B. Horiuchi.>")


 Betty C. Jung, RN, MPH, CHES.>")
