Download presentation
Presentation is loading. Please wait.

1
財務報表分析 Financial Statements Analysis

3
Financial Statements Balance Sheet Income Statement The Statement of Cash Flow

5
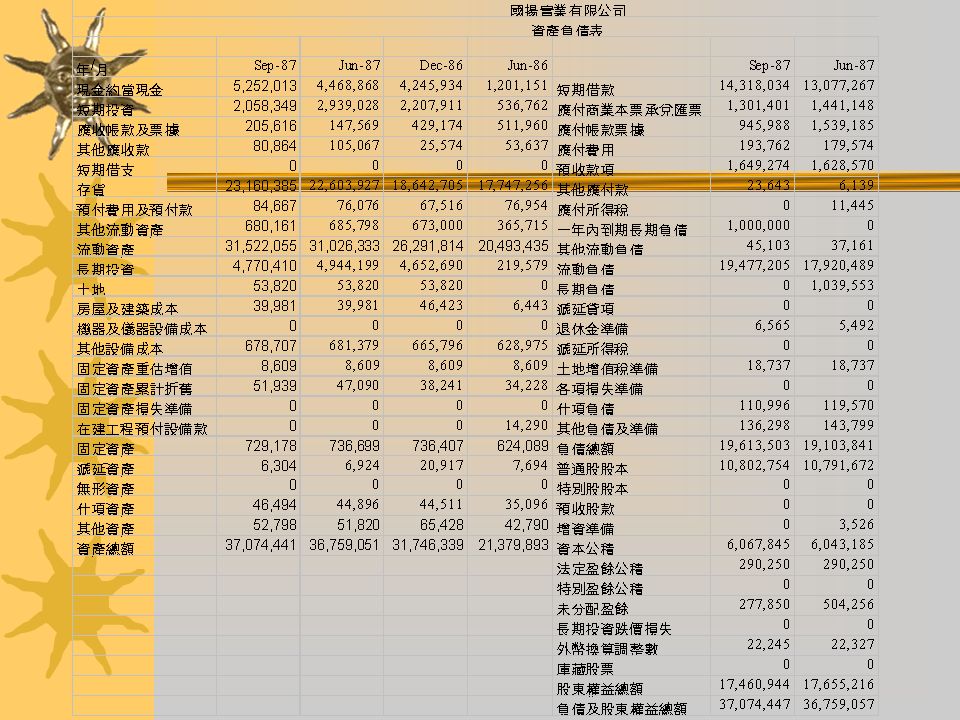
Balance sheet Assets = Liability + Equity Current assets –Cash, bills, and currency –Marketable securities –Accounts receivable –Inventories Plant assets –Gross plant and equipment gross plant assets –Accumulated depreciation –Net plant and equipment Intangible assets

6
Liabilities Current liabilities –Accounts payable –Wages and salaries payable –Current portion of long-term indebtedness –Short term bank loans Long-term liabilities –Notes and bonds –Capital lease –Deferred taxes:

7
Equity Book value of equity Par value Additional paid-in-capital Treasury stock Retained earnings

8
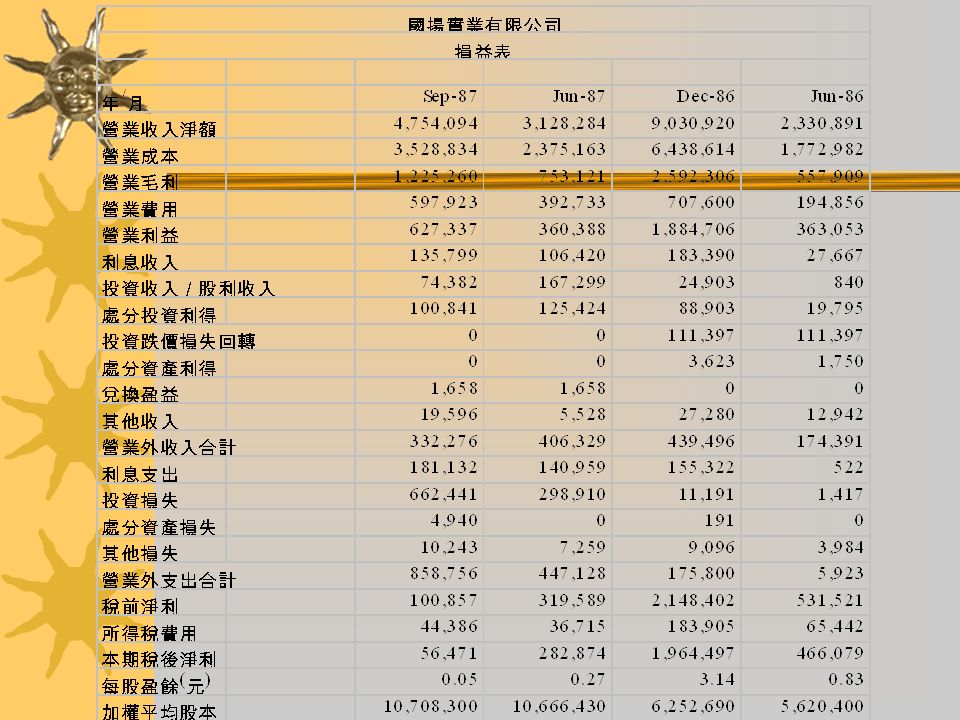
The income statement Revenues - Expenses = Income Sales or revenues Cost of goods sold Gross profit Operating profit Net income Earning available to common shareholders

10
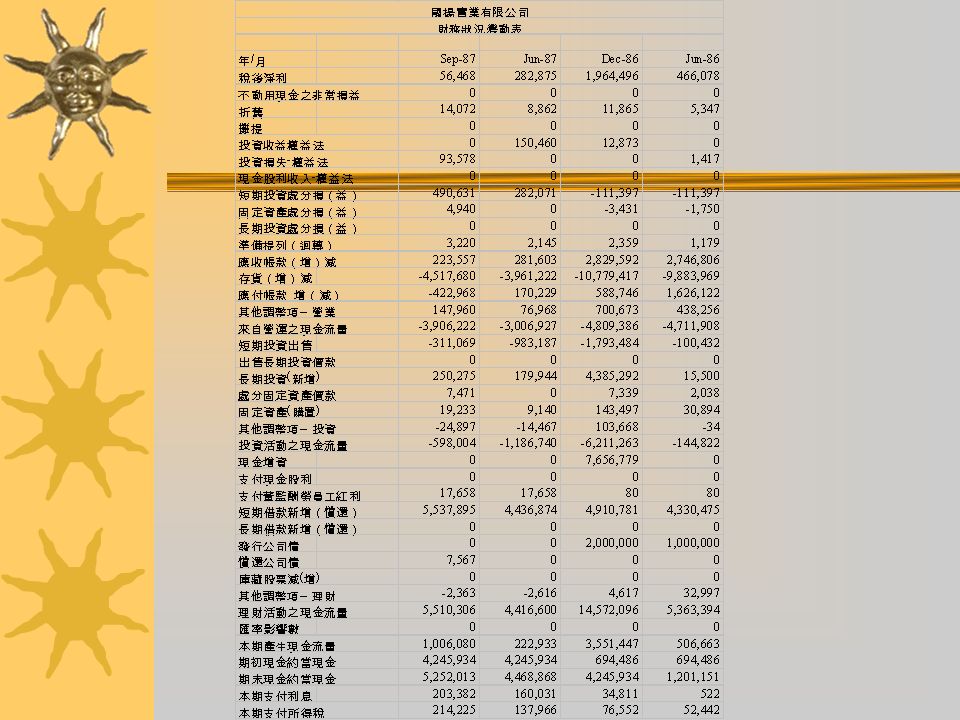
The statement of cash flows Cash flow from operating activities Cash flow from investing and financing activities

11
The Sources and Uses of Cash SourcesUses Decrease in nay assetIncrease in any asset Increase in any liabilityDecrease in any liability Net profit after taxesNet loss Sales of stockDividends paid Depreciation and otherRepurchase or retirement of stock noncash charge

13
Book Value vs. Market Value Book Value Market Value

14
ACCOUNTING v.s. FINANCIAL MANAGEMENT ACCOUNTING FINANCIAL MANAGEMENT

15
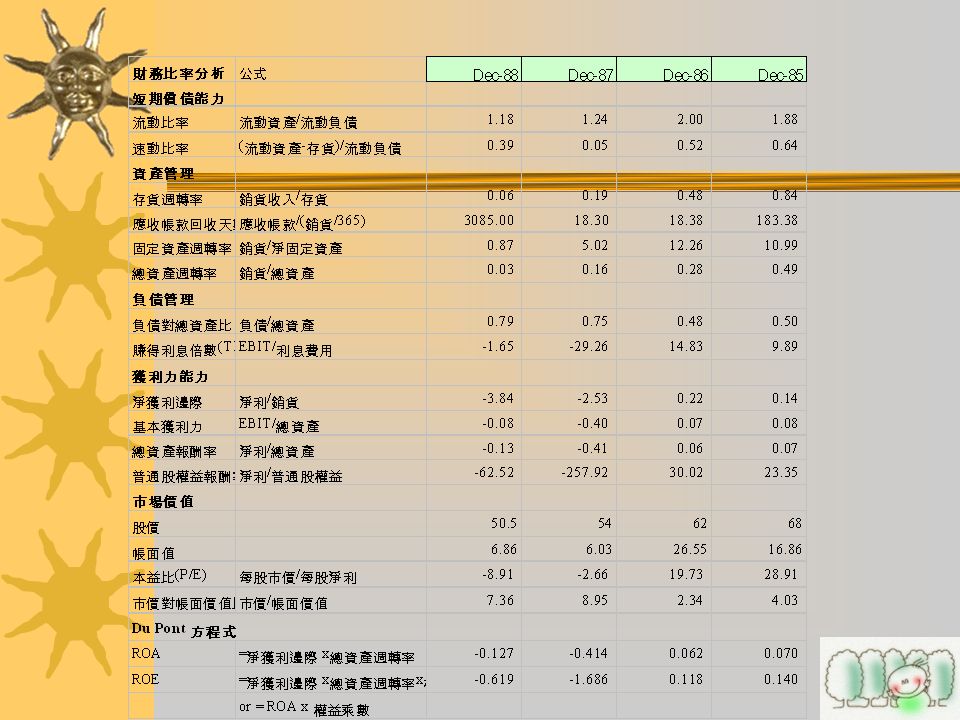
Financial ratio analysis Financial ratio analysis involves methods of calculating and interpreting financial ratios in order to assess a firm’s performance or status.

16
Steps 1. What is the definition? 2. How to calculate? 3. Is the number food or bad? Time-series analysis Cross-sectional analysis 4. Why? 5. What to do?

17
Financial Ratios Liquidity Asset Management Debt Management Profitability Market value

19
Liquidity Current ratio: current assets/current liabilities Quick ratio(acid-test): (current assets- inventories)/current liabilities
: (current assets- inventories)/current liabilities")
20
Asset Management Inventory turnover:sales/inventories Days sales outstanding:receivables/(daily sales) Fixed assets turnover:sales/net fixed assets Total assets turnover:sales/total assets
 Fixed assets turnover:sales/net fixed assets Total assets turnover:sales/total assets")
21
Debt Management Total debt to total assets:total debts/total assets Times-interest-earned (TIE):EBIT/interest charges
:EBIT/interest charges")
22
Profitability Profit margin on sales:net income available to common stockholders/sales Basic earning power (BEP):EBIT/total assets Return on total assets (ROA):net income available to common stockholders/total assets Return on common equity (ROE):net income available to common stockholders/common equity
:EBIT/total assets Return on total assets (ROA):net income available to common stockholders/total assets Return on common equity (ROE):net income available to common stockholders/common equity")
23
Market value Price/earnings (P/E):price per share/earnings per share Market/book (M/B):market price per share/book value per share
:price per share/earnings per share Market/book (M/B):market price per share/book value per share")
24
Du Pont Equation ROA=profit margin x total assets turnover ROE=profit margin x total assets turnover x equity multiplier or = ROA x Equity Multiplier

Similar presentations


 OPERATING INCOME (EBIT) - Interest.>")


 Company Address : Hutan Simpan Ayer Hitam, 47100 Puchong, Selangor Type of Company.>")