Download presentation
Presentation is loading. Please wait.

1
Capitalization of R&D in the national accounts of Israel

2
The exercise performed to test: Feasibility of using existing R&D statistics as a basis for estimates of R&D assets in national accounts. Implementation of recommendations developed in the framework of the work of the Canberra II group during the last 4 years. Examination of the impact of R&D capitalization on the main national accounts aggregates.

3
Bridge tables between R&D statistics and national accounts Bridging values needed: Acquisition of “extramural” R&D to be used as input in R&D production Consumption of fixed capital owned by R&D producers and used in R&D production Net operating surplus Other taxes on production less other subsidies on production

4
Table 1. Summary of simplified bridge table results for Israel

5
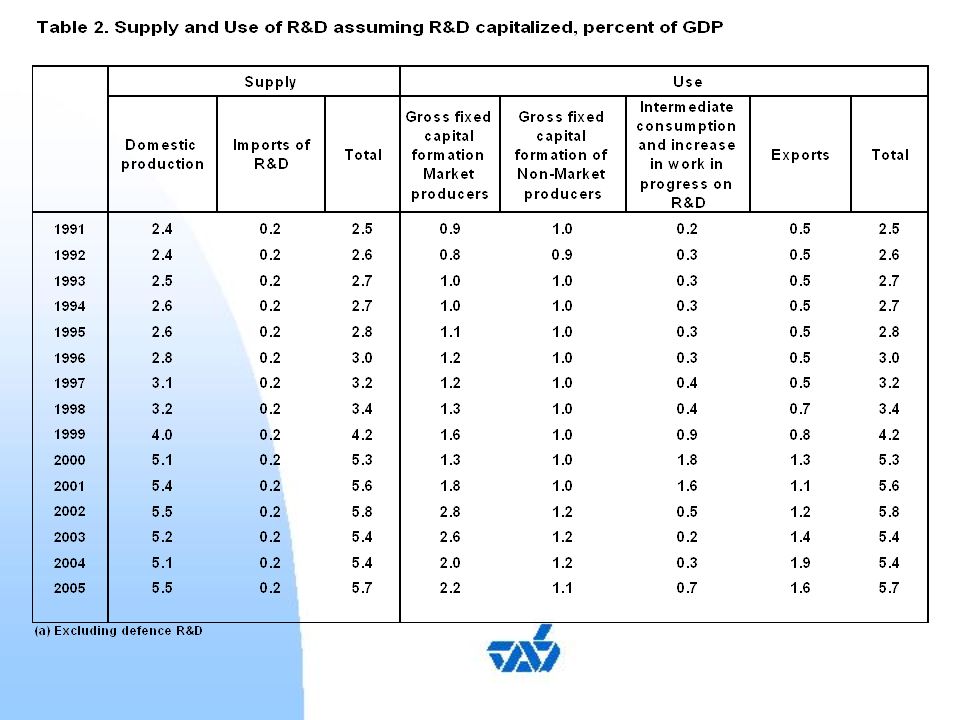
Estimates of R&D capital formation Supply and use of R&D output using the data from bridge tables. Distinction between market and non- market R&D. Separation of exports and imports of R&D proved to be important. Constant price estimates prepared in satellite accounts since 1989.

6
Estimates of R&D capital formation (contd.) Time lag between the start of R&D projects and the use of the finalized R&D - gestation lag and application lag – assumed to be 2 years, basing on venture capital funds sources. Unfinished R&D defined as stocks of work in progress, considering the high share of R&D exports in Israel.

8
Uses of R&D at 2000 prices

9
Estimates of service lives of R&D Original intention to estimate service lives of R&D in Israel using existing panel data was abandoned due to lack of some important variables. Instead, an average depreciation rate of 0.15, derived from the paper by Ballester, Garcia-Ayuso, Livnat (2000). In future work it will be necessary to improve the service life estimates, i.a., by performing industry depreciation rates.
. In future work it will be necessary to improve the service life estimates, i.a., by performing industry depreciation rates..")
10
Estimates of R&D capital stocks

11
Net impact of capitalization of market R&D on GDP

12
Net impact of capitalization of market and non-market R&D on GDP

13
Capital formation compared to depreciation Net GFCF obtained is continuously positive, since the depreciation is lower than the fixed capital formation in most years, due to relatively fast growth of the GFCF over the years. However, the actual impact of R&D capitalization on NDP and NNI is different, since other changes to registration of output for final use have also been made.

14
Net fixed capital formation in R&D compared to NNI at market prices

15
Conclusions from the exercise Feasible to integrate R&D statistics in national accounts, and obtain R&D capital formation and stocks. The impact of capitalizing market R&D amounts to about 1.5% of GDP The impact of non-market R&D is also significant - about 1.0% of GDP.

16
Conclusions from the exercise (contd.) The treatment of non-market R&D in this way is consistent with the treatment of roads and other infrastructure in the current SNA. However, it is important to show such R&D separately, since it is used by other sectors. Although the individual use mostly can not be identified, the scope of non- market R&D used by the economy as a whole is of importance.

17
Conclusions from the exercise (contd.) The compilation of bridge tables and R&D capitalization process would very likely lead to an improvement of R&D estimates in the national accounts. Improvement seems to be necessary, whether R&D is capitalized or not. There is a need for separate R&D accounts of a good quality in the SNA framework for economic analysis's and decisions.

Similar presentations