Download presentation
Presentation is loading. Please wait.

1
Chapter 3 Infrared Spectroscopy Each interatomic bond may vibrate in several different motions (stretching or bending) - vibrational, rotational energy level Absorption of radiation by a typical organic molecule results in the excitation of vibrational, rotational and bending modes would be between 0.75 – 200 μ, or infrared region
 - vibrational, rotational energy level Absorption of radiation by a typical organic molecule results in the excitation of vibrational, rotational and bending modes would be between 0.75 – 200 μ, or infrared region")
2
IR Theory & Principles IR energy lower than visible

3
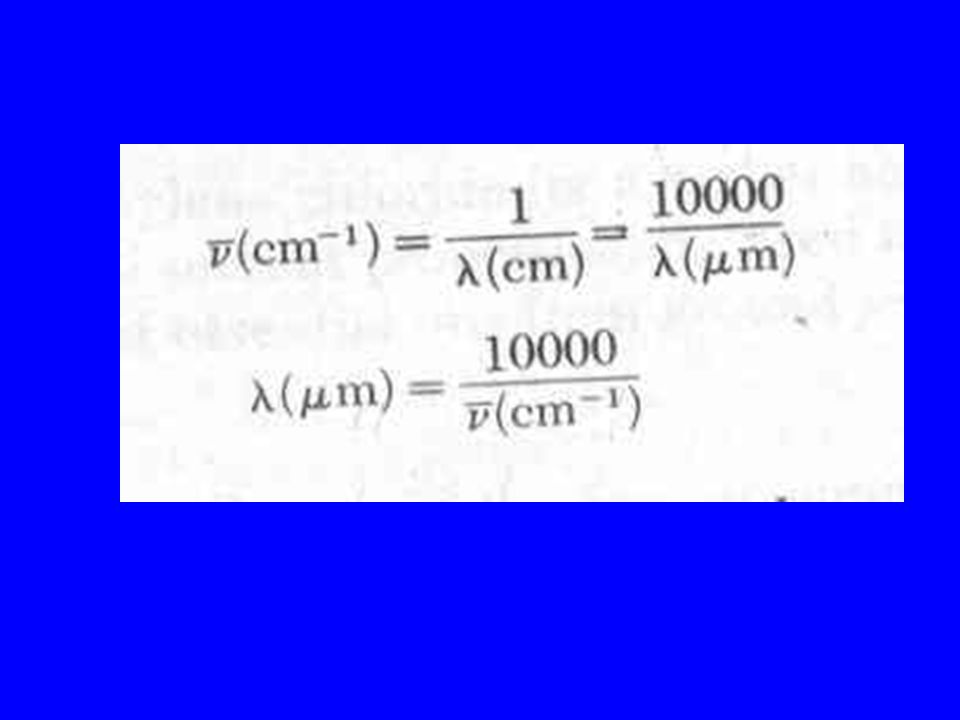
Infrared Region Near IR 0.75 ~ 2.5 μ (12820 – 4000 cm -1 ) reciprocal centimeters, cycle per cm, wavenumber IR 2.5 ~ 25 μ (4000 – 400 cm -1 ) Useful region for organic analysis Far IR 25 ~ 1000 μ (400 – 10 cm -1 )
 reciprocal centimeters, cycle per cm, wavenumber IR 2.5 ~ 25 μ (4000 – 400 cm -1 ) Useful region for organic analysis Far IR 25 ~ 1000 μ (400 – 10 cm -1 )")
5
Infrared energy absorbed as vibrations of polar molecules (thermal energy) when sample is placed in IR beam -
 when sample is placed in IR beam -")
6
Vibration frequencies are quantized and depend on atom masses, bond strengths, and change in dipole.

7
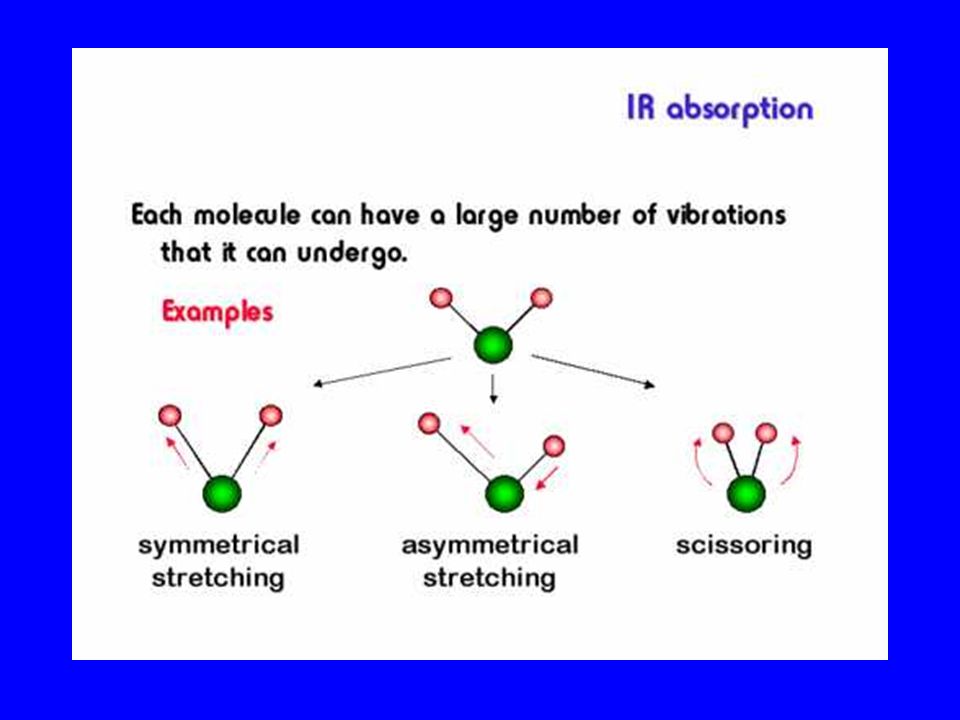
Stretching Bending Twisting Wagging Rocking Vibration Motions can be Symmetric Asymmetric can be

9
Spectrum is transmission of IR light plotted against frequency in wavenumbers (cm -1 ).
.")
10
Structural Information from IR Good for confirming certain functional groups - especially: -O-H C=O -C N and C C Not good for carbon backbone. Intensities vary so not normally quantitative. electronegativity, vibration mode, conjugation, etc NOT GREAT FOR FIGURING OUT STRUCTURE USED FOR VERIFYING OR ELIMINATING POSSIBLE STRUCTURES.

13
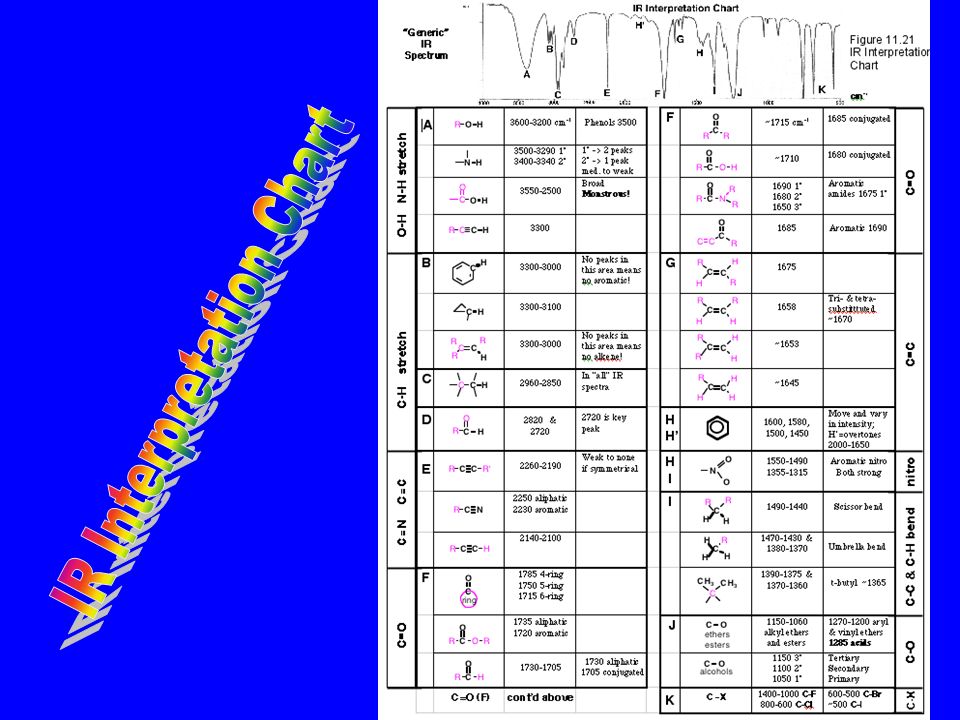
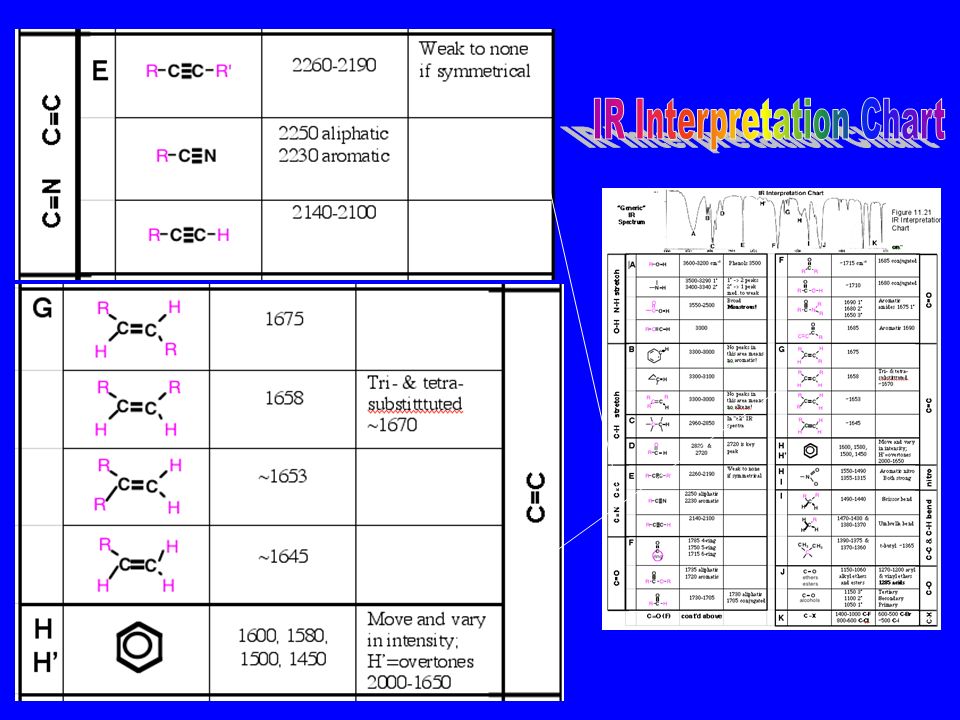
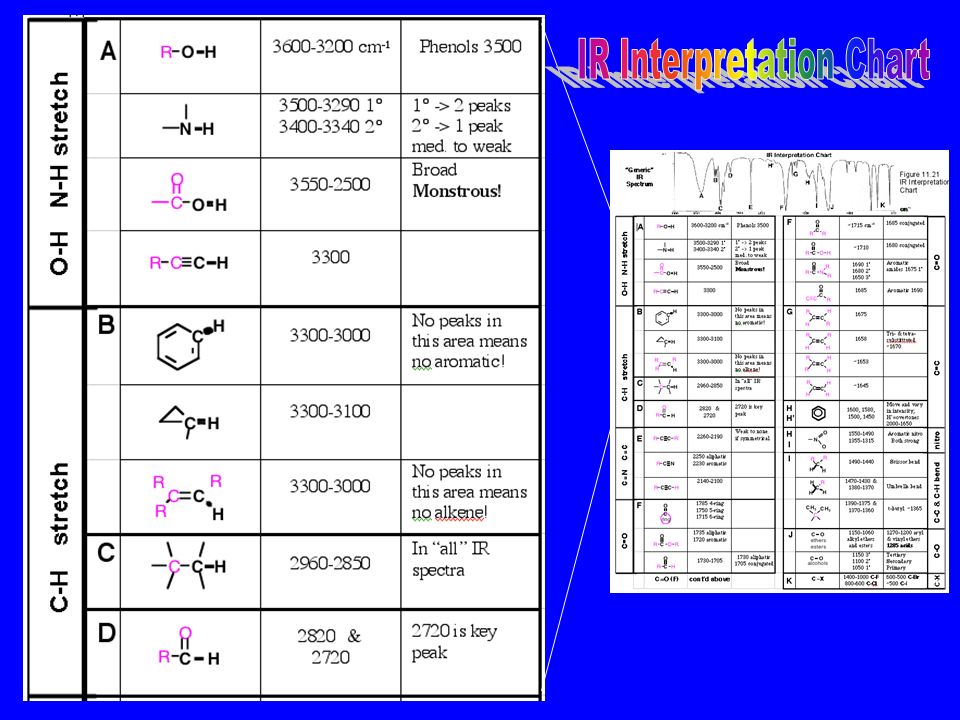
IR Interpretation Chart

14
2.2 Structural Group Analysis Extensive correlations exist between absorption peak positions and structural units of organic molecules stretching (υ) and bending (δ, γ)
 and bending (δ, γ)")
15
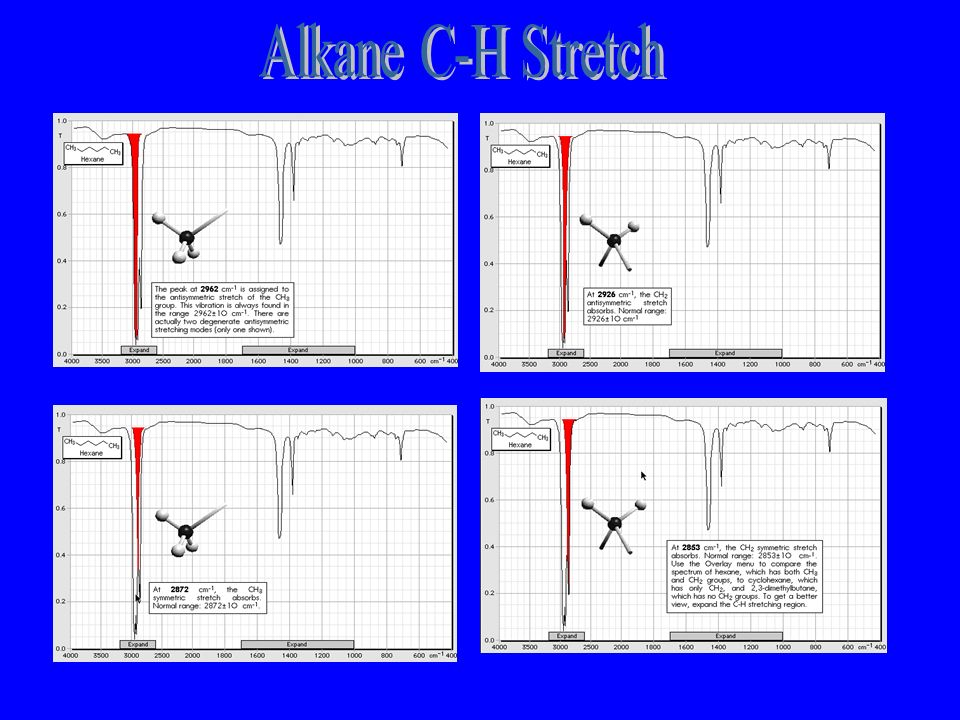
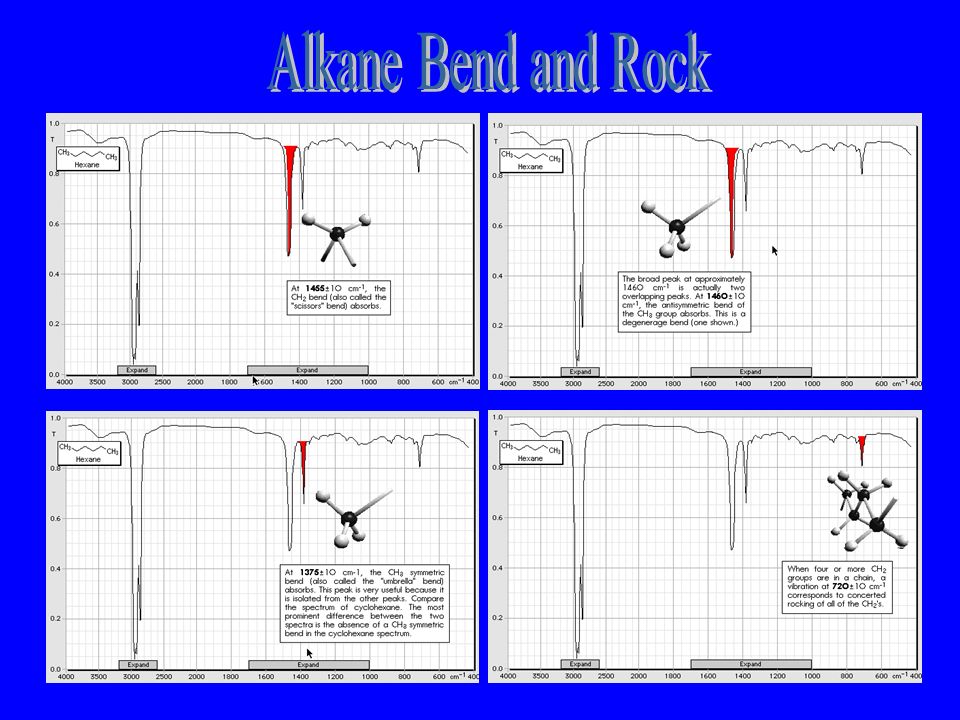
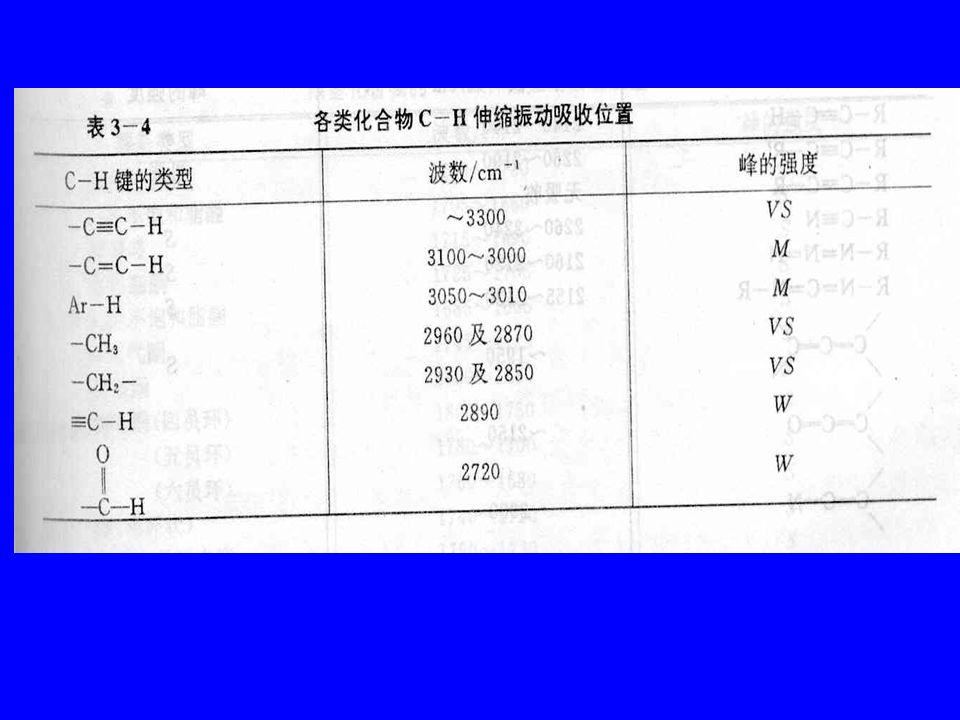
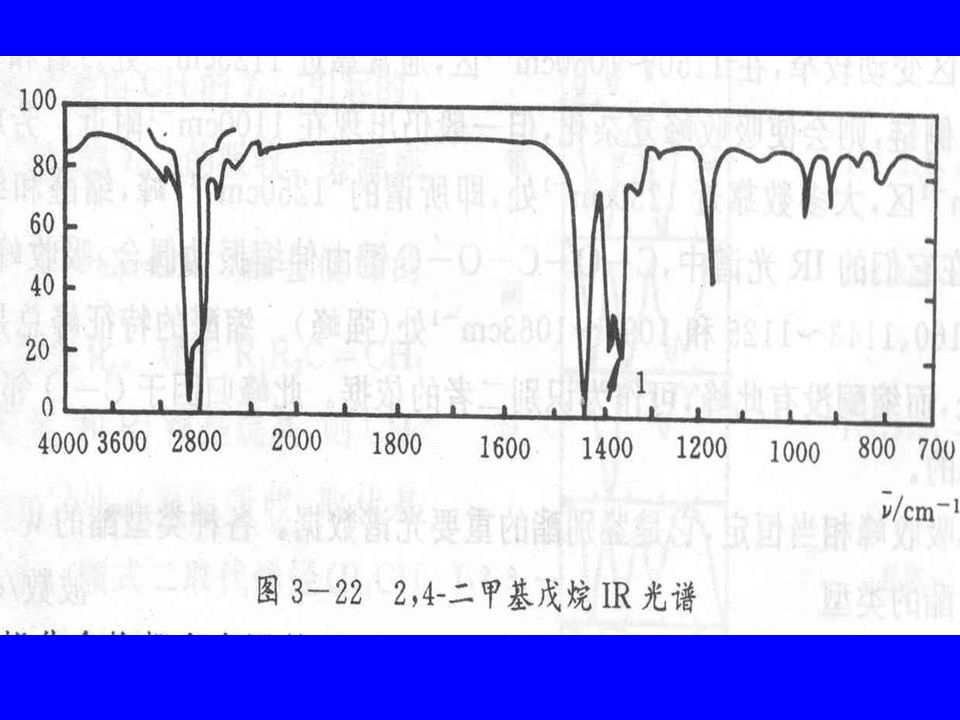
Alkanes (1) The most prominent peaks in IR spectra of saturated hydrocarbons are due to C-H stretching and bending. 1. υ C-H appears in 2975 to 2845 cm -1 regions, it’s due to symmetric and asymmetric stretching vibration of CH 3, CH 2 and CH groups. They can be applied to identify alkanes (< 3000 cm -1 ) from unsaturated compounds
 from unsaturated compounds.")
17
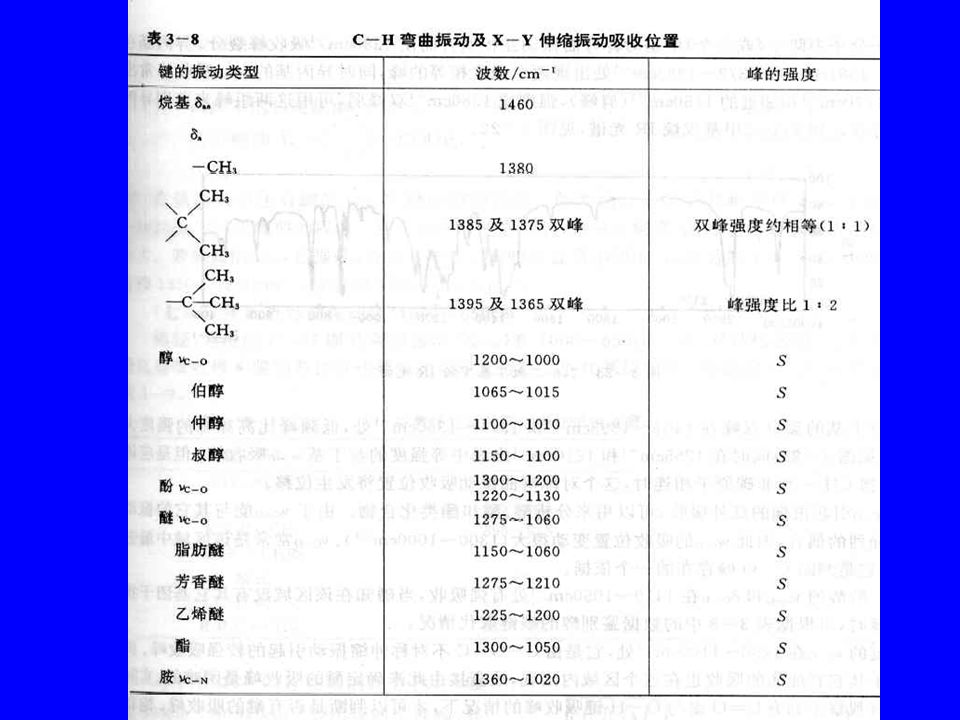
Alkanes (2) 2. δ C-H appears in ~1460 and ~1380 cm -1. The first one is attribute to δ as of CH 3 and CH 2, the later is due to δ s of C-H of CH 3. δ s is an evidence of the existence of CH 3 in unknown compound. The exact positions of these as well as the stretching frequencies depend upon the nature of adjacent atoms.

19
Alkanes (3) υ c-c are within 1250 ~ 800 cm -1, and are weak peaks. Usually they are not specific for compounds and can not be used in IR analysis.

20
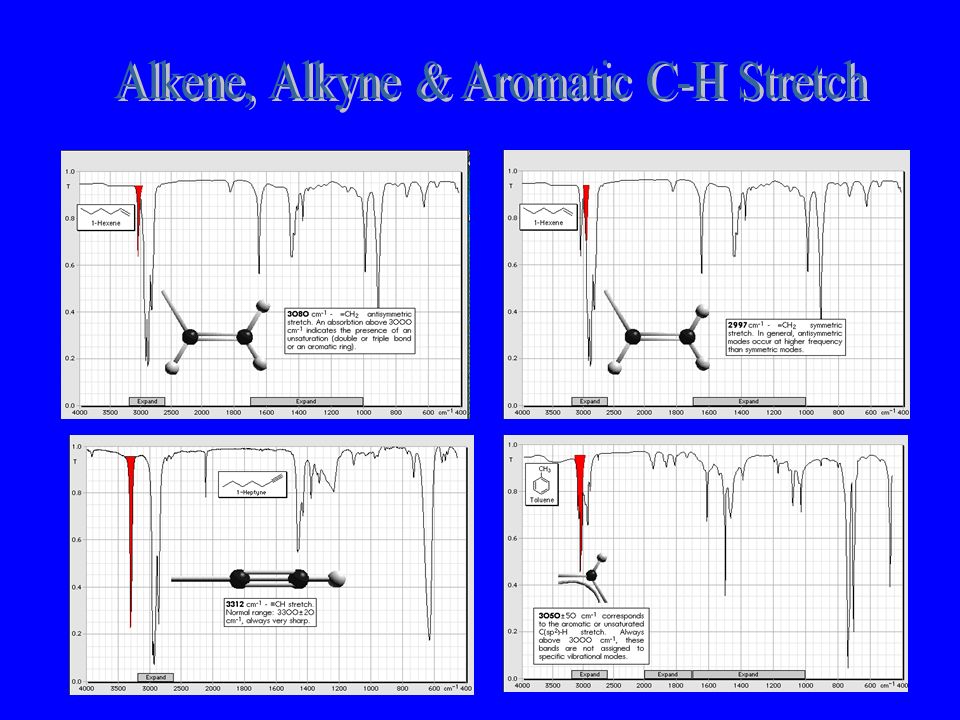
Alkenes (1) The big difference of IR spectra between alkanes and alkenes are due to the vibration of =C-H and C-C. The specific peaks of Olefin are: 1. υ C=C-H generally appear in the region 3100 to 3000 cm -1, thus differentiating saturated and unsaturated hydrocarbons.

22
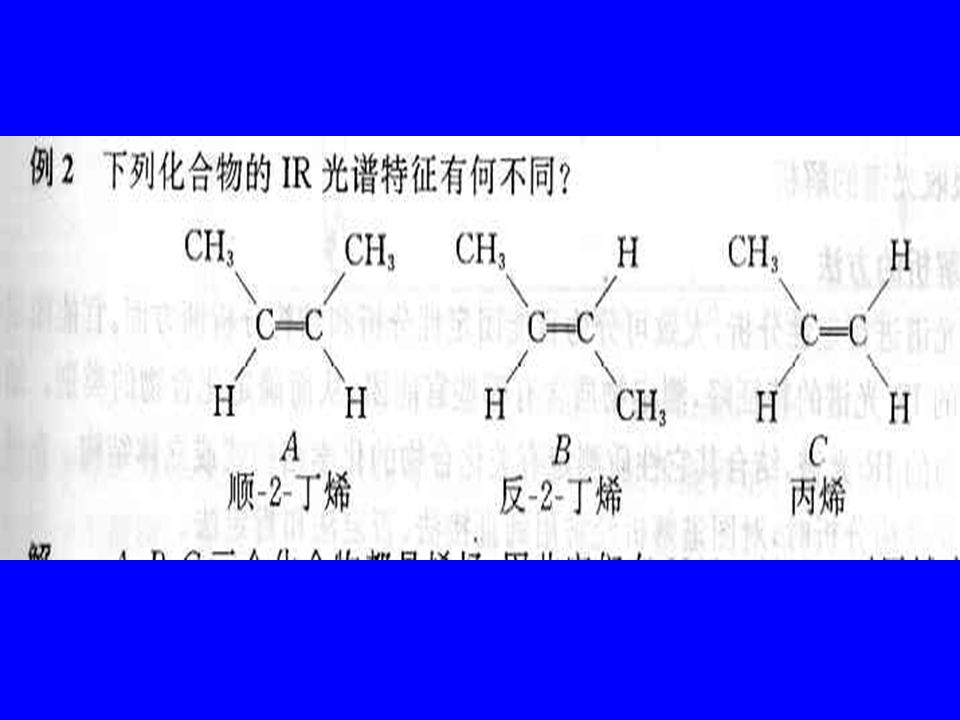
Alkenes (2) 2. The out-of-plane bending vibrations in the 1000 to 650 cm -1 region γ C=C-H are often useful in predicting the substitution pattern of the double bond.

23
Olefinic C-H out-of-plane bending frequencies OlefinFrequency range (cm -1 ) R-CH=CH 2 1000-960 and 940-900 R 2 C=CH 2 915-870 Trans-RCH=CHR990-940 cis-RCH=CHR790-650 R 2 C=CHR850-790
 R-CH=CH and R 2 C=CH Trans-RCH=CHR cis-RCH=CHR R 2 C=CHR")
25
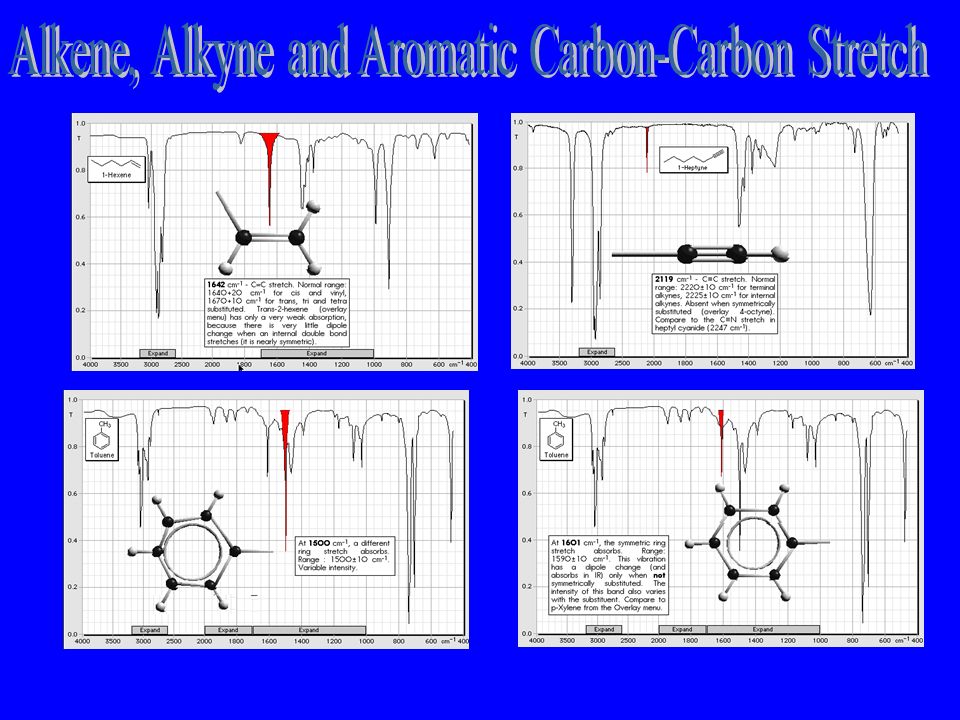
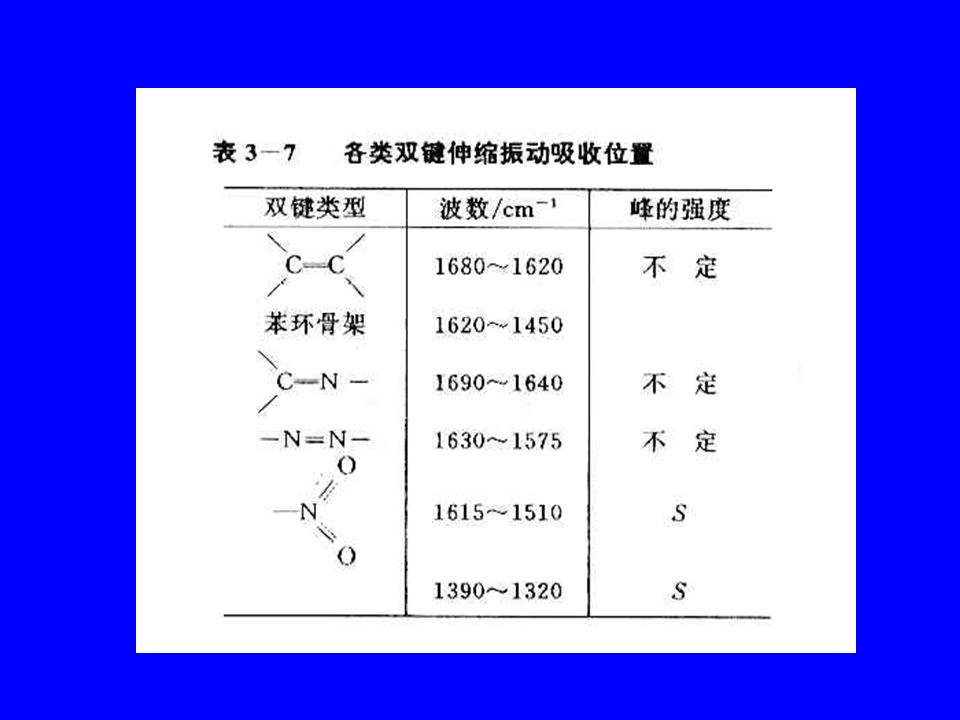
Alkenes (3) 3. The C=C stretching frequency υ C=C in the 1600 to 1675 cm -1 region also varies with substitution but to a lesser degree

28
Alkynes (1) It’s not difficult to distinguish alkynes from IR spectra based on the following specific band: 1. The C-H stretching vibration of terminal acetyenes (ν C≡C-H )generally appears at 3300 to 3100 cm -1 as a strong sharp band. The peak of ν N-H is also in this region, but can be recognized with its broad band
generally appears at 3300 to 3100 cm -1 as a strong sharp band. The peak of ν N-H is also in this region, but can be recognized with its broad band.")
30
Alkynes (2) 2. The C≡C stretching band is found in the region 2150 to 2100 cm -1 if the alkyne is monosubstituted and at 2270 to 2150 cm -1 if disubstituted. The latter are usually quite weak absorptions

32
Alkynes (3) The C≡C-H out-of-plane bending vibration (γ C≡C-H ) is found in the region 680 to 610 cm -1
 The C≡C-H out-of-plane bending vibration (γ C≡C-H ) is found in the region 680 to 610 cm -1")
33
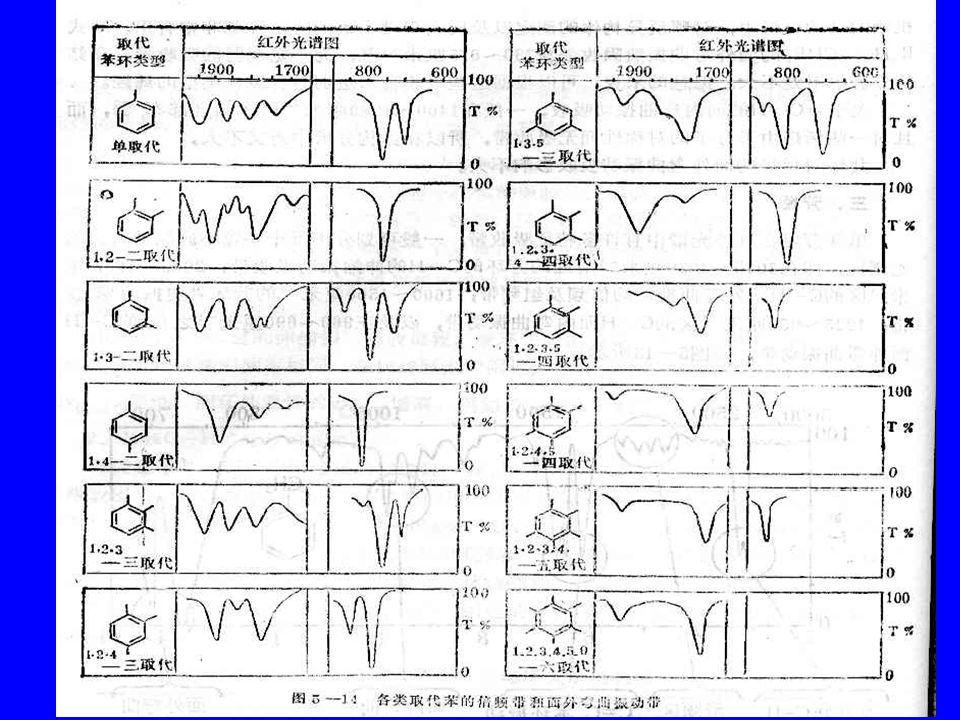
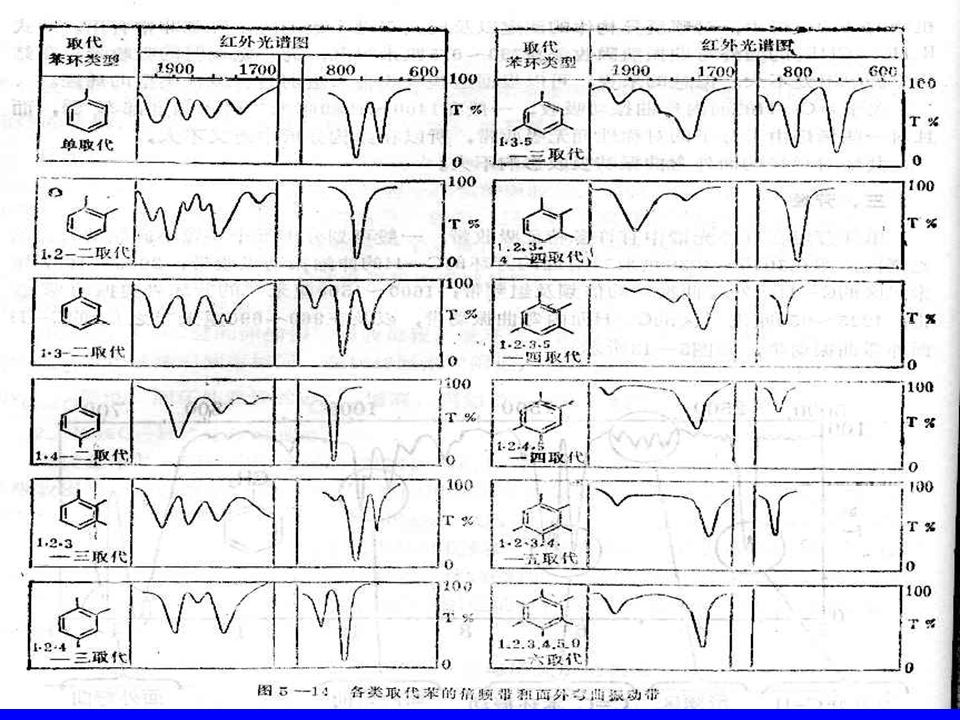
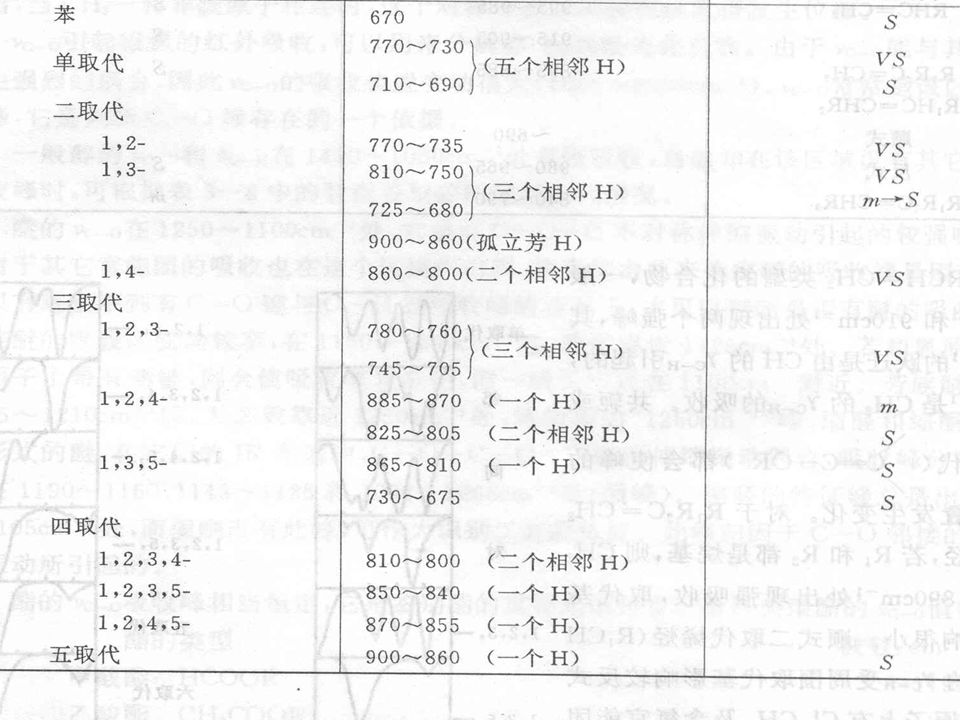
Aromatic compounds (1) 1. Aromatic C-H stretching absorption appears in the region 3100-3000 cm -1, close to that of olefinic C-H stretching 2. Aromatic C-H out-of-plane bending bands ( γ C=C- H )in the 900 to 690 cm -1 region are reasonably well determined by the substitution pattern of the benzene ring as indicated. These strong, usually sharp bands can be used in distinguishing positional isomers of substituted benzenes.
in the 900 to 690 cm -1 region are reasonably well determined by the substitution pattern of the benzene ring as indicated. These strong, usually sharp bands can be used in distinguishing positional isomers of substituted benzenes..")
34
Aromatic γ C=C-H Frequencies SubstitutionFrequency range (cm -1 ) mono775-730 and 710-690 1,2-di765-730 1,3-di800-750 and 710-690 1,4-di840-800 1,2,3-tri800-760 and 740-700 1,2,4-tri880-860 and 820-800
 mono and ,2-di ,3-di and ,4-di ,2,3-tri and ,2,4-tri and")
36
Aromatic compounds (2) 3. Sharp peaks at ~1600 and ~1500 cm -1 are very characteristic of all benzenoid compounds; a band at 1580 cm -1 appears when the ring is conjugated with a substituent.

39
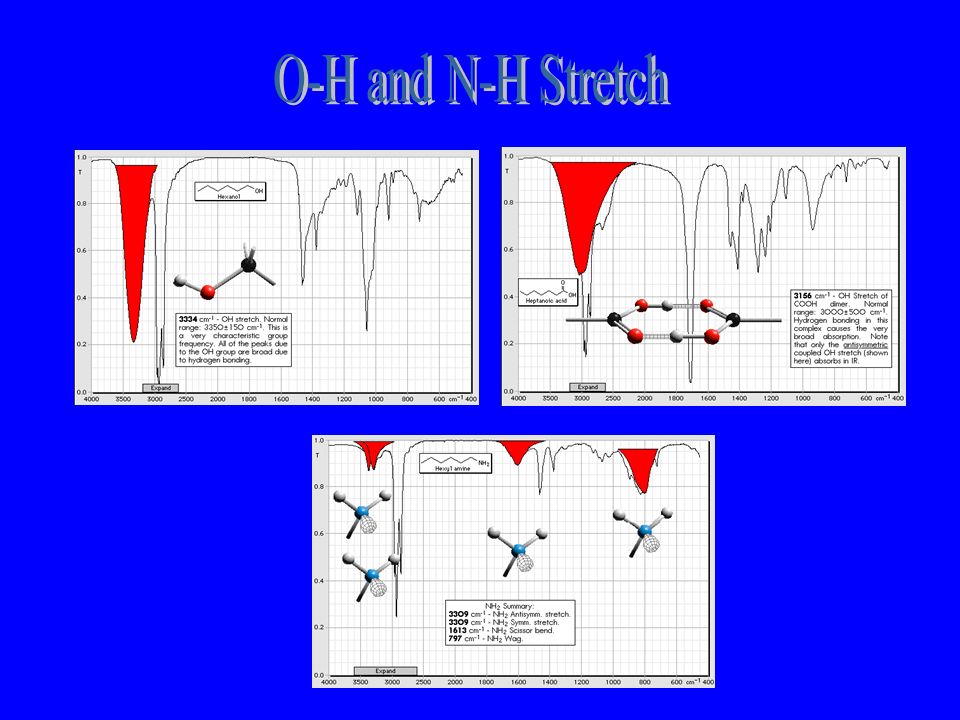
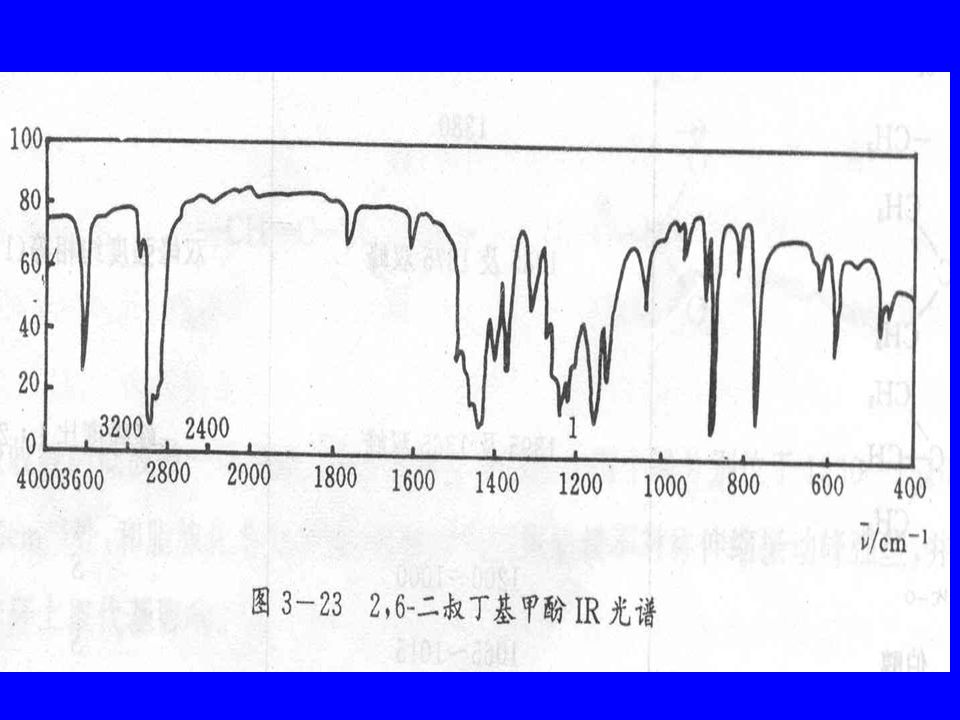
Alcohols and phenols (1) 1. The very characteristic infrared band due to O-H stretching appears at 3650 to 3600 cm -1 in dilute solution. In spectra of neat liquids or solids intermolecular hydrogen banding broadens the band and shifts its position to lower frequency (3500 – 3200 cm -1 )
.")
41
Alcohols and phenols (2) 2.Strong bands due to O-H bending and C-O stretching are observed at 1500 to 1300 cm -1 and 1220 to 1000 cm -1, respectively. In simple alcohols and phenols the exact position of the latter is useful in classification of the hydroxyl group. Phenol 1230 cm -1 tertiary 1200 cm -1 secondary 1125 cm -1 primary 1050 cm -1

44
Ether The asymmetric C-O stretching absorption of ethers appears in the region 1280 to 1050 cm -1. As in alcohols, the exact position of this strong peak is dependent on the nature of the attached groups. Phenol and enol ethers generally absorb at 1275 to 1200 cm - 1, dialkyl ethers at 1150 to 1050 cm -1. Alcohols, acids, esters may interfere the identification.

46
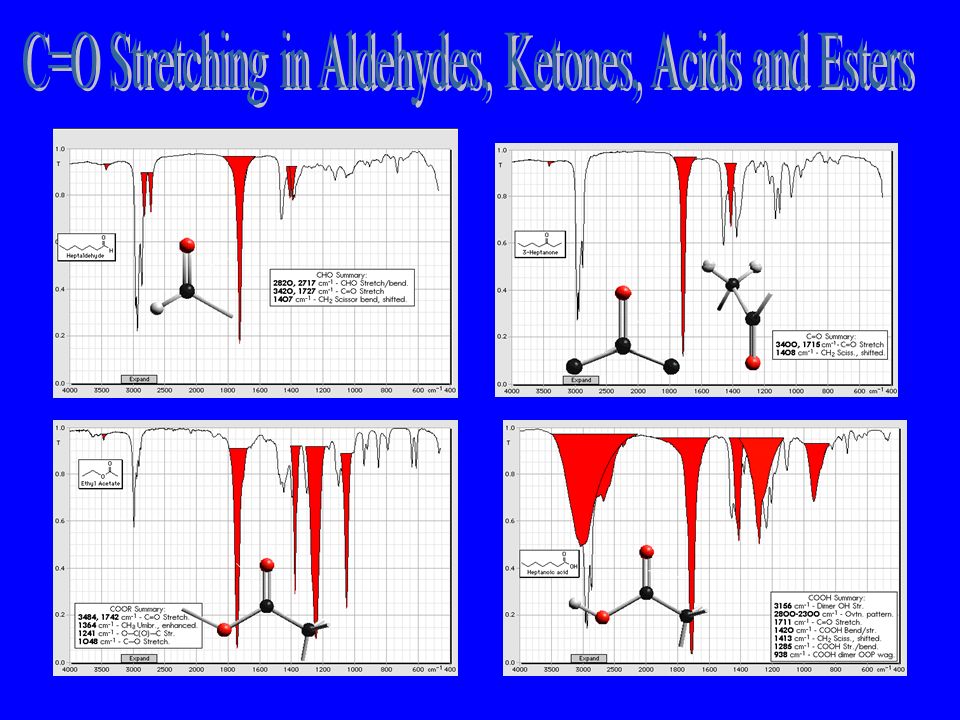
Aldehydes and Ketones The C=O stretching frequencies of saturated aldehydes and acyclic ketones are observed at 1735 to 1710 cm -1 and 1720 to 1700 cm -1, respectively. Aldehydes are also recognizable by the C-H stretching vibration which appears as two peaks in the 2850 to 2700 cm -1 region.

49
Carboxylic acids The most characteristic absorption of carboxylic acids is a broad peak extending from 3300 to 2500 cm -1 due largely to hydrogen bonded O-H stretching. The C-H stretching vibrations appear as small peaks on top of this band. The C=O stretching band appears from 1725 to 1700 cm -1 and is shifted to 1690~1680 cm -1 by adjacent unsaturation. It’s a strong band.

50
Carboxylic acids C-O stretching band appears from 1440~1395 cm -1, and usually weak peak.

52
Carboxylic esters Saturated ester carbonyl stretching is observed at 1740 to 1720 cm -1. Unsaturation adjacent to the carbonyl group lowers the frequency by 10 to 15 cm -1. The C-O-C stretching of esters appears as two bands in the 1280 to 1050 cm -1 region. The asymmetric stretching peak at 1289 to 1150 cm -1 is usually strong.

54
Anhydrieds Acid anhydrides are readily recognized by the presence of two high frequency (1830 to 1800 cm - 1 and 1775 to 1740 cm -1 carbonyl absorptions. As with other carbonyl stretching vibrations, the frequency is increased by incorporating the group in a ring and decreased by adjacent unsaturation. Cylic anhydrides differ from acyclic anhydrides also in that the lower frequency band is stronger in the former, while the reverse is true of the latter.

55
Amines (1) Primary and secondary amines show N-H stretching vibrations in the 3500 to 3300 cm -1 region. Primary amines generally have two bands approximately 70 cm -1 apart due to asymmetric and symmetric stretching modes. Secondary amines show only one band. Inter- or intramolecular hydrogen bonding broadens the absorptions and lowers the frequency.

56
Amines (2) In general the intensities of N-H bands are less than of O-H bands. The N-H bending and C-N stretching absorptions are not as strong as the corresponding alcohol bands and occur at approximately 100 cm -1 higher frequencies

57
Amines (3) In addition, NH 2 groups give an additional broad band at 900 to 700 cm -1 due to out-of- plane bending
 In addition, NH 2 groups give an additional broad band at 900 to 700 cm -1 due to out-of- plane bending")
59
Amides Amide carbonyl stretching is observed in the 1670 to 1640 cm -1 region. In contrast to other carbonyl groups, both adjacent unsaturation and ring formation cause the absorption to shift to higher frequencies. Primary and secondary amides also show N-H stretching at 3500 to 3100 cm -1 and N- H bending at 1640 to 1550 cm -1

60
Analysis procedure Qualitative analysis Compare with standard Database: Sadtler, Catalog of Infrared Standard Spectra; Documentation of Molecular Spectroscopy; American Petroleum Institute Infrared Spectral Data; IR Data Committee

61
Degree of unsaturation

62
Interpretation of IR spectra

63
2.3 Interpretation of IR Spectra

64
The 7 important region of IR spectra 1.Most organic compounds are composed of C, H, O and N. 2.Most chemical groups have specific absorption with 4000 – 670 cm -1. This region can be divided into 7 regions as:

65
7 important region No.WavenumberBond and vibration 13750 ~ 3300ν O-H, ν N-H 23300 ~ 3000ν C-H (-C≡C-H, >C=C-H, Ar-H) 3000 ~ 2700ν C-H (CH 3, CH 2, CH, CHO) 32400 ~ 2100ν C ≡C, ν C ≡N 41900 ~ 1650ν C=O 51675 ~ 1500ν C=C, ν C=N 61475 ~ 1000δ CH, ν C-O, ν C-C 71000 ~ 650γ C=C-H, Ar-H, γ CH2
 3000 ~ 2700ν C-H (CH 3, CH 2, CH, CHO) ~ 2100ν C ≡C, ν C ≡N ~ 1650ν C=O ~ 1500ν C=C, ν C=N ~ 1000δ CH, ν C-O, ν C-C ~ 650γ C=C-H, Ar-H, γ CH2")
66
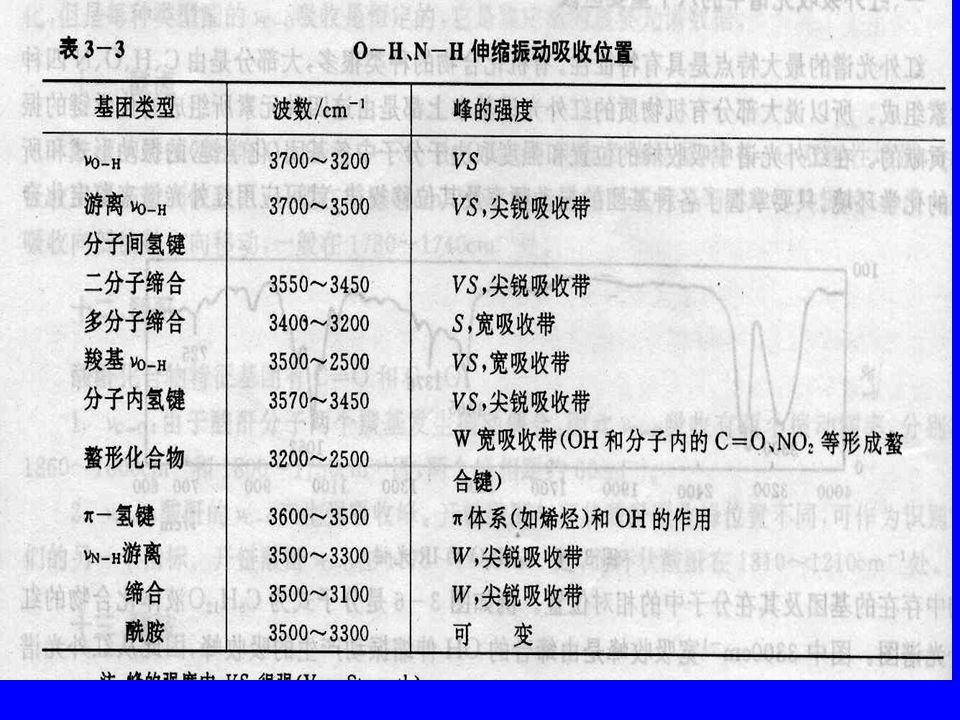
Interpretation (part 1) O-H, N-H stretching (3750-3000 cm -1 ) ν O-H at 3700-3200 cm -1 is an important evidence of the existence of OH Free OH group (dilute CCl 4 solution) shows sharp peak. H-bond and intermolecular association broad and lower the wavenumbers (3450-3200 cm -1 )
.")
68
Interpretation 1 The peak numbers of ν N-H depend on the number of substituents of N atom. Primary amines and primary amides have two peaks with almost the same strength. Amide can be distinguished by the strong ν C=O peak around 1600 cm -1

70
Interpretation 1 Secondary amines and amides have only one weak ν N-H peak at 3500 –3100 cm -1. Secondary aromatic amines have strong absorption at 3450 –3490 cm -1. No peak for tertiary amines and amides in the corresponding ν N-H region. IR is a simple way to distinguish primary, secondary and tertiary amines and amides

71
Interpretation (part 2) C-H stretching (3300-2700) Distinguish saturated hydrocarbons from unsaturated Alkynes, aromatic (3030 cm -1, weak and sharp)
 C-H stretching ( ) Distinguish saturated hydrocarbons from unsaturated Alkynes, aromatic (3030 cm -1, weak and sharp)")
73
Interpretation (2) Besides the C=O stretching frequencies of saturated aldehydes at 1735 to 1710 cm -1,Aldehydes are also recognizable by the C-H stretching vibration which appears as two peaks in the 2850 to 2700 cm -1 region.
 Besides the C=O stretching frequencies of saturated aldehydes at 1735 to 1710 cm -1,Aldehydes are also recognizable by the C-H stretching vibration which appears as two peaks in the 2850 to 2700 cm -1 region.")
74
Interpretation (part 3) C ≡ C, C ≡ N etc. 2400-2100
 C ≡ C, C ≡ N etc")
75
Interpretation (part 4) C=O (1900-1650 cm -1 ) The C=O stretching band (1755-1670 cm -1 ) is a very strong peak, it can be a good evidence for the existence of C=O groups in the unknown compound. The adjacent group may affect the position of υ C=O

77
Interpretation (part 5) Double bond stretching (1690-1500 cm -1 ) Stretching vibration of C=C, C=N, N=N, N=O and C=C of benzene ring Usually weak peak. Asymmetric structure enhances the absorption Sharp peaks at ~1600 and ~1500 cm -1 are very characteristic of all benzenoid compounds;

80
Interpretation (part 5) Besides, δ NH 2 of amines are also in this region. Primary amine 1650 – 1580 (m-s) with a broad peak at 900-650 cm -1. (maybe interfered with the peaks of aromatic ring). There isn’t any peaks for secondary peaks. Primary amide δ NH 2 at 1640-1600 cm -1 is a strong and sharp peak(1/3-1/2 of C=O). Secondary amide δ NH 2 at 1550-1530 cm -1
 with a broad peak at cm -1. (maybe interfered with the peaks of aromatic ring). There isn’t any peaks for secondary peaks. Primary amide δ NH 2 at cm -1 is a strong and sharp peak(1/3-1/2 of C=O). Secondary amide δ NH 2 at cm -1.")
81
Interpretation (part 6) X-H and X-Y (1475-1000 cm -1 ) The absorption bands include C-H in plane bending, stretching vibration of C-O and C- X, and C-C vibration
 X-H and X-Y ( cm -1 ) The absorption bands include C-H in plane bending, stretching vibration of C-O and C- X, and C-C vibration")
83
Interpretation 1460 cm -1 is the specific peak for CH 3 and CH 2 Can be identified with the peak at 1380 cm -1 1380 cm -1 peak can split into 2 peaks with same strength. Example: isopropyl group has two peaks at 1389- 1381 and 1372-1368 cm -1. It can be verified with C-C stretching of isopropyl at 1170 and 1150 cm -1 dual peaks

85
Interpretation δs (C-H) of tert-butyl group splits into 1401- 1395 and 1374-1360 cm -1. The low frequency peak is stronger than the former one

87
Interpretation The strong stretching vibration peak of C-O appears in the spectra of alcohol, ether and ester as an evidence of OH group Alcohol: 1410-1050 cm -1, reflect the structure of alcohols. Ether: 1250-1100 cm -1 Ester: most of them 1200-1190 cm -1

88
Interpretation (part 7) C-H out-of-plane bending(1000-650 cm -1 ) Mainly of γ C-H of alkenes and aromatic compounds
 C-H out-of-plane bending( cm -1 ) Mainly of γ C-H of alkenes and aromatic compounds")
89
Aromatic compound Two bands were applied to identify the structure of aromatic compound: 900-650 cm -1 (γ C-H ) and 2000-1660 cm -1 (υ C=C )
 and cm -1 (υ C=C )")
92
Aromatic compound The absorption bands at 900-650 cm -1 are strong and specific for substitution structure of aromatic. They can also be used for quantitation.

93
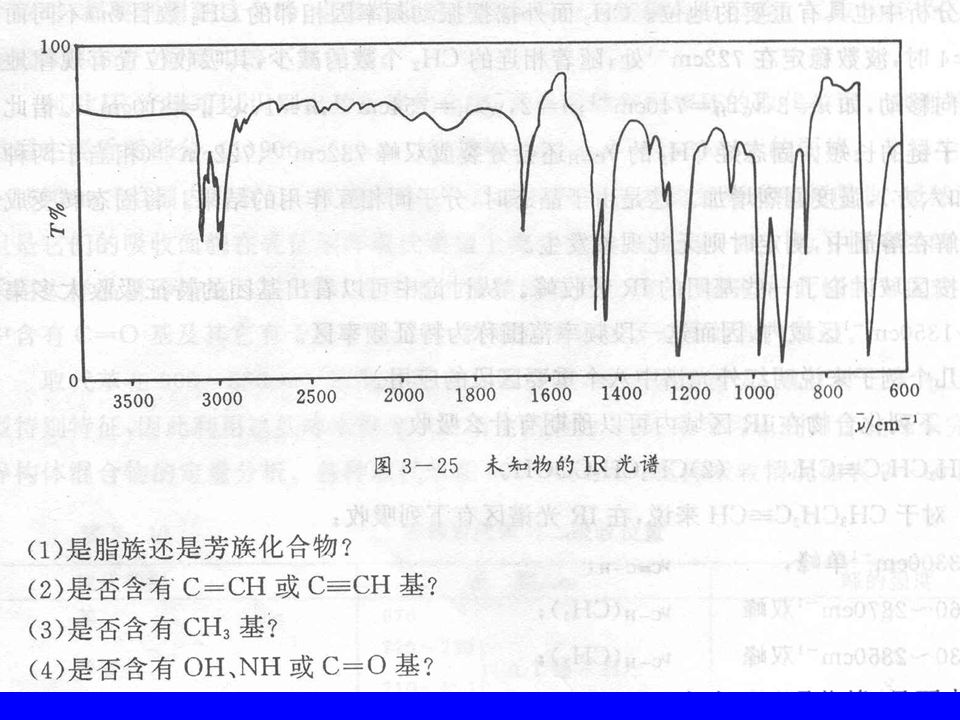
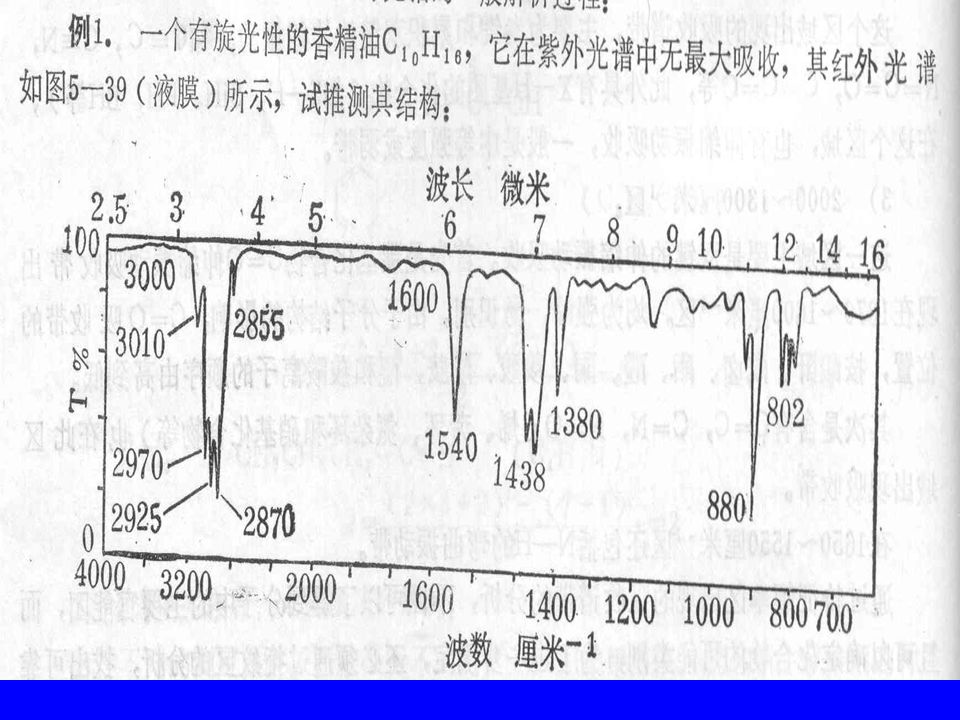
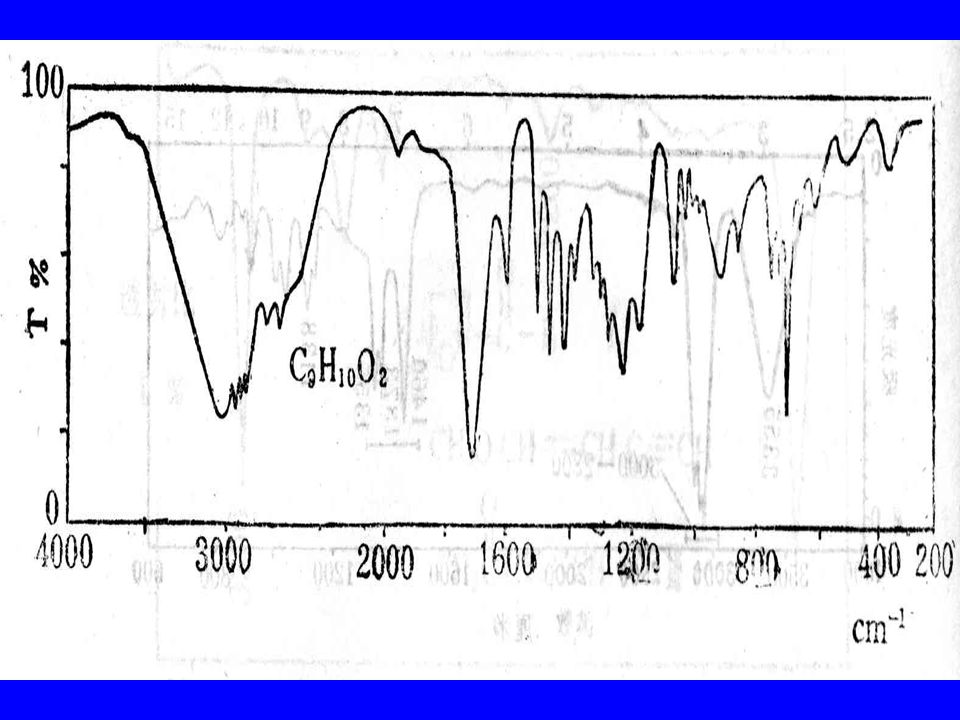
Example

97
C 8 H 10 O

98
C 12 H 26 O

99
C 9 H 7 NO

103
Procedure for obtaining IR spectra Liquid Samples: The simplest method for mounting the sample consists of placing a thin film of the liquid between two transparent windows. The most common material used for the windows is NaCl(transparent within 10000 to 650 cm -1 )
.")
104
Procedure for obtaining IR spectra Solid Samples: As an alternative to measuring the spectrum of a liquid solution of a solid compound, a solid solution or dispersion in KBr is usually more convenient. 1-2 mg of sample is mixed with 50-100 mg of dry KBr powder. The mixing powder is formed into a transparent pellet by pressure in a small die.

Similar presentations


 ALCOHOLS ACIDS>")


 Spectroscopy>")


>")


