Download presentation
Presentation is loading. Please wait.

1
Hubble’s Law

2
Edwin Hubble ( ) Measured distances to nearby galaxies using Cepheid variables Galaxies are islands of stars Developed a classification scheme for galaxies. Discovered the Expansion of the Universe Space telescope named after him!

3
We measure galaxy distances using a chain of techniques!

4
Hubble’s Law v = Ho x d

5
The Universe is Expanding!!
Recessional Velocity is Proportional to Distance V = 0 2800 2100 1400 700 km/sec 10 Mpc 20 Mpc 30 Mpc 40 Mpc Milky Way A B C V = 0 2800 2100 1400 700 km/sec 10 Mpc 20 Mpc 30 Mpc 40 Mpc Milky Way A B C Alien’s Galaxy The Universe is Expanding!!

7
Hubble’s Law y = mx + b Hubble’s Law v = Ho x d
Hubble Diagram Equation of a Straight Line y = mx + b m = slope = Hubble’s Constant (Ho) y - recessional velocity(v) x - distance(d) Hubble’s Law v = Ho x d
 y - recessional velocity(v) x - distance(d) Hubble’s Law. v = Ho x d.")
8
Finding a Galaxy’s Distance Hubble’s Law
Hubble Diagram v = Ho x d d = v / Ho To Find Distance: Measure recessional velocity (red shift) 132 Mpc
 132 Mpc.")
9
Sample Galaxies Distance images Recessional Velocity spectra

10
Measuring Distance Elliptical galaxies - same physical size (0.032 Mpc) Distances inversely proportional to angular size Virgo – known distance of 15.6 Mpc d = 15.6 Mpc 49.4 mm S

11
Measuring Recessional Velocity
H line 388.8 nm 501.5 nm 112.7 nm L – measure distance (mm) between the nm and the nm emission lines x – measure distance (mm) between the nm line and the H line λo = nm (laboratory wavelength of the H line) Recessional Velocity Observed Wavelength of H Line c (λobs – λo) λo v = λobs = nm (112.7 nm) x L
 between the nm and the nm emission lines. x – measure distance (mm) between the nm line and the H line. λo = nm (laboratory wavelength of the H line) Recessional Velocity. Observed Wavelength of H Line. c (λobs – λo) λo. v = λobs = nm + (112.7 nm) x. L.")
12
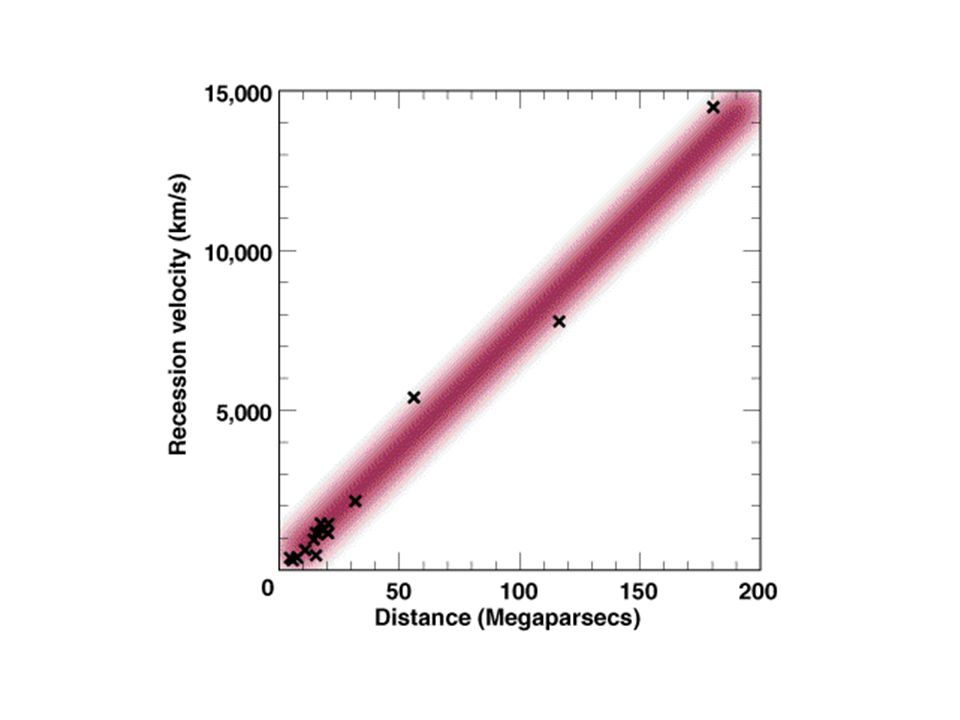
Hubble Diagram Procedure - plot data - draw best fit line
v = Ho x d Hubble Diagram x Procedure - plot data x - draw best fit line rise - find slope (Ho) x slope = rise/run x run x
 x. slope = rise/run. x. run. x.")
13
End

Similar presentations
>")
 Longer wavelength; (b) shorter wavelength.>")


 664-2655.>")


 Biography American astronomer Education: University of Chicago First to show other galaxy by photographing stars of Andromeda.>")


