Download presentation
Presentation is loading. Please wait.

1
Driving non-regulated vehicles for work – cars & vans M. O’Malley 30/01/13

2
Global Statistics Without active intervention road traffic injuries are predicted to become the 5th leading cause of death in the world by 2030 compared with 9th in 2004. The UN have declared a global strategy on reducing road related death over the next 10 years.

3
Rank Leading Cause % 1 Ischaemic heart disease 12.2 2 Cerebrovascular disease 9.7 3 Lower respiratory infections 7.0 4COPD5.1 5 Diarrhoeal disease 3.6 6HIV/AIDS3.5 7TB2.5 8 Trachea, bronchus, lung cancers 2.3 9 Road traffic injuries 2.2Rank Leading Cause %1 Ischaemic heart disease 12.2 2 Cerebrovascular disease 9.7 3COPD7.0 4 Lower respiratory infections 5.1 5 Road traffic injuries 3.6 6 Trachea, bronchus, lung cancers 3.5 7 Diabetes mellitus 2.5 8 Hypertensive heart disease 2.3 9 Stomach cancer 2.2 For 2004For 2030 World Health Statistics - 2008

4
So what about the UK? Annually, a third of all road traffic accidents involve someone who is driving for work resulting in excess of 1,000 fatalities and 13,000 serious injuries For non-regulated vehicles (cars/vans) there are in excess of 500 fatalities 171 workplace fatalities for 2010/2011
 there are in excess of 500 fatalities 171 workplace fatalities for 2010/2011.")
5
Some Facts 5.1 million cars are used for work 4 million cars are privately owned - ‘ the grey fleet ’ ‘ Fleet driver effect ’ - 49% more likely to be involved in a collision than an ‘ ordinary driver ’

6
What I did Decided to focus on non-regulated vehicles Created a questionnaire Issued it on-line via SurveyMonkey Utilised a snowballing sampling technique using LinkedIn, Facebook, IOSH Merseyside, Contractors to site

7
Questions Demographics – age, sex Organisation – size, type, job Vehicle – mileage, accidents, experience Communication, training Length of working day Risk taking

8
Who Replied 104 UK respondents 68% = organisations > 250 employees 64% = private sector 20% = public sector

9
What Drivers Know

10
Main Findings Two-thirds of large organisations had informed employees of their driving related policies and ¼ of these employees had received some form of training.

11
Working outside of policy guidelines For those aware of a driving for work policy 29% admitted to knowingly working outside the guidelines (private sector twice as likely) For those aware of a driving for work policy 29% admitted to knowingly working outside the guidelines (private sector twice as likely) Desire to get home Pressure of work Communication – no access to hands free mobile
 For those aware of a driving for work policy 29% admitted to knowingly working outside the guidelines (private sector twice as likely) Desire to get home Pressure of work Communication – no access to hands free mobile")
12
Risk Taking Behaviour 36% felt obliged to take risks 36% felt obliged to take risks Pressure of work - deadlines Fatigue Speeding Traffic conditions Adverse weather

15
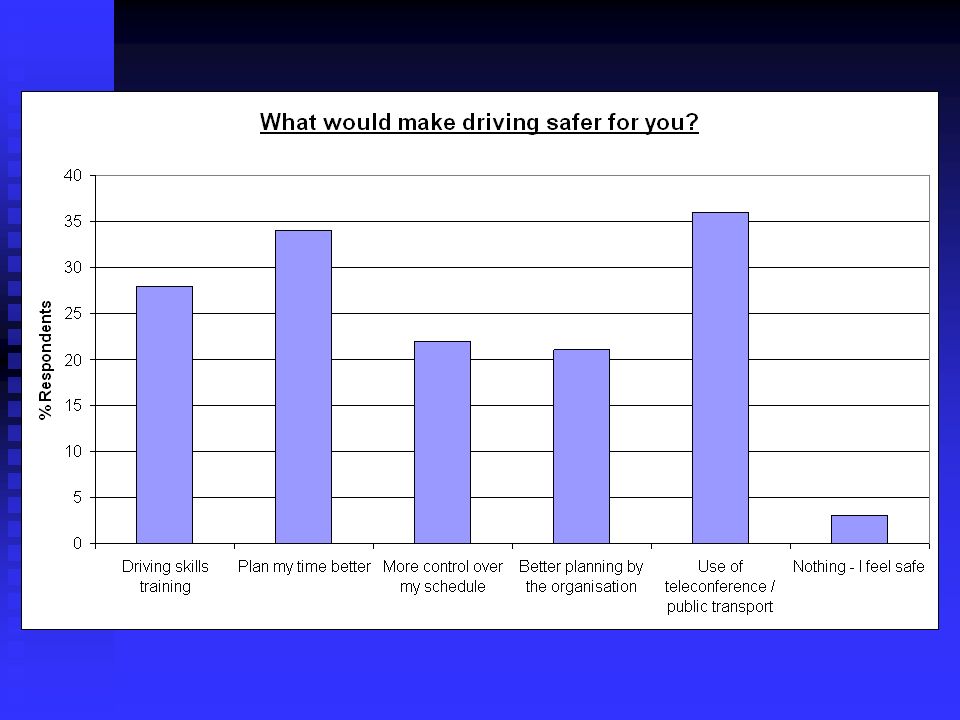
Reducing Risk for Drivers Communication of policy Improved organisational measures to reduce time pressures Minimising attention-demanding tasks (mobile phones) Better planning so work schedules allow for the driving aspect of the job
 Better planning so work schedules allow for the driving aspect of the job")
16
What I Learnt Limitations of current research Extent of the issue ~ 500 fatalities Lack of awareness as a HSE professional More we could do

17
Any Questions?

Similar presentations