Download presentation
Presentation is loading. Please wait.

2
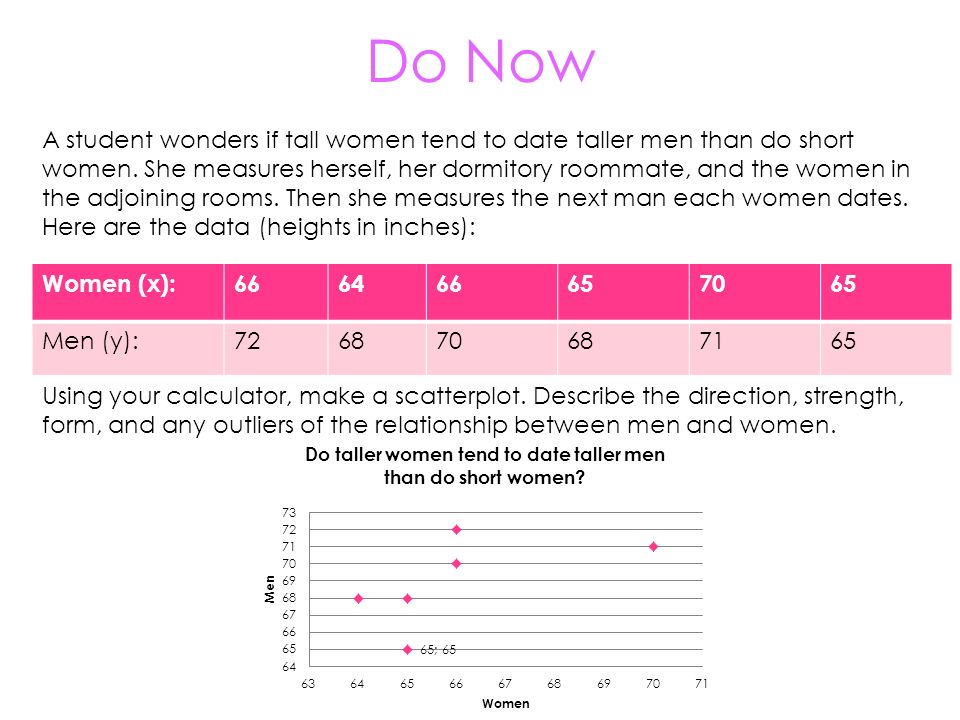
Do Now Women (x):666466657065 Men (y):726870687165 Using your calculator, make a scatterplot. Describe the direction, strength, form, and any outliers of the relationship between men and women. A student wonders if tall women tend to date taller men than do short women. She measures herself, her dormitory roommate, and the women in the adjoining rooms. Then she measures the next man each women dates. Here are the data (heights in inches):
:.")
3
Correlation Coefficient Unit 1: Data Exploration

4
Objectives Calculate and interpret the correlation coefficient (r)
")
5
Correlation r Correlation (r): measures the direction and strength of the linear relationship between two quantitative variables r = correlation r < 0 Negative association r > 0 Positive association r = 0 No correlation Correlation does NOT equal slope!
: measures the direction and strength of the linear relationship between two quantitative variables r = correlation r < 0 Negative association r > 0 Positive association r = 0 No correlation Correlation does NOT equal slope!")
6
Correlation Equation Using Calculator: 1.STAT > EDIT – Enter x-values in L1 – Enter corresponding y-values in L2 2.STAT > CALC > 4:LinReg (ax+b) – Xlist: L1 – Ylist: L2 – Enter! – r is your correlation coefficient (NOT r 2 )
.")
7
Calculate the Correlation r for the relationship between women and men’s heights. Women (x):666466657065 Men (y):726870687165 Using Calculator: 1.STAT > EDIT – Enter x-values in L1 – Enter corresponding y-values in L2 2.STAT > CALC > 8:LinReg (a+bx) – Xlist: L1 – Ylist: L2 – Enter! – r is your correlation coefficient (NOT r 2 )
: Men (y): Using Calculator: 1.STAT > EDIT – Enter x-values in L1 – Enter corresponding y-values in L2 2.STAT > CALC > 8:LinReg (a+bx) – Xlist: L1 – Ylist: L2 – Enter. – r is your correlation coefficient (NOT r 2 ).")
8
Facts about Correlation 1.Correlation does not change when we change the units. 2.Correlation does not describe curved relationships between variables. A correlation of 0 does not mean there is no relationship. 3.Correlation is strongly effected by outliers.

9
Facts about Correlation 1.What happens to correlation if we do not include the 70 inch woman and the 71 inch man? 2. If heights were measured in centimeters rather than inches, how would the correlation change? (There are 2.54 cm in an in) A student wonders if tall women tend to date taller men than do short women. She measures herself, her dormitory roommate, and the women in the adjoining rooms. Then she measures the next man each women dates. Here are the data (heights in inches): Women (x):666466657065 Men (y):726870687165
 A student wonders if tall women tend to date taller men than do short women. She measures herself, her dormitory roommate, and the women in the adjoining rooms. Then she measures the next man each women dates. Here are the data (heights in inches): Women (x): Men (y):")
10
Independent Practice 10 minutes

11
Independent Practice and Homework Correlation Coefficient Quiz to be scanned upon walking into class on Friday. Reading Response

12
Unit 1 Exam Reflection

13
PeriodReview Packet Completion Practice Assessment Completion 540%50% 64%10% 8 0%

14
Unit 1 Project Reflection

Similar presentations


 through (e), identify the correlation of the following graphs. a).44 b).98 c).92 d) -.89 e) -.99.>")


, (0, –3) 2. (8, 5), (–8, 7) Use.>")