Download presentation
Presentation is loading. Please wait.

1
BASIC ECG INTERPRETATION
2015

2
Conduction System Review

3
CARDIAC CELLS Current Voltage
Electrical charge flow from one point to another Voltage Energy measurement between positive and negative points Measured in millivolts

4
CARDIAC CELLS Action Potential
Five Phase cycle reflecting the difference in concentration of electrolytes (Na+, K+, Ca++, Cl-) which are charged particles across a cell membrane The imbalance of these charged particles make the cells excitable
 which are charged particles across a cell membrane. The imbalance of these charged particles make the cells excitable.")
5
Cardiac Cell Action Potential
Phase 0 Depolarization Rapid Na+ entry into cell Phase 1 Early depolarization Ca++ slowly enters cell Phase 2 Plateau-continuation of repolarization Slow entry of Sodium and Calcium into cell

6
Cardiac Cell Action Potential
Phase 3 Potassium is moved out of the cell Phase 4 Return to resting membrane potential

7
CARDIAC CELLS Current (flow of energy) of electrolytes from one side of the cell membrane to the other requires energy (ATP) Expressed as volts Measured as ECG

8
CARDIAC CELLS Properties Automaticity Excitability
Cardiac pacemaker cells create an electrical impulse without being stimulated from another source Excitability Irritability Ability of cardiac muscle to respond to an outside stimulus, Chemical, Mechanical, Electrical

9
CARDIAC CELLS 3.Conductivity 4.Contractility
Ability of cardiac cell to receive an electrical impulse and conduct it to an adjoining cardiac cell 4.Contractility Ability of myocardial cells to shorten in response to an impulse

10
CONDUCTION SYSTEM Sinoatrial Node (SA) Primary pacemaker
Intrinsic rate /min Located in Rt. Atrium Supplied by sympathetic and para- sympathetic nerve fibers Blood from RCA-60% of people

11
CONDUCTION SYSTEM Atrioventricular Junction Internodal pathways merge
AV Node Non-branching portion of the Bundle of His

12
CONDUCTION SYSTEM AV Node Supplied by RCA – 85%- 90% of people
Left circumflex artery in rest of people Delay in conduction due to smaller fibers

13
CONDUCTION SYSTEM Bundle of His
Located in upper portion of interventricular septum Intrinsic rate /min Blood from LAD and Posterior Descending Less vulnerable to ischemia

14
CONDUCTION SYSTEM Right & Left Bundle Branches
LBB – Left Bundle Branch Anterior Fasicle Anterior portion left ventricle Posterior Fascicle Posterior portions of left ventricle Septal Fasicle Mid-spetum RBB – Right Bundle Branch Right Ventricle

15
CONDUCTION SYSTEM Purkinje Fibers Intrinsic pacemaker rate 20-40/min
Impulse spreads from endocardium to epicardium

16
The ECG

17
ECG Records electrical voltage of heart cells Orientation of heart
Conduction disturbances Electrical effects of medications and electrolytes Cardiac muscle mass Ischemia / Infarction

18
ECG Leads Tracing of electrical activity between 2 electrodes
Records the Average current flow at any specific time in any specific portion of time

19
ECG Types of leads Limb Lead (I, II, III)
Augmented (magnified) Limb Leads (aVR, aVL, aVF) Chest (Precordial) Leads (V1,V2,V3,V4,V5,V6) Each lead has Positive electrode
 Limb Leads (aVR, aVL, aVF) Chest (Precordial) Leads (V1,V2,V3,V4,V5,V6) Each lead has Positive electrode.")
20
ECG Each lead ‘sees’ heart as determined by 2 factors
1. Dominance of left ventricle 2. Position of Positive electrode on body

21
ECG Lead I Negative electrode Right arm Positive electrode Left arm

22
ECG Lead II Negative Electrode Right Arm Positive Electrode Left Leg

23
ECG Lead III Negative Lead Left Arm Positive Lead Left Leg

24
ECG PAPER Graph Paper Small boxes Horizontal axis 1mm wide; 1 mm high
Time in seconds 1 mm box represents seconds ECG paper speed is 25 mm/second One large box is 5 small boxes and =.20 seconds (.04sec x5)
")
26
ECG PAPER Waveforms Movement from baseline Positive (upward)
Negative (downward) Isoelectric –along baseline Biphasic - Both upward and downward
 Isoelectric –along baseline. Biphasic - Both upward and downward.")
27
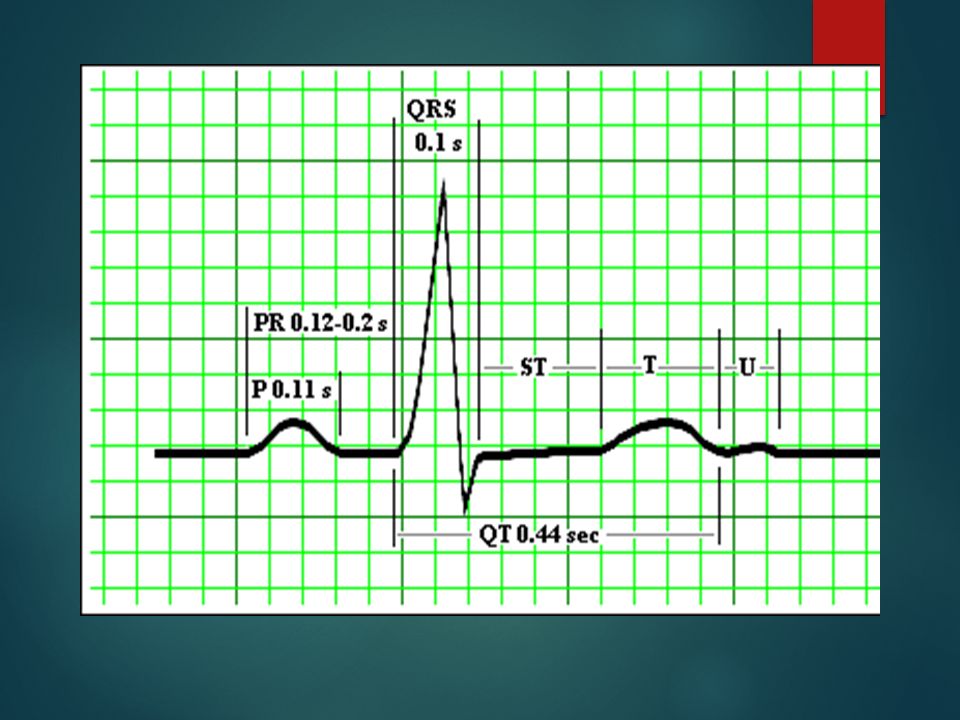
ECG P Wave First waveform Impulse begins in SA Node in Right Atrium
Downslope of P wave – is stimulation of left atrium 2.5 mm in height (max) O.11 sec. duration (max) Positive in Lead II
 O.11 sec. duration (max) Positive in Lead II.")
29
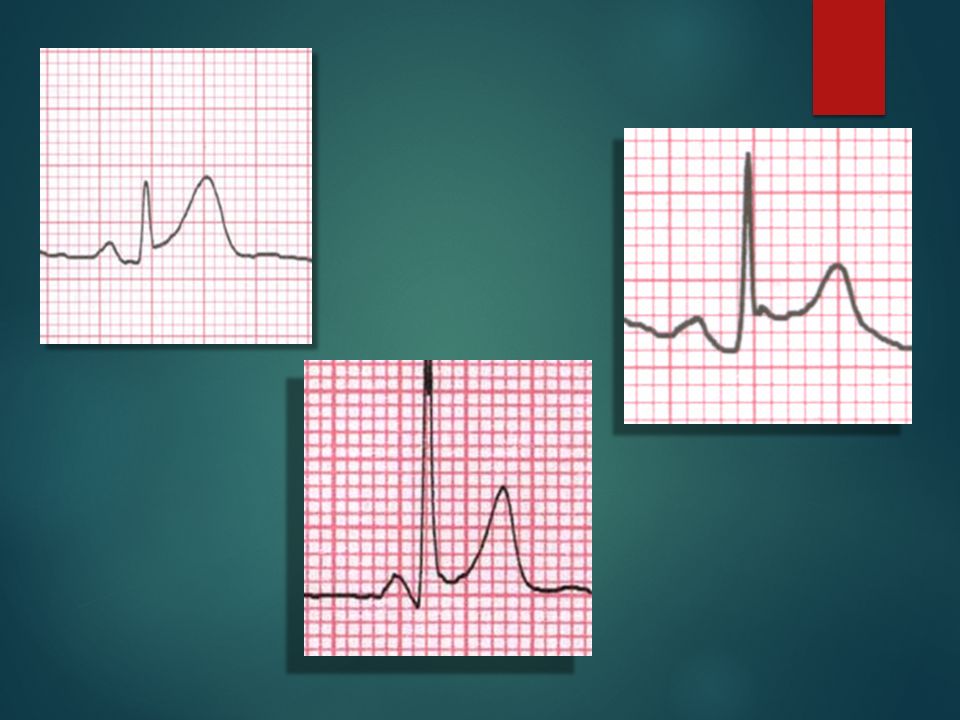
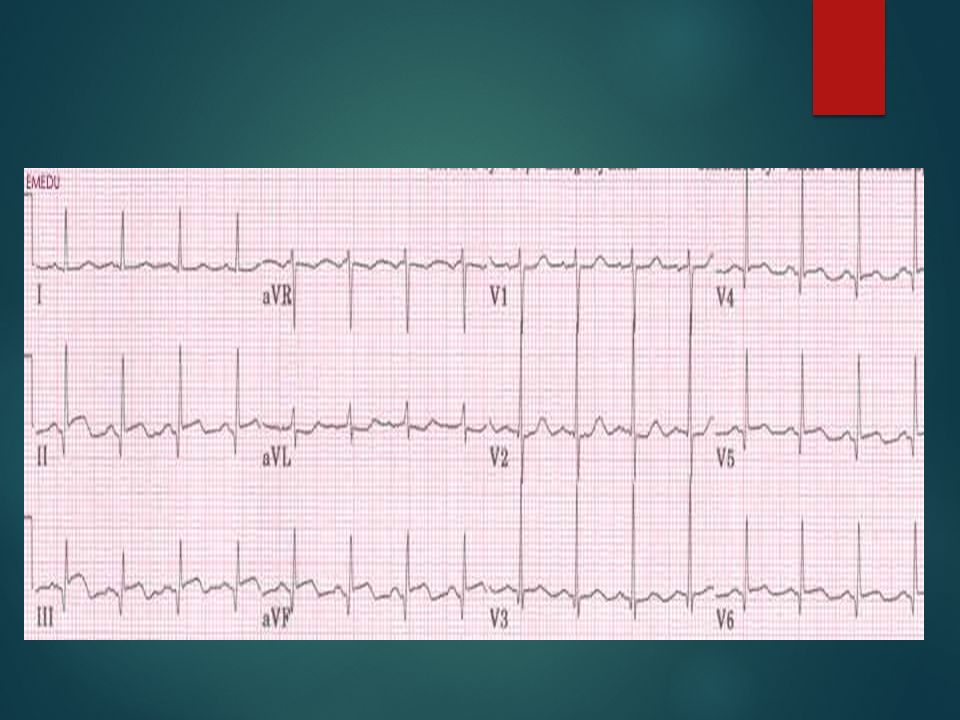
A normal ECG waveform

30
ECG QRS Complex Electrical impulse through ventricules
Larger than P wave due to larger muscle mass of ventricles Follows P wave Made up of a Q wave R wave S wave

31
ECG Q wave First negative deflection following P wave
Represents depolarization of the interventricular septum activated from left to right

32
ECG S wave Normal duration of QRS
Negative waveform following the R wave Normal duration of QRS 0.06 mm – 0.10 mm Not all QRS Complexes have a Q, R and S

33
ECG T wave Represents ventricular repolarization
Absolute refractory period present during beginning of T wave Relative refractory period at peak Usually 0.5 mm or more in height Slightly rounded

34
ECG U wave Small waveform Follows T wave Less than 1.5 mm in amplitude

36
ECG J Point Point where the QRS complex and ST-segment meet

38
ECG PR Interval Measurement where P wave leaves baseline to beginning of QRS complex sec. QRS Interval Measurement from beginning of the Q wave until the end of the S wave. sec.

39
ECG QT interval Begins at isoelectric line from end of S wave to the beginning of the T wave sec. Represents total ventricular activity Measured from beginning of QRS complex to end of T wave.

40
ECG Analysis Determine Rate Is it Regular? ( R-R and P-P intervals)
Normal? Fast? Slow? Atrial Rate? Ventricular Rate? Is it Regular? ( R-R and P-P intervals) Regularly irregular ( pattern) or irregularly irregular? Are P-waves Present? Are there p waves before every QRS? Is the P-P interval constant? Is The P-R interval normal? Is the QRS normal? Is the morphology of the QRS the same?
 Regularly irregular ( pattern) or irregularly irregular Are P-waves Present Are there p waves before every QRS Is the P-P interval constant Is The P-R interval normal Is the QRS normal Is the morphology of the QRS the same")
41
ECG Analysis Determining Rate Rate Six Second Method
Two – 3 second markers Count complexes and multiply x 10

47
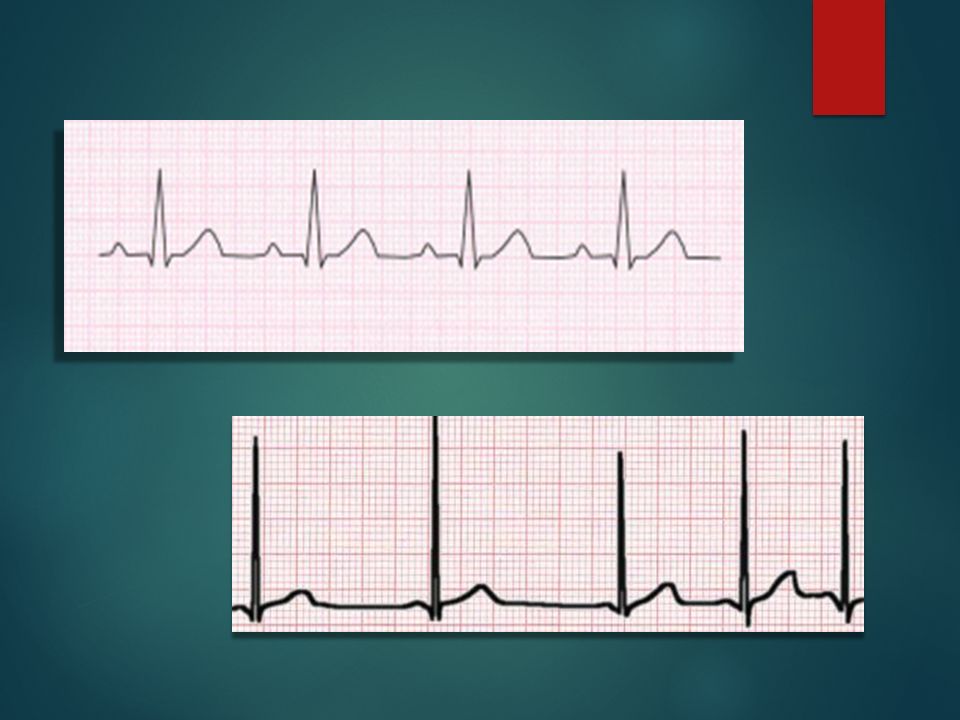
ECG Normal Sinus Rhythm Electrical activity activity starts in SA node
AV Junction Bundle Branches Ventricles Depolarization of atria and ventricles Rate: /Regular PR interval / QRS duration normal

51
ECG Sinus Bradycardia Sinus Node fires at a rate slower than normal
Conduction occurs through atria, AV junction, Bundle Branches and Ventricles Depolarization of atria and ventricles occurs In adults – rate is slower than 60 / minute Rate is regular Why? Athletes Vagal Stimulation Medications Cardiac disease

52
ECG Sinus Bradycardia Causes H’s T’s Hypoxia Hypovolemia
Hydrogen Ion (acidosis) Hypo- Hyperkalemia Hypoglycemia Hypothermia T’s Toxins Tamponade Tension Pneumothorax Thrombosis Trauma
 Hypo- Hyperkalemia. Hypoglycemia. Hypothermia. T’s. Toxins. Tamponade. Tension Pneumothorax. Thrombosis. Trauma.")
54
ECG Sinus Tachycardia SA node fires faster than 100-180/minute
Normal pathway of conduction and depolarization Regular rate Why? Coronary artery disease; Fear; anger; exercise; Hypoxia;Fever Treatment: Treat Cause Beta-Blockers

57
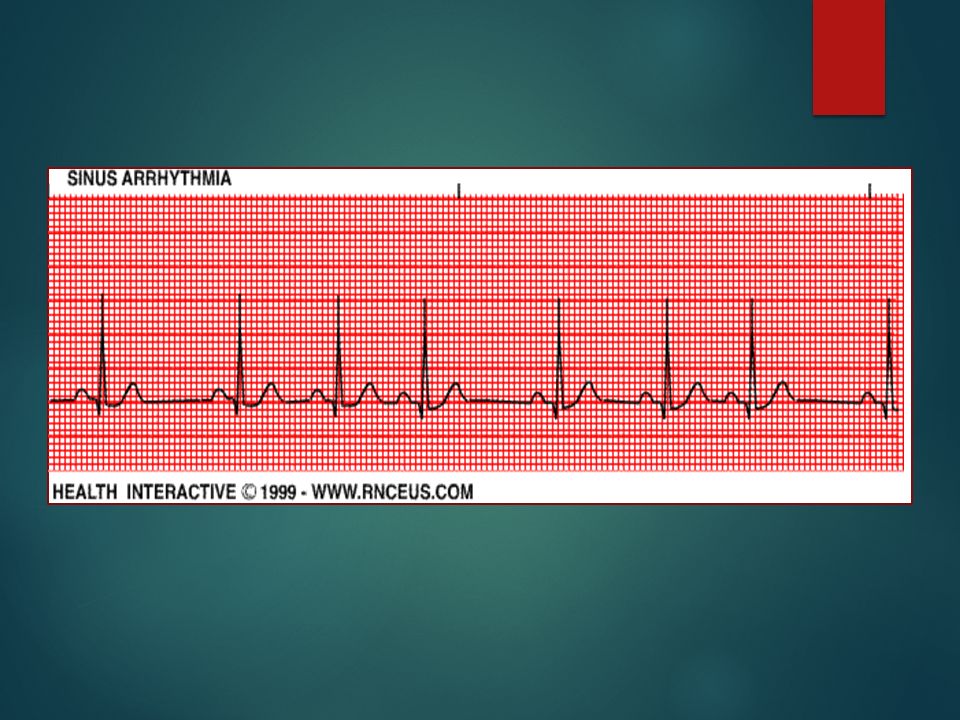
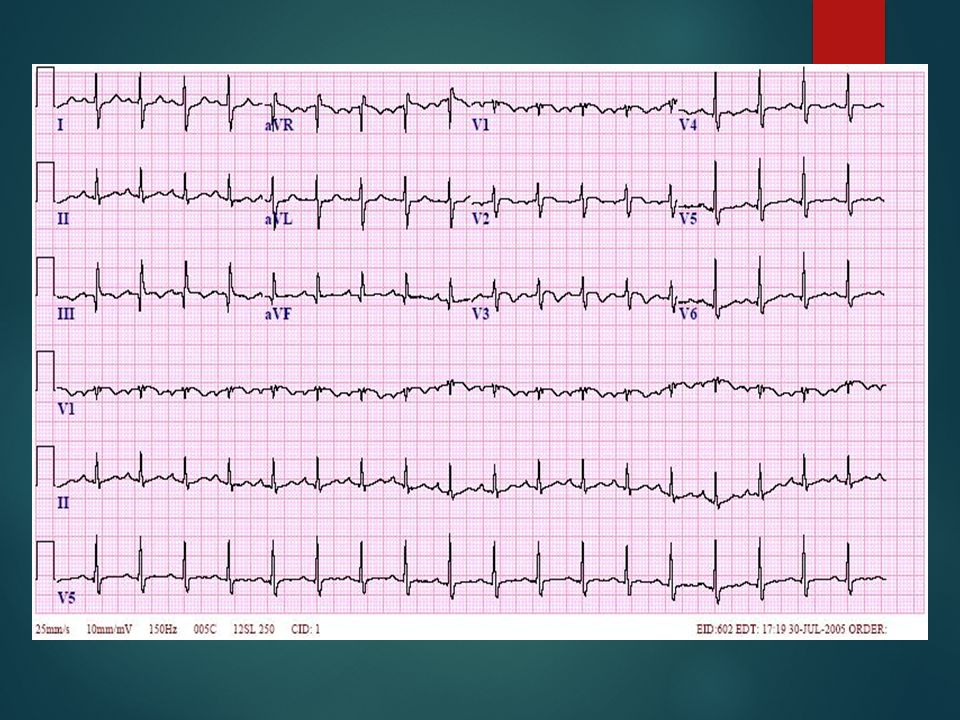
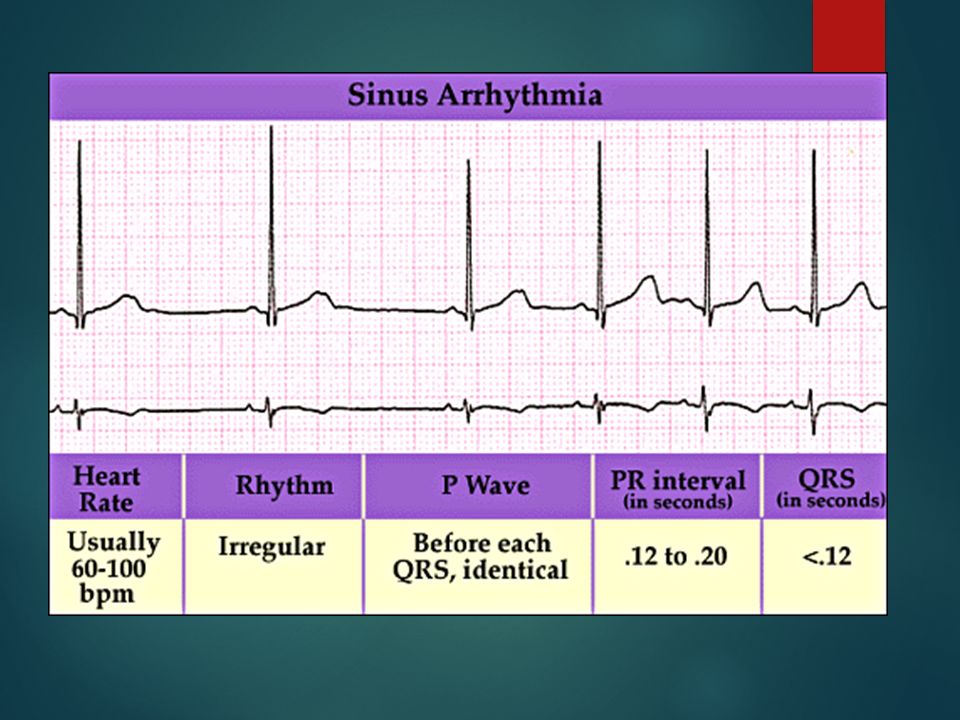
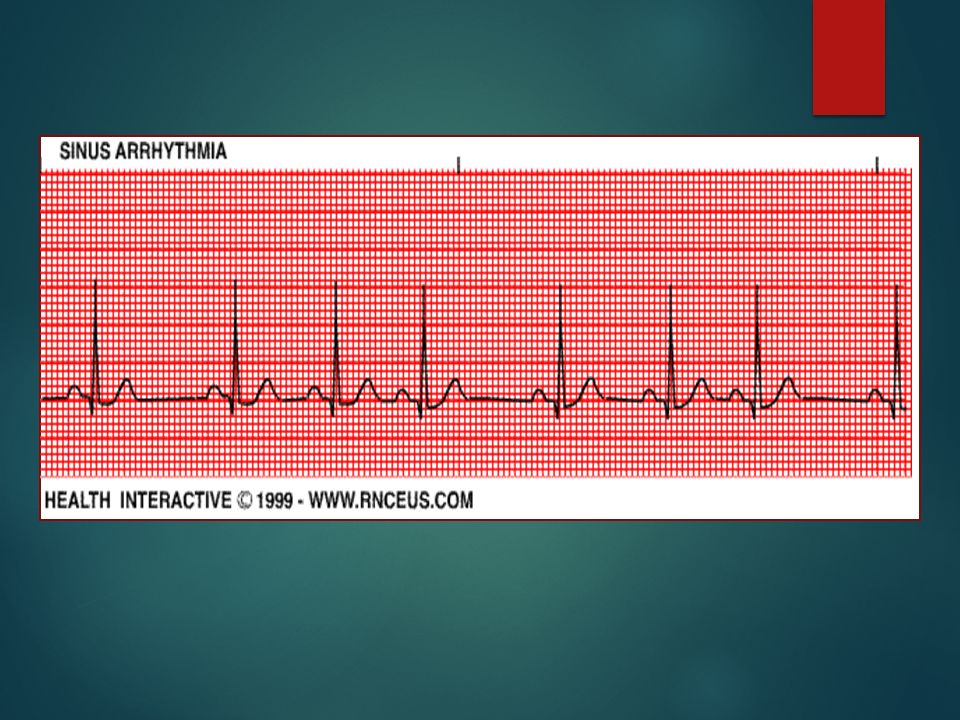
ECG Sinus Arrhythmia The SA node fires Irregularly / Rate 60-100/min.
Normal pathway of electrical conduction and depolarization PR and QRS durations are normal Why? Respiratory- Increases with inspiration; decreases with expiration Often in children; Inferior Wall MI; Increased ICP; Medications: Digoxin; Morphine

60
ECG Sinus Arrest SA node fails to initiate electrical impulse for one or more beats May see no beats on monitor or other pacemaker cells in the heart may take over Rate: Variable ; Rhythm: Irregular Why? Hypoxia; Coronary artery disease; Hyperkalemia Beta-Blockers; CA channel blockers; Increased vagal tone

63
ECG Premature Atrial Complexes
An electrical cell within the atria fires before the SA node fires Rate: Usually closer to 100; Irregular rhythm P wave usually looks abnormal and complex occurs before it should Why? Emotional stress; CHF; Acute coronary syndromes Stimulants; Digitalis Toxicity; etc.

64
ECG

65
ECG

66
ECG

67
ECG Supraventricular Tachycardiac (SVT) S & S
Fast rhythms generated ‘Above the Ventricles’ Paroxysmal SVT (starts or ends suddenly) Rate – usually Why? Stimulants; Infection; Electrolyte Imbalance MI; Altered atrial pathway (WPW)-Kent S & S Lightheadedness; Palpitations; SOB; Anxiety; Weakness Dizziness; Chest Discomfort; Shock
 Rate – usually Why Stimulants; Infection; Electrolyte Imbalance. MI; Altered atrial pathway (WPW)-Kent. S & S. Lightheadedness; Palpitations; SOB; Anxiety; Weakness. Dizziness; Chest Discomfort; Shock.")
68
ECG

69
ECG

70
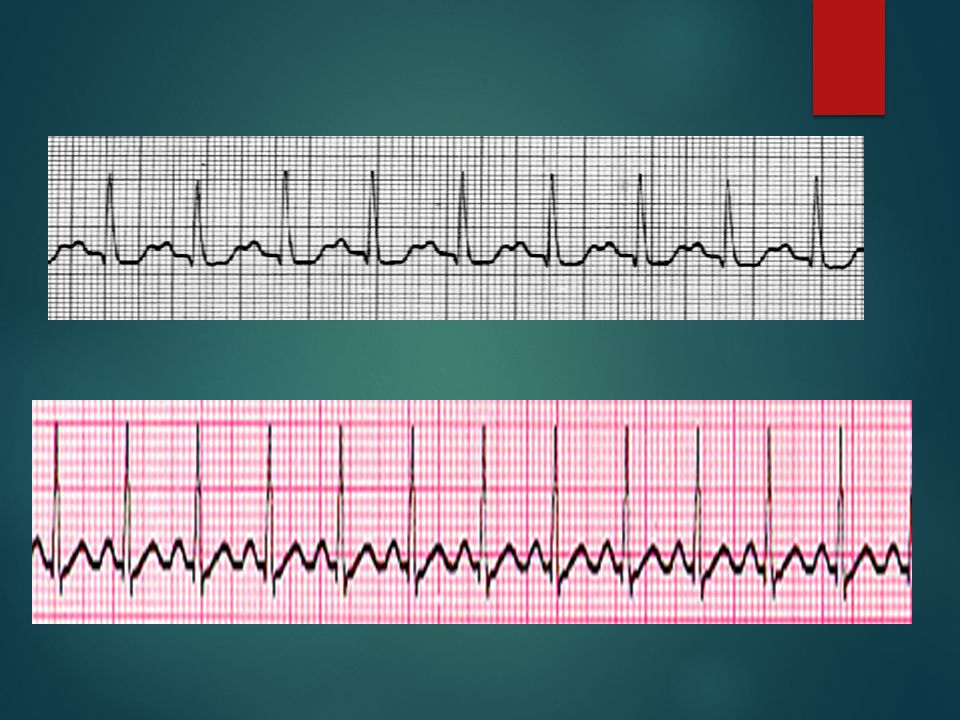
ECG Atrial Flutter Irritable focus within the atrium typically fires at a rate of about 300 bpm Waveforms resemble teeth of a saw AV node cannot conduct faster than about 180 beats/minute Atrial vs ventricular rate expressed as a ratio Why: Re-entry- Hypoxia Pulmonary embolism MI Chronic Lung disease Pneumonia etc. S & S: SOB; Weakness; Dizziness; Fatigue; Chest discomfort

71
ECG

72
ECG

73
ECG

74
ECG Atrial Fibrillation
Irritable sites in atria fire at a rate of /minute Muscles of atria quiver rather than contract (fibrillate) No P waves – only an undulating line Only a few electrical impulses get through to the ventricles – may be a lot of impulses or a few A lot of impulses (ventricular rate high- then called atrial fibrillation with rapid ventricular response) A few impulses (ventricular rate slow – then called atrial fibrillation with slow ventricular response)
 No P waves – only an undulating line. Only a few electrical impulses get through to the ventricles – may be a lot of impulses or a few. A lot of impulses (ventricular rate high- then called atrial fibrillation with rapid ventricular response) A few impulses (ventricular rate slow – then called atrial fibrillation with slow ventricular response)")
75
ECG

76
ECG

77
ECG

78
ECG Delay or interruption in impulse conduction
AV Block Delay or interruption in impulse conduction Classified according to degree of block and/or to site of block First Degree Block Impulses from SA node to the ventricles is DELAYED but not blocked Why? Ischemia Medications Hyperkalemia Inferior MI Increased Vagal Tone

79
ECG

80
ECG

81
ECG

82
ECG Lengthening of the PR interval and then QRS wave is dropped Why?
Second Degree Block Type I - Wenckebach Lengthening of the PR interval and then QRS wave is dropped Why? Usually RCA occlusion (90% of population) Ischemia Increase in parasympathetic tone Medications
 Ischemia. Increase in parasympathetic tone. Medications.")
83
ECG

84
ECG The dropped QRS

85
ECG

86
ECG Why Second Degree AV Block – Mobitz Type II Important:
Ischemia LCA – Anterior MI Organic heart disease Important: Ventricular Rate QRS duration How many dropped QRS’s in relation to P waves? What is the ratio?

87
ECG

88
ECG

89
ECG No P waves are conducted to the ventricles
Third Degree AV Block (Complete Block) No P waves are conducted to the ventricles The atrial pacemakers and ventricle pacemakers are firing independently Why? Inferior MI Anterior MI Serious
 No P waves are conducted to the ventricles. The atrial pacemakers and ventricle pacemakers are firing independently. Why Inferior MI. Anterior MI. Serious.")
90
ECG

91
ECG

92
ECG

93
ECG Are the heart’s least efficient pacemakers
Ventricular Rhythms Are the heart’s least efficient pacemakers Generate impulses at 20-40/min They assume pace-making if: SA nodes fail, very slow (below 20-40) or are blocked Ventricles site(s) is irritable Irritable due to ischemia Depolarization route is abnormal and longer, therefore QRS looks different and is wider. T wave is opposite in direction to QRS
 or are blocked. Ventricles site(s) is irritable. Irritable due to ischemia. Depolarization route is abnormal and longer, therefore QRS looks different and is wider. T wave is opposite in direction to QRS.")
94
ECG Called Unifocal (from one focus or foci)
Premature Ventricular Contractions May be from One Site and all look the same Called Unifocal (from one focus or foci)
")
95
ECG May be from Different sites (Foci) and are called Multifocal PVC’s
 and are called Multifocal PVC’s")
96
ECG May occur every other beat – Ventricular Bigeminy

97
ECG May occur every third beat – Ventricular Trigeminy

98
ECG R on T PVC

99
ECG

100
ECG Couplets (2 PVC’s in a row); Triplets (3 PVC’s in a row)
; Triplets (3 PVC’s in a row)")
101
ECG Couplets also known as ‘Salvos’.

102
ECG Run of PVC’s Ventricular Tachycardia

103
ECG Ventricular Tachycardia Defined as Three or more PVC’s occurring in a row at a rate > 100/min Wide QRS No P waves No T waves Why? Ischemia Infarction Congenital Usually lethal S & S: Weakness, Dizziness, Shock, Chest Pain,Syncope

104
ECG

105
ECG

106
ECG Torsades de Pointes (Twisting of the Points) Ventricular Tachycardia in which the QRS changes in shape, amplitude and width Causes: Hypomagnesium Hypokalemia Quinidine therapy S & S: Altered mental status, shock, Chest pain, SOB, Hypotension

107
ECG

108
ECG

109
ECG Chaotic rhythm of the ventricles Lethal if not treated Causes:
Ventricular Fibrillation Chaotic rhythm of the ventricles Lethal if not treated Causes: AMI Electrolyte Imbalance Drug OD’s Trauma Heart Failure Vagal Stimulation Increased SNS Electrocutions Congenitial Heart defects

110
ECG

111
ECG Pulseless Electrical Activity – PEA
Rhythm on monitor but no corresponding pulse Why? Look for Cause! H’s and T’s Hypoxia Toxins Hypovolemia Tamponade, cardiac Hydrogen Ion (acidosis) Tension Pneumothorax Hypo-Hyperkalemia Thrombosis (coronary or pulmonary) Hypoglycemia Trauma (Increased ICP, hypovolemia Hypothermia
 Tension Pneumothorax. Hypo-Hyperkalemia Thrombosis (coronary or pulmonary) Hypoglycemia Trauma (Increased ICP, hypovolemia. Hypothermia.")
112
ECG

113
ECG Asystole No electrical activity on monitor No pulse
Why? Look for Cause! H’s and T’s Hypoxia Toxins Hypovolemia Tamponade, cardiac Hydrogen Ion (acidosis) Tension Pneumothorax Hypo-Hyperkalemia Thrombosis (coronary or pulmonary) Hypoglycemia Trauma (Increased ICP, hypovolemia) Hypothermia
 Tension Pneumothorax. Hypo-Hyperkalemia Thrombosis (coronary or pulmonary) Hypoglycemia Trauma (Increased ICP, hypovolemia) Hypothermia.")
114
Thanks for Coming! Questions?

Similar presentations


>")
>")


>")


>")

>")