Download presentation
Presentation is loading. Please wait.

1
Laboratory Quality Control An Overview

2
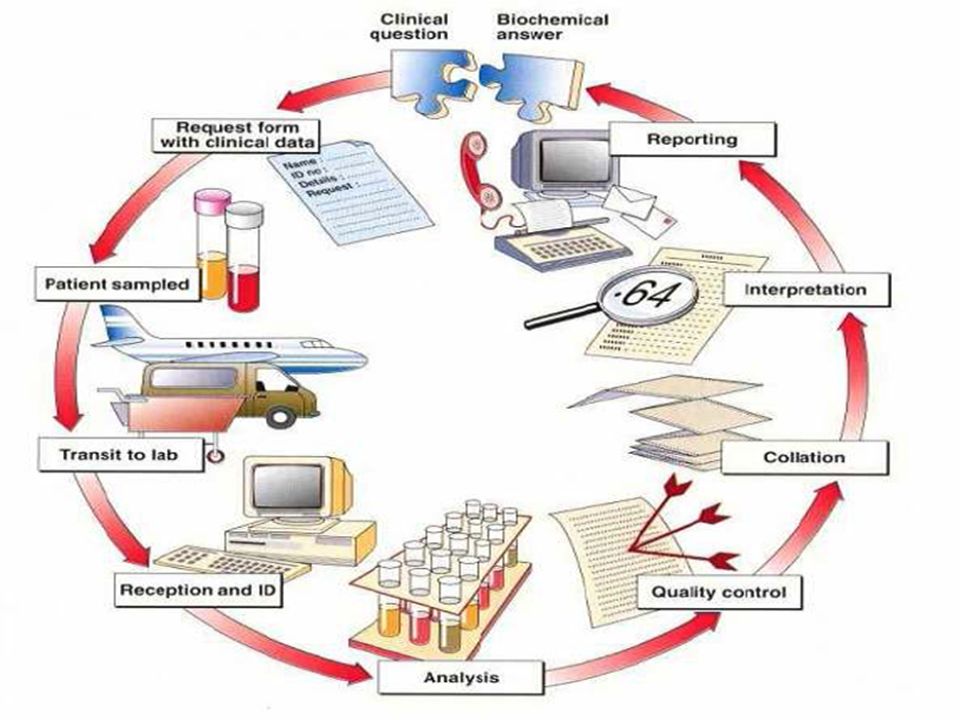
Definitions (1) Quality Control - QC refers to the measures that must be included during each assay run to verify that the test is working properly. Quality Assurance - QA is defined as the overall program that ensures that the final results reported by the laboratory are correct. The aim of quality control is simply to ensure that the results generated by the test are correct. However, quality assurance is concerned with much more: that the right test is carried out on the right specimen, and that the right result and right interpretation is delivered to the right person at the right time

3
Definitions (2) Quality Assessment - quality assessment (also known as proficiency testing) is a means to determine the quality of the results generated by the laboratory. Quality assessment is a challenge to the effectiveness of the QA and QC programs.

4
Variables that affect the quality of results The educational background and training of the laboratory personnel The condition of the specimens The controls used in the test runs Reagents Equipment The interpretation of the results The reporting of results

5
Errors in measurement True value - this is an ideal concept which cannot be achieved. Accepted true value - the value approximating the true value, the difference between the two values is negligible. Error - the discrepancy between the result of a measurement and the true (or accepted true value).
..")
6
Quality assurance and control includes: Control of pre-analytical variables: Patient preparation, Patient identification, and specimen processing and handling Control of analytical variables: Choice of analytical method, analytical specificity, and analytical precision Control of statistical methods: Gathering, analyzing and interpreting data

7
Random Errors An error which varies in an unpredictable manner, in magnitude and sign, when a large number of measurements of the same quantity are made under effectively identical conditions. Random errors create a characteristic spread of results for any test method and cannot be accounted for by applying corrections. Random errors are difficult to eliminate but repetition reduces the influences of random errors.

8
Random Errors Examples of random errors include errors in pipetting and changes in incubation period. Random errors can be minimized by training, supervision and adherence to standard operating procedures.

9
Random Errors

10
Random errors are statistical fluctuations (in either direction) in the measured data due to the precision of the measurement device. Random error can be evaluated through statistical analysis and can be reduced by averaging over a large number of observations

11
Systematic Errors An error which remains constant when measurements are made under the same conditions, or varies according to a definite law when conditions change. Systematic errors create a characteristic bias in the test results and can be accounted for by applying a correction.

12
Systematic Errors Systematic errors may be induced by factors such as variations in incubation temperature, blockage of plate washer, change in the reagent batch or modifications in testing method.

13
Systematic Errors

14
Systematic errors are reproducible inaccuracies that are consistently in the same direction. These errors are difficult to detect and cannot be analyzed statistically

15
Variables affecting lab results

17
Quality failures Classified into three major groups – Pre-analytical – Analytical – Post-analytical phases.

18
Pre-analytical variables account for 32-75% of laboratory errors, and encompass the time from when the test is ordered by the physician until the sample is ready for analysis.

19
Preanalytical phase Pre-analytic variables can be grouped broadly under three categories: 1. Physiologic factors 2. Specimen collection and handling 3. Endogenous Variables - Drugs and circulating antibodies

20
Physiologic Variables The effects of age, sex, time, season, altitude, conditions such as menstruation and pregnancy, and lifestyle are some of the physiologic variables that affect laboratory results.

21
Age Increased RBC count leading to increased glucose metabolism Neonate 3-fold increase in alkaline phosphatase level due to bone growth Growing child Creatinine clearance decreases with each decade Older patients Decrease in glucose tolerance with age

22
Gender WomenMen Women have lower levels of magnesium, calcium, albumin, hemoglobin, serum iron and ferritin. Menstrual blood loss contributes to the lower iron values Higher alkaline phosphatase, aminotransferase, creatine kinase and aldolase level than women; this is due to the larger muscle mass of men

23
Time Time of test can affect the level of some circulating analytes A classic example is Cortisol Peaks 4–6 a.m.; lowest 8 p.m. to 12 a.m.; 50% lower at 8 p.m. than at 8 a.m.; increased with stress

24
Menstruation Estradiol, FSH, LH, progesterone levels depend on stages of cycle Cholesterol level lowest at ovulation

25
Exercise Lactate can increase as much as 300%. Exercise may elevate creatine phosphokinase (CK), aspartate aminotransferase (AST), and lactate dehydrogenase (LD), and activate coagulation, fibrinolysis, and platelets These changes are related to increased metabolic activities for energy purposes and usually return to pre-exercise levels soon after exercise cessation.
, aspartate aminotransferase (AST), and lactate dehydrogenase (LD), and activate coagulation, fibrinolysis, and platelets These changes are related to increased metabolic activities for energy purposes and usually return to pre-exercise levels soon after exercise cessation..")
26
Diet Glucose and triglycerides, absorbed from food, increase after eating After 48 hours of fasting, serum bilirubin concentrations may increase. Fasting 72 hours decreases plasma glucose levels in healthy women to 45mg/dL (2.5 mmol/L), while men show an increase in plasma triglycerides, glycerol, and free fatty acids, with no significant change in plasma cholesterol
, while men show an increase in plasma triglycerides, glycerol, and free fatty acids, with no significant change in plasma cholesterol.")
27
Diet Foods such as bananas, pineapples, tomatoes, and avocados are rich in serotonin. When ingested, elevated urine excretion of 5-hydroxyindoleacetic acid may be observed

28
Diet Beverages rich in caffeine elevate plasma free fatty acids and cause catecholamine release from the adrenal medulla and brain tissue Ethanol ingestion increases plasma lactate, urate, and triglyceride concentrations Elevated (HDL) cholesterol, γ-glutamyl transferase (GGT), Urate have been associated with chronic alcohol abuse
 cholesterol, γ-glutamyl transferase (GGT), Urate have been associated with chronic alcohol abuse")
29
Specimen collection

Similar presentations


 NONPROTEIN NITROGEN (NPN) LECTURE ONE>")

) Bushehr University Of Medical Sciences Dept. OF Pathology & Lab. Medicine.>")


 LIVER FUNCTION AND THE BILIARY TRACT LECTURE FOUR Dr. Essam H. Aljiffri.>")


