Download presentation
Presentation is loading. Please wait.

1
Measuring Disability: Results from the 2001 Census and the 2001 Post-Censal Disability Survey Statistics Canada January 10, 2003

2
Post-Censal Survey Approach §First phase: 2001 Census §Second phase: Participation and Activity Limitation Survey - PALS 2001

3
Objective §develop a comprehensive database on persons with disabilities: l to assist social policy development by governments of all levels l to support research in the area of disability

4
Survey Description §PALS collects information on: l type and severity of disabilities l needs and unmet needs for assistive devices and social support l disability impacts in various environments: home life; school or work; community life l socio-demographic characteristics of persons with disabilities

5
Definition of Disability §Conceptual framework provided by the International Classification of Functioning, Disability and Health (ICF) §an activity limitation or participation restriction associated with physical or mental conditions or health problems, recognizing the role of the environment as providing barriers or facilitators
 §an activity limitation or participation restriction associated with physical or mental conditions or health problems, recognizing the role of the environment as providing barriers or facilitators")
6
PALS Target Population §Adults (15 and over) and children (under 15): l residing in households l residing in all provinces l reporting an activity limitation §Exclusions: l population in three northern territories l institutional residents l persons living on First Nations reserves
 and children (under 15): l residing in households l residing in all provinces l reporting an activity limitation §Exclusions: l population in three northern territories l institutional residents l persons living on First Nations reserves")
7
Overview of Methodology §Two-phase survey §Population selected through two filter questions on 2001 Census questionnaire §Respondents contacted by phone about four months after census §PALS repeats filter questions and uses additional disability screening questions

8
2001 Filter Questions 1. Does this person have any difficulty hearing, seeing, communicating, walking, climbing stairs, bending, learning or doing any similar activities? - Yes, sometimes - Yes, often - No

9
2001 Filter Questions (cont ’d) 2. Does a physical condition, mental condition or health problem reduce the kind or amount of activity this person can do: At home?- Yes, sometimes - Yes, often - No At work or at school?- Yes, sometimes - Yes, often - No - Not applicable In other activities, such as transportation or leisure? - Yes, sometimes - Yes, often - No

10
2001 PALS Operational Definition 1. Selection of sample of positive respondents to census filter questions 2. Population with disabilities = YES to filters at census and YES to filters at PALS or YES to detailed disability screening questions in PALS

11
NO YES Not sampled Filter Questions (PALS) YES In population NO Screening Questions (PALS) YES NO Not in population Filter Questions (Census) Operational Definition
 YES In population NO Screening Questions (PALS) YES NO Not in population Filter Questions (Census) Operational Definition")
12
Data Collection §Mostly telephone interviews §Personal interviews when required because of activity limitation §Proxy interviews kept to minimum §Paper and pencil questionnaires §September 2001 to January 2002

13
Sample Size §Total sample size = 43,000 l 35,000 adults l 8,000 children §Response rate: 82.5%

14
Adult Questionnaire Content §Detailed disability screening questions l derived variables include type and severity of disability §Aids and assistive devices required l needs and unmet needs l information on costs §Help with everyday activities l needs and unmet needs l information on providers and costs

15
Adult Questionnaire (cont ’d) §Impacts on education l aids and services required §Employment status l aids and services required l impacts on employment §Social participation l transportation, leisure, housing §Economic characteristics l sources of income, insurance coverage
 §Impacts on education l aids and services required §Employment status l aids and services required l impacts on employment §Social participation l transportation, leisure, housing §Economic characteristics l sources of income, insurance coverage")
16
Child Questionnaire Content §Detailed disability screening questions l derived variables include type and severity of disability §Aids and assistive devices required l needs and unmet needs l information on costs §Help with everyday activities l including impact on the family

17
Child Questionnaire (cont ’d) §Child care issues §Impacts of disability on schooling §Impacts on leisure and recreation §Accommodations required in the home §Transportation requirements §Economic characteristics of the family
 §Child care issues §Impacts of disability on schooling §Impacts on leisure and recreation §Accommodations required in the home §Transportation requirements §Economic characteristics of the family")
18
SEVERITY SCALE

19
1. Adult Severity Scale 1.1 Disability types and variables §10 disability types: l hearing, seeing, speech, mobility, agility, pain, learning or developmental, memory, psychological §Points for each functional limitation within each disability type l ex. difficulty hearing in a conversation with one person, at least 3 persons, telephone conversation

20
Number of functional limitations and contexts for each disability type

21
1.2 Scoring Method §One point for each functional limitation weighted by the product of the frequency and the intensity l frequency: yes sometimes (1 pt), yes often (2 pts) l intensity: some difficulty (1 pt), a lot of difficulty (2 pts), completely unable (3 pts) §Mean number of points per applicable context §0 to 1 standardised score for each disability type l Combining all applicable functional limitations §Scores for each type added up and divided by 9 l global score between 0 and 1
, yes often (2 pts) l intensity: some difficulty (1 pt), a lot of difficulty (2 pts), completely unable (3 pts) §Mean number of points per applicable context §0 to 1 standardised score for each disability type l Combining all applicable functional limitations §Scores for each type added up and divided by 9 l global score between 0 and 1")
22
Distribution of Severity Score

23
1.3 Cut-off points §No natural cut-offs in global score distribution §Need simple method, easy to eplain §First cut-off where score curve accelerates l Cut-off very close to 1/9 (max #pts for one type only) §Subdivision of the 2 groups into 4 groups l Mildscore < 1/18 l Moderate(1/18 score < 1/9) l Severe(1/9 score < 2/9) l Very severe score 2/9
 §Subdivision of the 2 groups into 4 groups l Mildscore < 1/18 l Moderate(1/18 score < 1/9) l Severe(1/9 score < 2/9) l Very severe score 2/9")
24
2. Children Severity Scale §Same principles as adult scale §One scale for 0-4 years old l 4 disability types : hearing, seeing, developmental delay, chronic condition l 2 severity groups only §One scale for the 5-14 years old l 9 disability types: hearing, seeing, speech, walking, dexterity, learning or developmental disability, psychological, chronic condition l 4 severity groups as for the adults

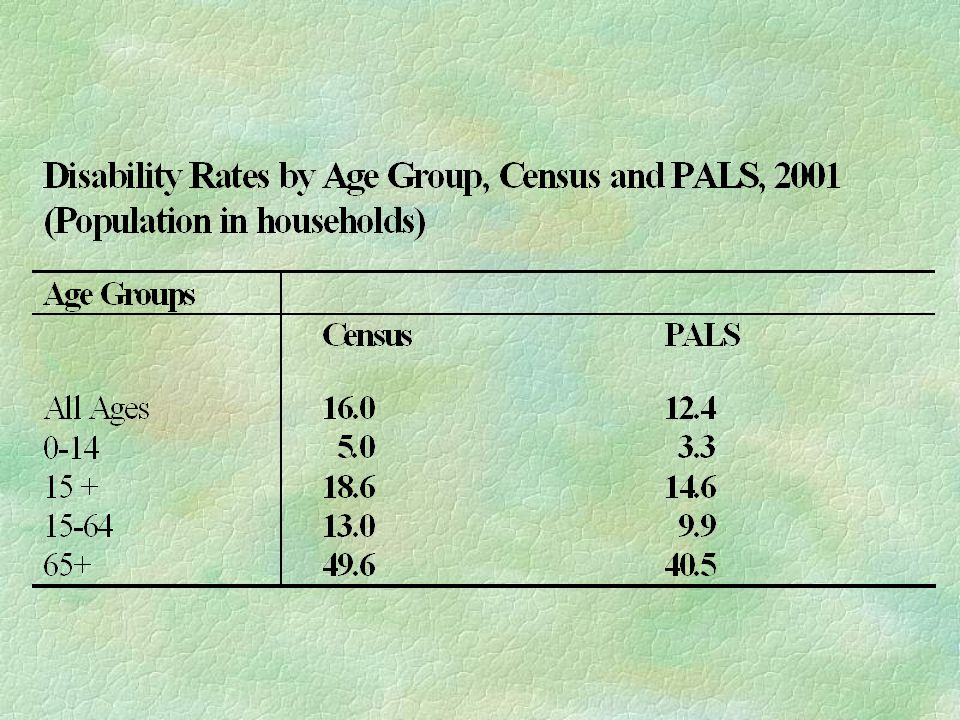
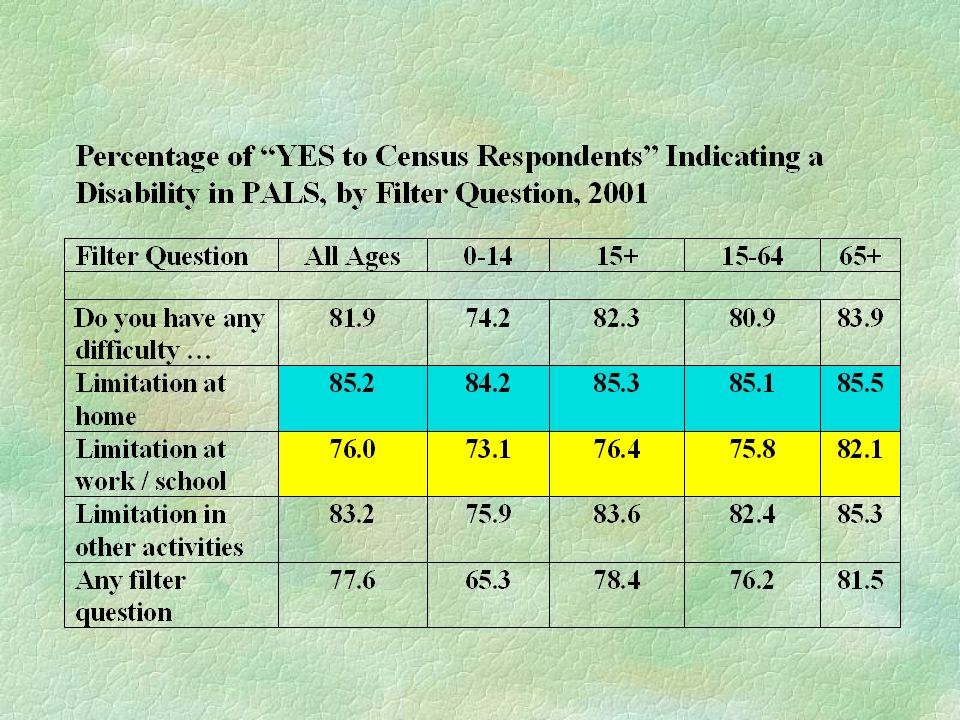
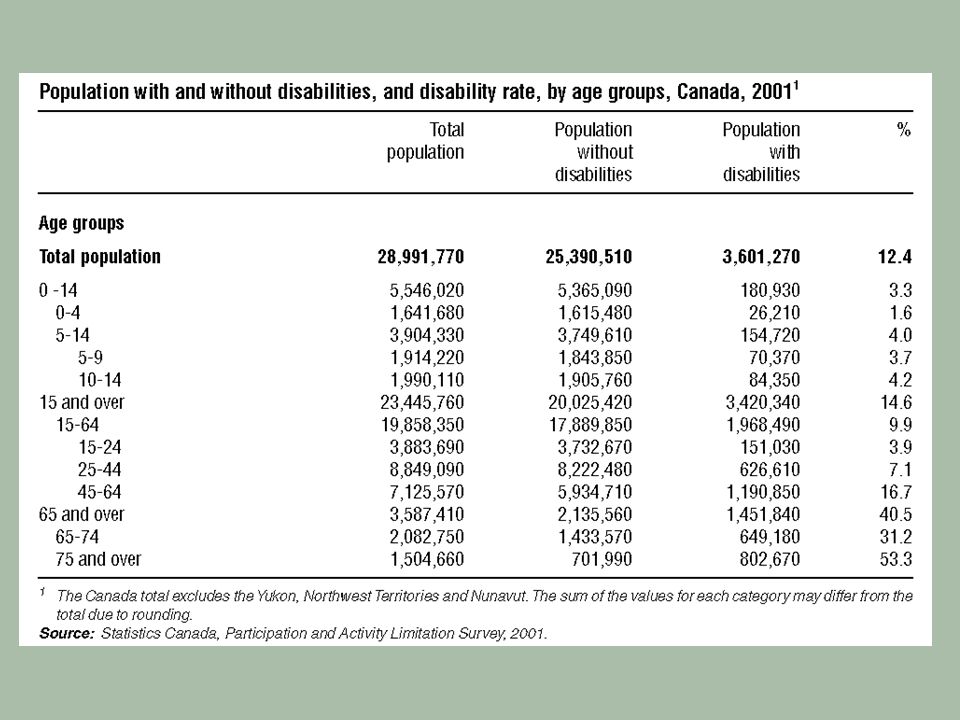
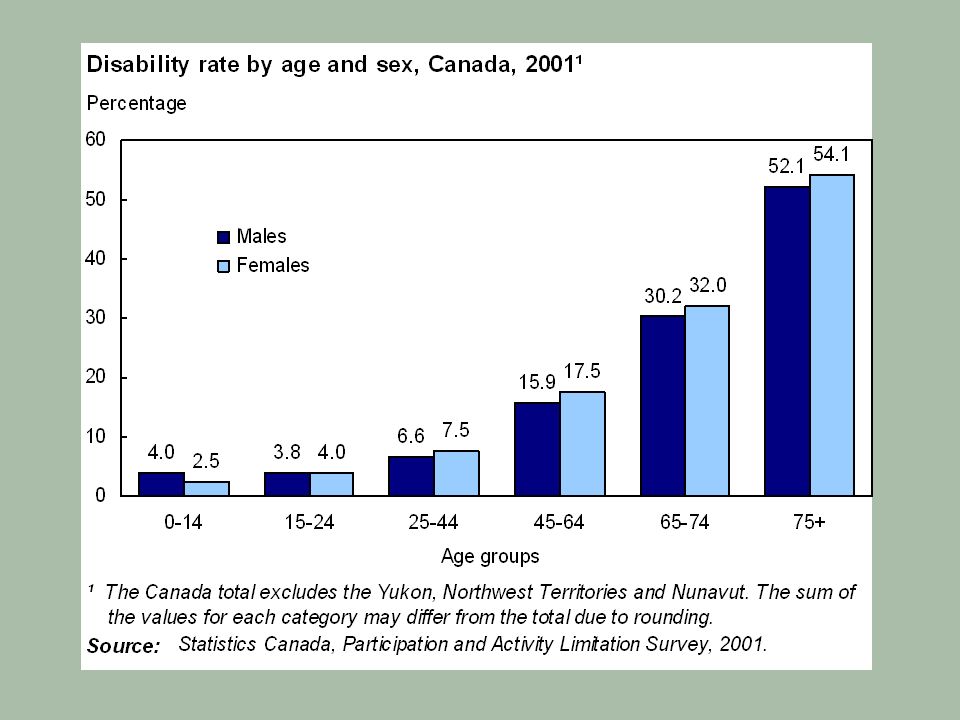
25
RESULTS 2001 Census 2001 PALS

34
NEXT STEPS §Further analysis of disability rates from filter questions in surveys §development of severity scale for filter questions §analysis of characteristics of disabled population identified in various surveys

Similar presentations