Download presentation
Presentation is loading. Please wait.

1
Dr. Robert Wisner: Grain Outlook 3/15/06 Iowa State University Extension Ethanol & Its Implications for Agriculture 2/15/07 Dr. Robert Wisner, University Professor & Extension Economist

2
Presentation Outline Global forces that will determine size of industry Detail on Iowa Ethanol The national picture

3
The Corn Market Setting for 2006-07 Second-highest U.S. yield/A. on record Corn crop 1.3-1.4 bushels below expected demand (2nd year of short-fall vs. demand) Corn processing for ethanol to be up 34% from 2005-06 Plants under construction have 2.13 Bil. Bu. capacity – all should be on line in 16-20 months Corn processing increases next 2 years likely 32-40 percent per year (55% of ’06 Crop by 2010) Iowa top ethanol producing state World grain stocks low
 Corn processing for ethanol to be up 34% from Plants under construction have 2.13 Bil. Bu. capacity – all should be on line in months Corn processing increases next 2 years likely percent per year (55% of ’06 Crop by 2010) Iowa top ethanol producing state World grain stocks low.")
8
March Crude Oil Futures 2/07/07

9
Mar. N.Y. Gasoline Futures 2/2/07

10
Feb. Ethanol Futures 2/2/07

11
July 2007 Corn 2/07/07

12
July 2007 Soybeans 2/14/07

13
March 2007 Soy Oil 2/07/07

14
State Average Ethanol Rack Prices http://www.axxispetro.com/ace.shtml www.ethanol.org Date: 2/02/07 Iowa: 1.95 Illinois: 2.05 Kansas: 2.05 Michigan: 2.29 Minnesota: 1.89 Missouri: 2.24 North Dakota: 1.91 Nebraska: 2.01 South Dakota: 1.99 Wisconsin: 2.16 Averages provided by:

17
Ethanol Economics $0.10 increase in ethanol price raises break-even Corn price $0.28/bu. $1.00 rise in corn price increases cost/gal. $0.36 Ethanol prod’n cost $1.30/gal. (Minnesota- @$2 corn) Cost increases about $0.36/gal. for each $1 increase in corn 1/29/07 ethanol price: $1.91/gal. December 06 margins: $0.64/gal. (incl.$.51credit) 1/29/07: Drops to zero @ corn price of about $3.70 corn in IA ($4.10 with USDA costs) Other variables: DDGS price, Natural Gas
 Cost increases about $0.36/gal. for each $1 increase in corn 1/29/07 ethanol price: $1.91/gal. December 06 margins: $0.64/gal. (incl.$.51credit) 1/29/07: Drops to corn price of about $3.70 corn in IA ($4.10 with USDA costs) Other variables: DDGS price, Natural Gas.")
18
Late Dec. ‘06 1/29/07

19
Monthly Crude Oil futures

22
Iowa Corn Processing Plants Annual Capacity Operating Plants 970 mil. bu. Expanding Plants 282 New, Under Construction 198 Planned 1,246 Potential total rated capacity 2,761 mil. bu. Equals 137% of 2006 Iowa Corn Crop 1/29/07

24
Capacity: 137% of 2006 Crop Iowa Corn Processing Plants, Current & Planned, 2/02/07 69 Potential Iowa Plants 11 Just across IA Borders

25
* Needed corn Acres @ 188 bu./A. state avg. in 2010 **

27
Figure 2. 8/30/06

28
U.S. Corn Acres Needed, 2007? Production deficit: 2006 = 1,300 mil. Bu. New ethanol demand (45-50% of current construction): 950-1,060 mil. Bu. Export + feed shrinkage: 350-400 mil. Bu.? Total short-fall: 1,850 to 1,960 mil. Bu. Potential carryover decrease, ’07-08: 0.0 Needed extra harv. acres: 11.6-12.3 Mil. A. @ 160 Bu./A. on all acres (U.S. +13% to +14%) Still Leaves Potential Very Tight Supply With Excellent Weather
: 950-1,060 mil. Bu. Export + feed shrinkage: mil. Bu.. Total short-fall: 1,850 to 1,960 mil. Bu. Potential carryover decrease, ’07-08: 0.0 Needed extra harv. acres: Mil. 160 Bu./A. on all acres (U.S. +13% to +14%) Still Leaves Potential Very Tight Supply With Excellent Weather.")
29
Needed Yld. @ current Acres

30
5.5 Bil. Bu for ethanol

31
How Much More Construction to Reach 5.5 Bil. Bu. Corn for Ethanol? Estimated 2006-07 corn for ethanol: -- 2.15 Bil. Bu. Processing capacity under construction: -- 2.13 Bil. Bu. Plants breaking ground & soon to build: -- 0.3 Bil. Bu. Total: 4.58 Bil. Bu. Capacity yet to break ground to reach 5.5 Bil. Bu.: 0.92 Bil. Bu. Total U.S. Planned & Proposed Plants not Included Above: Approx. 5.9 Bil. Bu.

32
5.5 Bil. bu. Corn for ethanol

33
Potential U.S. DGS demand by 20 Potential U.S. DGS demand by 2012 COF @ 20% of ration 7.1 mil. T. Dairy @ 20% of ration 6.13 mil. T. Hogs@15% of ration 6.72 mil. T. Total 19.95 mil.T. Potential production Potential production 46.8 Mil. T. 5.5 Bil. Bu for ethanol With 6.5 bil. Bu.: 51.8 Mil. T

38
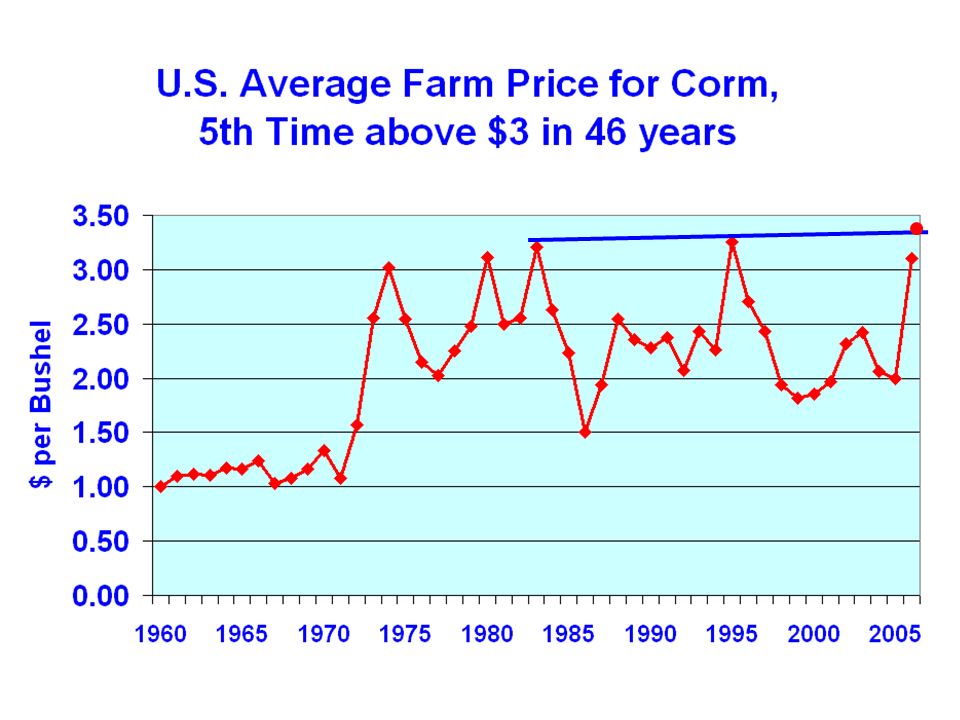
U.S. Annual Average Corn Price, 1908-2005 Data Source: USDA/NASS 1908-1942 35 years Avg $0.78 1942-1972 30 years Avg $1.26 1973-2005 33 years Avg $2.37

39
Source of data: USDA, NASS

41
Source: Dr. Terry Francel, American Farm Bureau Federation

43
* Included in Food, Ind. & Seed

46
Implications of Emerging Energy Market A lot more corn acres will be needed Corn prices: increasingly volatile & weather-sensitive Basis opportunities will be greater More storage, handling capacity needed Winter & spring 2006-07: look for periods of higher corn, SB prices, strong basis Cautions about selling 2008 and later crops Corn, biodiesel to pull bean prices up Options may be useful in managing risks Rent & Land Value Implications

47
Key Issues for Agriculture Alternative feedstocks: which ones, how soon? Biomass, sweet sorghum, sugar beets, high-oil crops, cane sugar, others Differential impacts on livestock & poultry species Environmental: continuous corn, off-take of biomass, erosion-prone land Efficient use of distillers grain, including new uses Risk Management: livestock, crops, ethanol

48
Key Issues for Agriculture, II Future transition of corn-ethanol plants to other feedstocks Policy issues: import tax, blending credit, LDPs, CCPs, E-85 vs. E-10, pipeline possibilities, vehicle redesigning, Hydrogen sources Global developments: EU biodiesel, Brazil export potential, Asia, S. Africa bioenergy & global grain supply, demand & prices Infrastructure needs: grain handling & storage, transportation, ethanol & ddgs transport High Prices encourage oil exploration & conservation

49
Farmland Price Implications Big jump in price of top-quality farmland in last 2 months Cash rents almost certain to increase sharply in 2007 Value of all qualities of farmland likely to increase Pressure on cropland to bring some pasture & hay land into row crops CRP: release of acres will be slow

50
Should you shift bean acres to corn? Market says yes How much yield drag? Impacts of shorter planting & harvest seasons? Ability to move, handle, & store more corn? Soil types? Availability of top corn seed varieties?

51
What Could Change These Prospects? Accelerated corn yield increases Crude oil price collapse Break-through in economical biomass conversion Ethanol import tax removed – longer term impacts $0.51 blending credit reduced Declining livestock feeding

52
Source: Dr. John Lawrence, ISU Extension Economist & Director, Iowa Beef Center Need for Both Ethanol and Animal Agriculture 100 million gallon ethanol plant –37 million bushels of corn –80 workers directly employed 37 millionbucornDirect jobs Farrow-finish800 Or Wean-finish242 Or Beeffeedlot278

54
...and justice for all The U.S. Department of Agriculture (USDA) prohibits discrimination in all its programs and activities on the basis of race, color, national origin, gender, religion, age, disability, political beliefs, sexual orientation, and marital or family status. (Not all prohibited bases apply to all programs.) Many materials can be made available in alternative formats for ADA clients. To file a complaint of discrimination, write USDA, Office of Civil Rights, Room 326-W, Whitten Building, 14th and Independence Avenue, SW, Washington, DC 20250-9410 or call 202-720-5964. Issued in furtherance of Cooperative Extension work, Acts of May 8 and June 30, 1914, in cooperation with the U.S. Department of Agriculture. Jack M. Payne, director, Cooperative Extension Service, Iowa State University of Science and Technology, Ames, Iowa.
 prohibits discrimination in all its programs and activities on the basis of race, color, national origin, gender, religion, age, disability, political beliefs, sexual orientation, and marital or family status. (Not all prohibited bases apply to all programs.) Many materials can be made available in alternative formats for ADA clients. To file a complaint of discrimination, write USDA, Office of Civil Rights, Room 326-W, Whitten Building, 14th and Independence Avenue, SW, Washington, DC or call Issued in furtherance of Cooperative Extension work, Acts of May 8 and June 30, 1914, in cooperation with the U.S. Department of Agriculture. Jack M. Payne, director, Cooperative Extension Service, Iowa State University of Science and Technology, Ames, Iowa..")
Similar presentations


 957-5790>")
