Download presentation
Presentation is loading. Please wait.

1
Ohio Statewide Model Passenger Transit Calibration Pat Costinett Greg Erhardt Rebekah Anderson

2
Ohio Statewide Model Needs Study Conducted in 1998/99 Primary Goals reducing / minimizing / avoiding roadway congestion and delay; sustaining and improving the state economy; freight planning, particularly with regard to the management of truck traffic and the potential for shifting it to other routes and modes

3
Ohio Statewide Model Secondary Goals Include: supporting multi-modal/inter-modal options for travel, passenger and freight improving conditions for non-auto (and non- single-occupant auto) mode services Passenger Models Are Applied Disaggregately and Are Tour-Based
 mode services Passenger Models Are Applied Disaggregately and Are Tour-Based")
4
Disaggregate Household Synthesis and Employment Spatial Disaggregation Models Aggregate Commercial Vehicle Model Disaggregate Commercial Vehicle Model Interregional Economic Model Aggregate Demographic Model Land Development Model Activity Allocation Model Visitor Model Long Distance Travel Model Short Distance Travel Model Assignment Model Ohio Integrated Land Use/Economic/ Transport Model

5
Passenger Mode Choice Models Short Distance Tours – Under 50 miles Walk or Drive to MPO Transit Long Distance Tours – Inside “Model Area” Allow all Transit Alternatives Long Distance Tours – E-E or I-E Apply “Static” Mode Shares by Distance

6
Mode Choice Transit- Drive HSR- Drive HSR- Walk Transit- Walk AirAuto 0.5 0.65 High Speed Rail only in future-years

7
Networks Highway Including Ohio Turnpike Transit MPO Transit Greyhound Amtrak High Speed Rail Air Freight Highway Rail

8
Ohio Networks

9
Ohio Transit Networks - Local 1098 Local Transit Lines

10
Greyhound and Amtrak - 2000 55 Greyhound Routes 4 Amtrak Trains Added Links to Connect Greyhound and Amtrak Stations

11
Air Network Used 1999 10% Airline Ticket Sample to Select City-Pairs that Have More than 10 Trips/Day Ft. Wayne – Cvd Dayton – Cvd Cincinnati - Cvd

12
Ohio Hub Study MWRRI – Completed Update in 2004 Ohio Hub Study Undertaken to Complement the MWRRI – 2005 with 2007 Update 2 Scenarios Modern Scenario – 79 mph speeds High Speed Scenario – 110 mph speeds

13
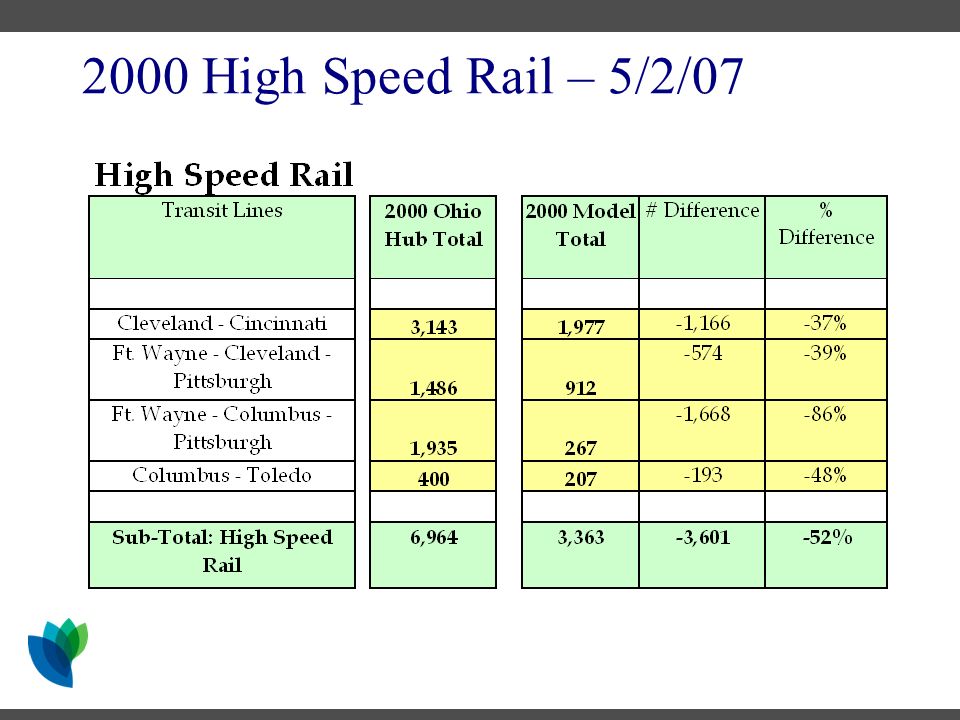
Ohio Hub Pittsburgh – Cleveland – Toledo – Ft. Wayne Cleveland – Columbus – Cincinnati Pittsburgh – Columbus – Ft. Wayne Columbus – Toledo

14
Internal Mode Choice VariableHouseholdWork-RelatedOther AssertedCalibratedAssertedCalibratedAssertedCalibrated In-Vehicle Time-0.005-0.010-0.005 Walk-Access Time-0.010-0.020-0.010 Drive-Access Time-0.010-0.020-0.010 Wait TimeUp to 60 minutes-0.010-0.020-0.010 > 60 minutes-0.0025-0.005-0.0025 Daily Frequency of Service (Air)0.0500.1000.050 Cost (cents)Income $0-20k-0.00120-0.00080-0.00120 Income $20-60k-0.00045-0.00030-0.00045 Income $60k+-0.00023-0.00015-0.00023 Transit-High Speed Rail Nest0.650 Transit Walk-Drive Nest0.500 High Speed Rail Walk-Drive Nest0.500 Air Constant0-5.8550-4.8710-6.374 Transit Constant0-2.3970-1.7390-2.347 Asserted based on review of literature Cannot determine access mode from survey
 Cost (cents)Income $0-20k Income $20-60k Income $60k Transit-High Speed Rail Nest0.650 Transit Walk-Drive Nest0.500 High Speed Rail Walk-Drive Nest0.500 Air Constant Transit Constant Asserted based on review of literature Cannot determine access mode from survey")
15
External Mode Choice VariableHouseholdWork RelatedOther EstimatedCalibratedEstimatedCalibratedEstimatedCalibrated ConstantWalk -4.806-7.264-6.736-5.457-7.023 Drive Air - 19.856 - 20.779 - 16.377 - 16.291 - 16.510 - 16.962 Log(Distance), applied to Air2.7042.4722.289 Income $60k+, applied to Air0.4381.2940.745 Final likelihood-99-111-407 ρ² w.r.t. zero0.7740.4030.765 ρ² w.r.t. constants0.2680.3910.321 Increases Air share as a function of distance

16
2000 Validation Efforts System Ridership by MPO – Good Data Greyhound Ridership by City Pair - Annual Amtrak Ridership by City Pair – Annual

17
2000 Validation – 4/30/07

18
2000 Validation – 5/2/07

19
2000 Validation – 5/4/07

20
2000 Validation – 5/2/07

21
2000 Validation – 5/4/07

22
2000 Validation – 5/2/07

23
2000 Validation – 5/4/07

24
2030 Calibration Efforts Mode / Line Totals Passenger Miles / Average Trip Lengths Annual Passengers by City Pair

25
2000 High Speed Rail – 5/2/07

30
Rebekah Anderson – 614-752-5735 Ohio DOT Greg Erhardt – 415-243-4638 Pat Costinett – 206-382-5218 PB

Similar presentations


 January 25, 2013.>")
 vs. Metropolitan Planning Organizations (MPO): A comparison 14 th TRB National.>")


