Download presentation
Presentation is loading. Please wait.

1
© 2014 American Orthotic & Prosthetic Association All rights reserved

2
YOUR LIMB LOSS/LIMB IMPAIRED BENEFICIARIES MOBILITY SAVES LIVES & MONEY Your beneficiaries are dependent upon you to provide the care they need for their recovery. Finding and utilizing a clinician you trust is key to member improved outcome and satisfaction. Costs of co-morbid conditions – obesity, diabetic risks, depression – in immobile patients extract quantifiable toll.

3
CASE FOR O&P CARE BUILDS October, 2013 NEJM article demonstratively proved favorable impact of orthotic braces for scoliosis. Colorado state study showed costs of O&P more than offset by savings. An entry level Masters requirement raises the bar on training/expertise. Ten dedicated schools assuring optimal expertise of trained professionals.

4
WHAT’S NEW? - O&P CARE SAVES $$$ O&P clinicians are educated, experienced, and a valued resource to the physicians for all aspects of care for mobility-impaired patients. The Dobson-DaVanzo Study demonstrates the value of your payment in terms of both patient recovery and cost savings.

5
O&P CARE IS NOT A COSTER For the First Time Solid Empirical Data Demonstrates that O&P Care is Cost Effective—Generally Saving Payers Money and Is Not a Coster.

7
Cost Effectiveness of Orthotic & Prosthetic Interventions in Reducing Total Medicare Expenditures A study conducted using, with the permission of the Medicare system, a custom cohort database of Medicare by Dobson-DaVanzo Commissioned by the Amputee Coalition, with grant support from the American Orthotic & Prosthetic Association

8
O&P DELIVERS ROI TO PAYERS WITHIN 12-18 MONTHS In addition to economic comparisons of the costs of their Medicare services, indicators of enhanced recovery, risk reduction and lifestyle factors were also examined. The hypothesis was that the cost of treatment would be cost justified thus providing the payer a return on his investment.

9
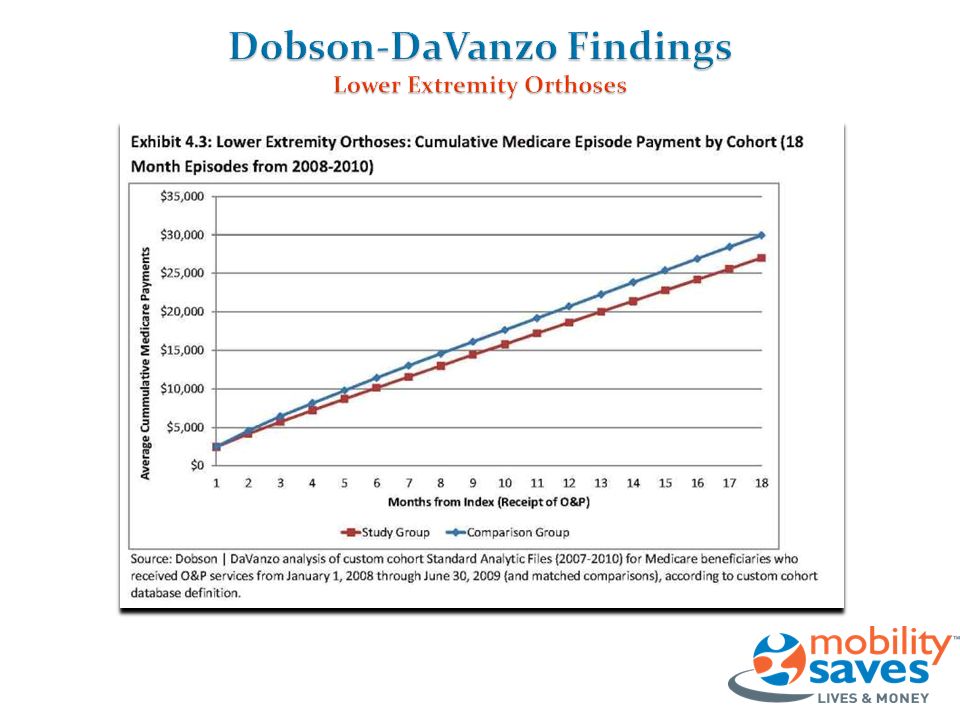
ALL HEALTH COSTS OVER 4 YEARS THOSE RECEIVING O&P CARE VS. THOSE WHO DIDN’T The study analyzed the Medicare Claims database for patients with similar diagnoses. Possible treatment pathways included the provision of lower limb orthoses, spinal orthoses, and lower limb prostheses or no intervention. The research design separated patients into two groups for each of the three therapies. One group received treatment. The other did not. The study determined their cost history for medical care following O&P intervention versus costs for those not receiving treatment.

10
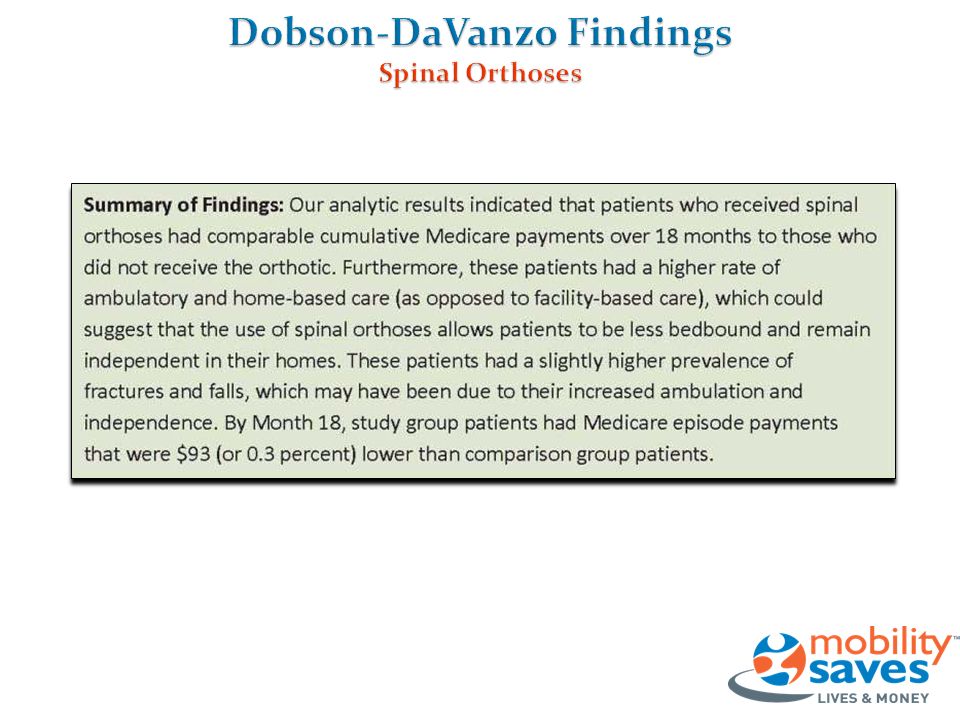
Lower Limb Orthoses & Spinal Orthoses The conclusions for both orthotics cases show the cumulative Medicare costs over the 18 months following receipt of the orthotic intervention were less than the population that did not receive the treatment.

15
Lower Limb Prostheses With respect to the prosthetic intervention, the cumulative cost comparison demonstrated that the cohort that received the prosthesis had about 1% higher costs compared to the population that did not receive the device. The slope of the cumulative cost curve indicates that had the period of evaluation been longer the break- even would have been reached.

19
QOL, INDEPENDENCE ↑ AT NO NET PAYER COST The prosthetic patients could experience better quality of life and increased independence compared to patients who did not receive the prosthetic at essentially no additional cost to Medicare or to the patient.

20
MEDICARE DATA PROVES O&P VALUE These conclusions are extraordinarily significant in that for the first time actual data prove the value of an O&P intervention based on economic criteria. In addition, there are other soft benefits in the form of quality of life, enhanced mobility and the opportunity to more fully participate in earning a living and enjoying life.

21
DATA REBUTS ASSUMPTION THAT HIGHER K-LEVELS COST MORE Looking forward to working together to understand other outstanding benefits of identified issues and findings. (K1/K2 vs. K3/K4) K Levels – Medicare’s way to define potential amputee mobility. (K1 Lowest to K4 Highest)
 K Levels – Medicare’s way to define potential amputee mobility. (K1 Lowest to K4 Highest).")
22
PATIENTS WITH LESS ADVANCED PROSTHESES (K1 & K2) COST PAYERS MORE K3/K4 – Involves larger upfront investment in prosthesis. Data shows K1/K2 patients have higher total healthcare costs, more occupational & physical therapy, and larger reliance on SNF and home health care compared to K3/K4 patients. (Despite K3/K4’s higher prosthetic costs) Further Study Being Pursued
 Further Study Being Pursued.")
23
MORE TO COME Stay tuned for additional value ideas on clinical scenarios and the accompanying positive reimbursement benefits.

Similar presentations


>")
 State Healthcare.>")
 State Healthcare.>")


