Download presentation
Presentation is loading. Please wait.

1
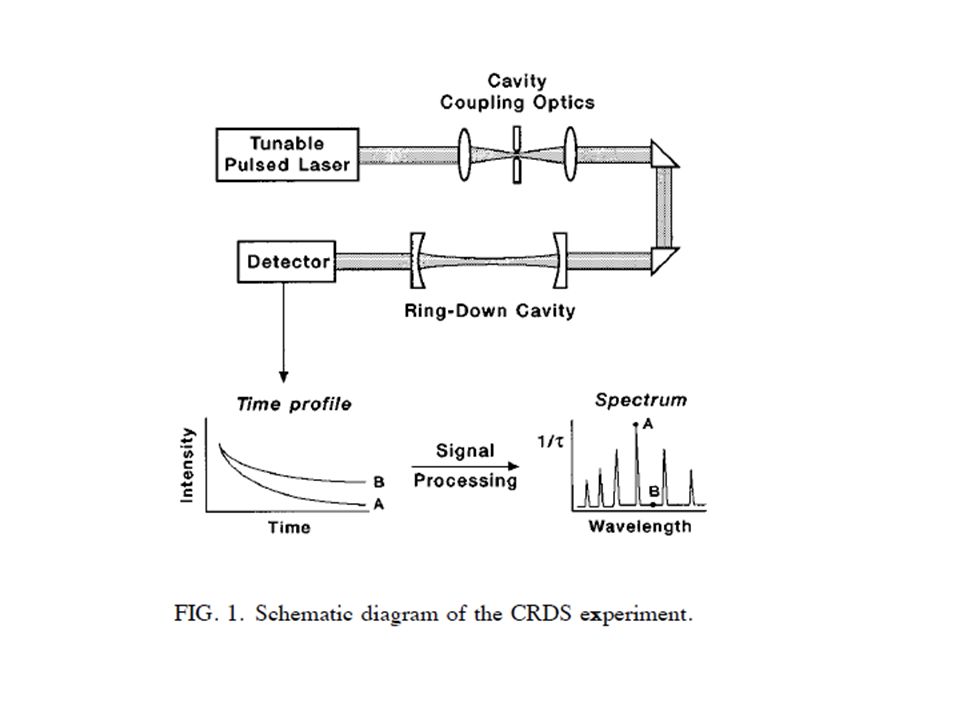
cavity ring down spectroscopy 14 February 2012 CE 540

2
history: first work in early 1980’s to determine mirror reflectivities in laser applications operated using red laser line 632nm (e.g. laser gyroscopes) mirrors were getting so good (>99.99% efficiency) that measuring them was hard first work Herbelin et al (1980)App. Op. 19, 144 Anderson et al 1984, Appl. Optics 23, 1238 pulsed dye laser (many wavelengths) development of high quality dielectric dichroic mirrors
 mirrors were getting so good (>99.99% efficiency) that measuring them was hard first work Herbelin et al (1980)App. Op. 19, 144 Anderson et al 1984, Appl. Optics 23, 1238 pulsed dye laser (many wavelengths) development of high quality dielectric dichroic mirrors.")
3
CRD Optics

10
CSU thesis

13
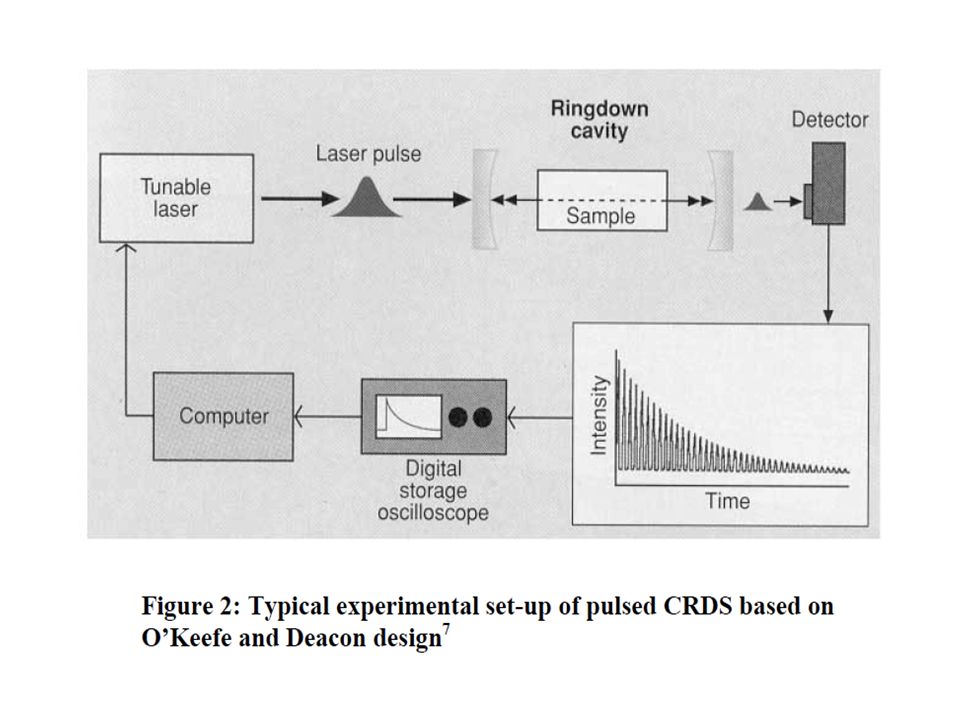
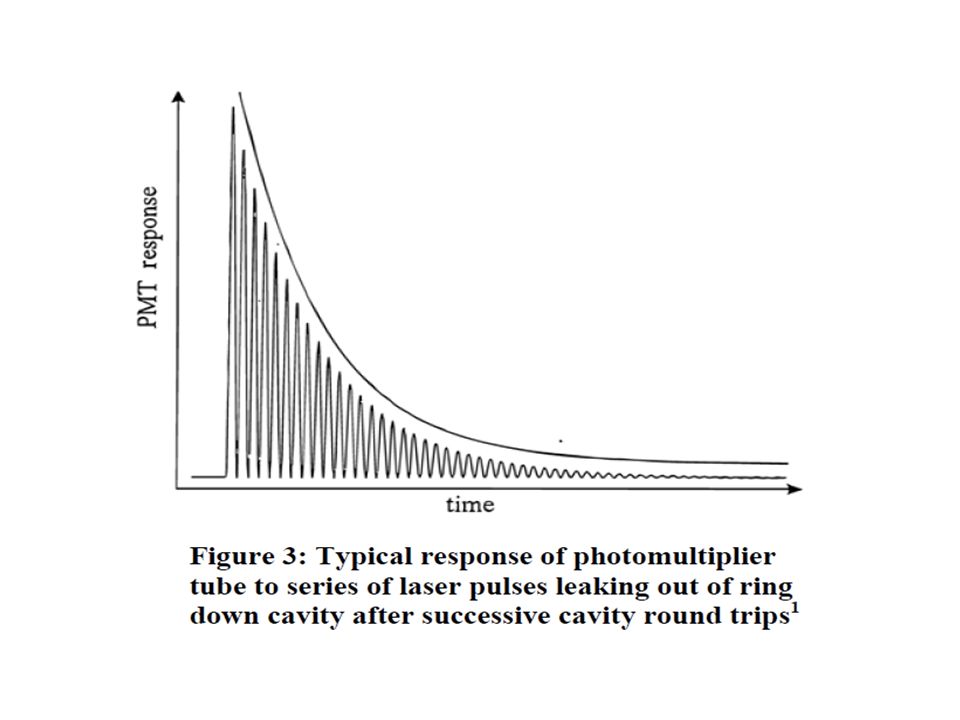
I(t) = I o exp(-t/ o ) [assuming index of refraction n = 1], simple exponential decrease I(t) / I o = exp(-t/ o ) for cavity ring down time of t = o time for intensity to drop by 1/e for an empty cavity, the decay constant is dependent on the loss mechanisms within the cavity = mainly mirror reflectivity. If L is the cavity length and c the speed of light, then R = = exp{-L/(c o )} where (c o )/L # cell reflections to 1/e intensity ln (R) = L/(c o ) o = L/(c ln(R)) but ln(R) = 1 – R for R near 1 o = L / {c(1 – R)} [sec] cavity intensity as a function of time: L = 50cm, decay time o = 30µs R = 0.99994 and # round trips ~10,000 total path length 10km
![I(t) = I o exp(-t/ o ) [assuming index of refraction n = 1], simple exponential decrease I(t) / I o = exp(-t/ o ) for cavity ring down time of t = o time for intensity to drop by 1/e for an empty cavity, the decay constant is dependent on the loss mechanisms within the cavity = mainly mirror reflectivity.](http://images.slideplayer.com/26/8746047/slides/slide_13.jpg "If L is the cavity length and c the speed of light, then R = = exp{-L/(c o )} where (c o )/L # cell reflections to 1/e intensity ln (R) = L/(c o ) o = L/(c ln(R)) but ln(R) = 1 – R for R near 1 o = L / {c(1 – R)} [sec] cavity intensity as a function of time: L = 50cm, decay time o = 30µs R = and # round trips ~10,000 total path length 10km.")
14
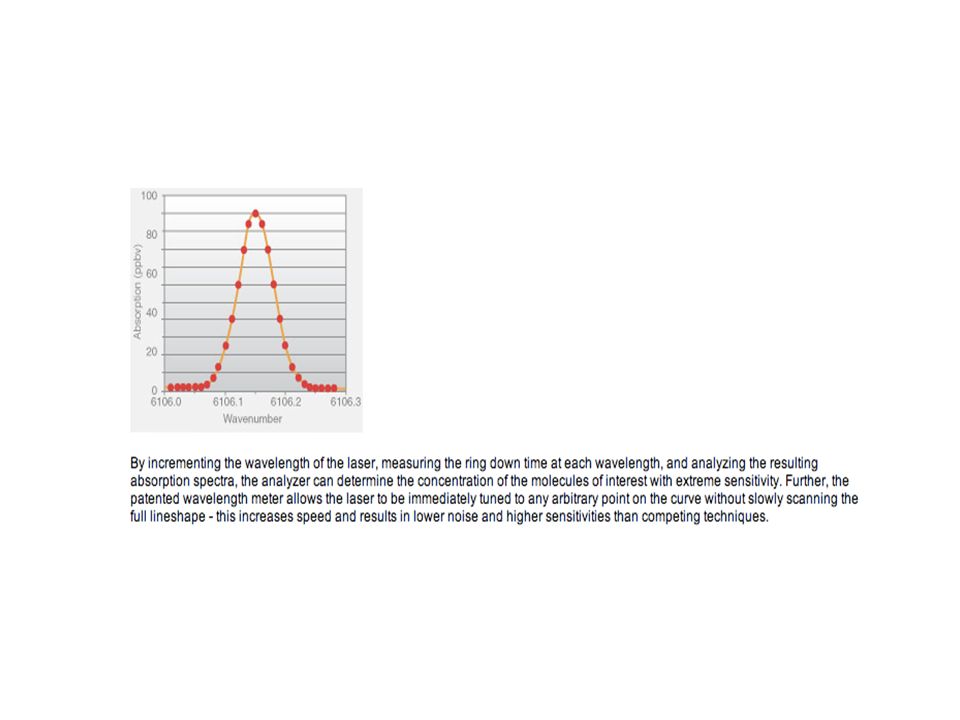
now add a molecular absorption: = L / {c(1 – R + L)} [sec] { from I(t) / I o = exp(-t/ o – ct) and ct = L, total cavity length at time t } where is the absorption coefficient [/cm] and goes like concentration x cross section Then the relationship between empty cavity decay time ( o ) and the decay time with an absorber present ( ) is: 1/ o + c since c is 1/time added for the absorber The are a function of wavelength and at each wavelength are fitted with an exponential decay curve to get the decay time. Knowing o allows calculation of and from that the concentrations can be determined over a full spectral line using Beer’s law using differential spectroscopy.
![now add a molecular absorption: = L / {c(1 – R + L)} [sec] { from I(t) / I o = exp(-t/ o – ct) and ct = L, total cavity length at time t } where is the absorption coefficient [/cm] and goes like concentration x cross section Then the relationship between empty cavity decay time ( o ) and the decay time with an absorber present ( ) is: 1/ o + c since c is 1/time added for the absorber The are a function of wavelength and at each wavelength are fitted with an exponential decay curve to get the decay time.](http://images.slideplayer.com/26/8746047/slides/slide_14.jpg "Knowing o allows calculation of and from that the concentrations can be determined over a full spectral line using Beer’s law using differential spectroscopy..")
15
O’Keefe et al www.lgrinc.com/ publications/ acs.pdf 750 ppm loss 1 – 750 x 10 -6 = 0.99925 = 0.0075% best we can do with the NASA system upstairs is about 0.015%, about 2x worse

16
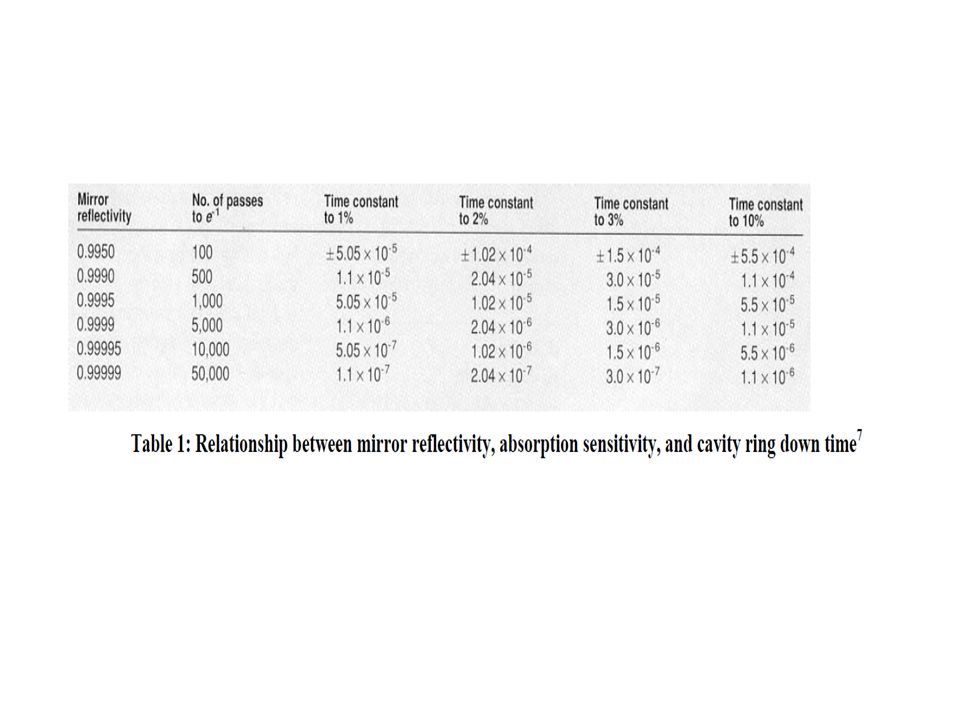
some specs: mirror reflectivity > 99.995% in near UV/vis are available fractional absorbance detectable < 10 -7 /pulse using mirrors at uncertainty in o of 1% example: L = 50 cm decay time ~ 30µsec for reflectivity 99.994% gives ~ 10,000 round trips during the decay time a detectable light pulse every 3 nsec = 2 x L/c with laser pulse length < shorter than cavity round trip achievable absorbance example: 10 -7 absorbance. NO 2 example with L = 900m = 90000 cm (as in HW problem) I/I o = 0.9999999 = exp(-L (2.5 x 10 -19 )N) N = 4.5x10 6 molecules/cm 3 = 0.2 pptv
 I/I o = = exp(-L (2.5 x )N) N = 4.5x10 6 molecules/cm 3 = 0.2 pptv.")
17
Advantages of CRDS: everything is fractional, so not affected by fluctuations in light source intensity – ring down time does not depend on intensity very sensitive due to long path length (km) due to multiple mirror reflections spectral range is usually good since dichroic laser mirrors are somewhat broad Disadvantages: laser is nearly monochromatic must build up the spectrum need particular laser wavelengths for different molecules high reflectance mirrors (>>99.99% reflectivity) expensive absorbances must be < a few % or don’t get enough bounces source bandwidth must be < absorption bandwidth frequencies within the laser BW must be reflected equally by the mirrors excited state lifetime must be < laser roundtrip time in the cavity – so once a photon is absorbed during a particular laser pass, the excited specie has time to relax before the next laser pass laser scan time limits the time resolution of spectra dirt in system decreased R. I guess this gets calibrated out when you run the cell w/o the molecule you want to measure in the mixture. But you are sucking outside air into the cell all the time and it is dirty

Similar presentations


 The Visible Spectra.>")


 Stephen Ball & Simon Neil (Leicester University) CAVIAR science meeting, NPL,>")
>")


 Last time we discussed what spectroscopy was, and how we could use the interaction of light with atoms and molecules to measure.>")