Download presentation
Presentation is loading. Please wait.

1
The State of Renewable Energy In the United States as of Third Quarter 2011

2
Three Points We have fallen in love (again) with fossil fuels due to new discoveries of (significant) domestic sources of Natural Gas (PA, TX, AK, NY) As a result of the above investors are turning away from wind and solar China Market forces in solar are dictating our choices
 with fossil fuels due to new discoveries of (significant) domestic sources of Natural Gas (PA, TX, AK, NY) As a result of the above investors are turning away from wind and solar China Market forces in solar are dictating our choices")
4
How much Gas? Harvesting Shale Gas requires: horizontal drilling and fracking which releases NG into the wellbore but also into the atmosphere as it diffuses through the shale deposits This is NOT SMART

5
US Reserve Estimates 2002: 1300 TCF potential of which 200- 300 TCF is in proven (e.g. harvestable) reserve. US Consumption rate 22-24 TCF per year therefore in 2002 there maybe only 10-15 years left for domestic NG PANIC With new discoveries, 2010 estimate is now 2200 TCF (or about 30 years more)
 reserve. US Consumption rate TCF per year therefore in 2002 there maybe only years left for domestic NG PANIC With new discoveries, 2010 estimate is now 2200 TCF (or about 30 years more).")
6
Uncertainties Abound Of the 2200 TCF only about 300 TCF is in the form of proven reserve. In the specific case of the Marcellus Shale Gas Field in NY, the original estimate of 410 TCF has been downgraded by a 2011 USGS survey to 85 TCF ! Why are we investing wholesale in yet another finite resource in which most of that resource can not be brought to market in a cost effective manner

7
NG Fetish Clearly Reflected in our Facilities Build out

8
Current US Wind Deployment

9
Loss of Momentum since 2009

10
Real World Problems in Solar

11
850 MW Project Site Located in Imperial County CA Need new transmission lines to serve San Diego Area Transmission line approval was so delayed that the provider went bankrupt

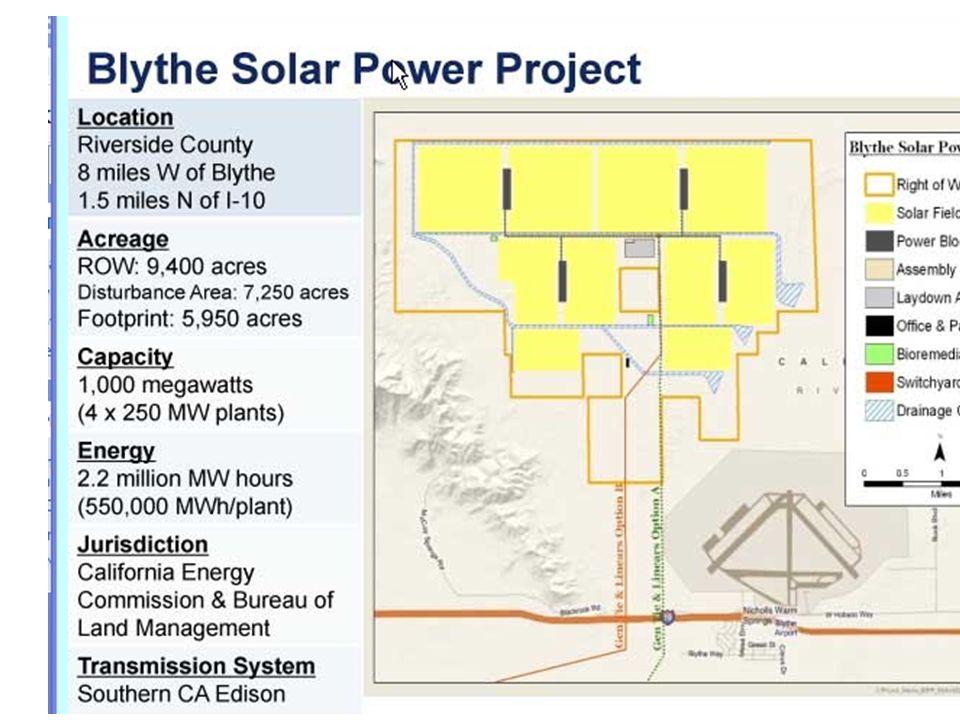
14
1000 MW Total (!)
")
15
Market Driven Strategy

16
Okay We Punt: Sell it and Delay Construction for at least 1 YR

17
New Technologies Solar – new materials for improved PV efficiency: But new materials are not common and material shortages will limit build out significantly

18
First Solar is Desperate

19
Organic PV’s Promising

20
New Wind Turbine Design Traditional Horizontal Axis turbines can only get so big. World’s largest is 7.5 MW with about 200m long blades

21
Horizontal Axis Limitations Blades too big to transport to location Generator is hung in a gravity field Differential turbulence across the whole rotor diameter (up to 500 meters) stresses the device too much (i.e. it falls down) Need to move to Vertical Axis Turbines
 Need to move to Vertical Axis Turbines.")
22
Vertical Axis Advantages Generator is on the ground (therefore) can be very large (100 MW) Just need right blade design.
 can be very large (100 MW) Just need right blade design.")
23
Current Designs don’t work well

24
A Fantasy 1 VXWT with 200 MW generator (Space Needle Size); Need 6000 of them. These Would be populated with a density of about 1 VXWT per 300 square km. This could Be built in 10 years with suitable labor And production force. In the end, you would Have US Nameplate Electricity production All in the form of Wind.

Similar presentations


>")


