Download presentation
Presentation is loading. Please wait.

1
Receivables and Inventories Chapter 6 Lecture 22

2
1.Describe the common classifications of receivables. 2.Describe the nature of uncollectible receivables. 3.Describe methods of estimating uncollectible receivables. 4.Describe the common classifications of inventories.

3
6-3 5.Describe the three inventory cost flow assumptions and how they impact the financial statements. 6.Compare and contrast the use of inventory costing methods. 7.Describe how receivables and inventories are reported on the financial statements. 8. Compute and interpret the accounts receivable and inventory turnover ratios.

8
Regardless of the care used in granting credit and the collection procedure used, normally a part of the credit sales will not be collectible.

10
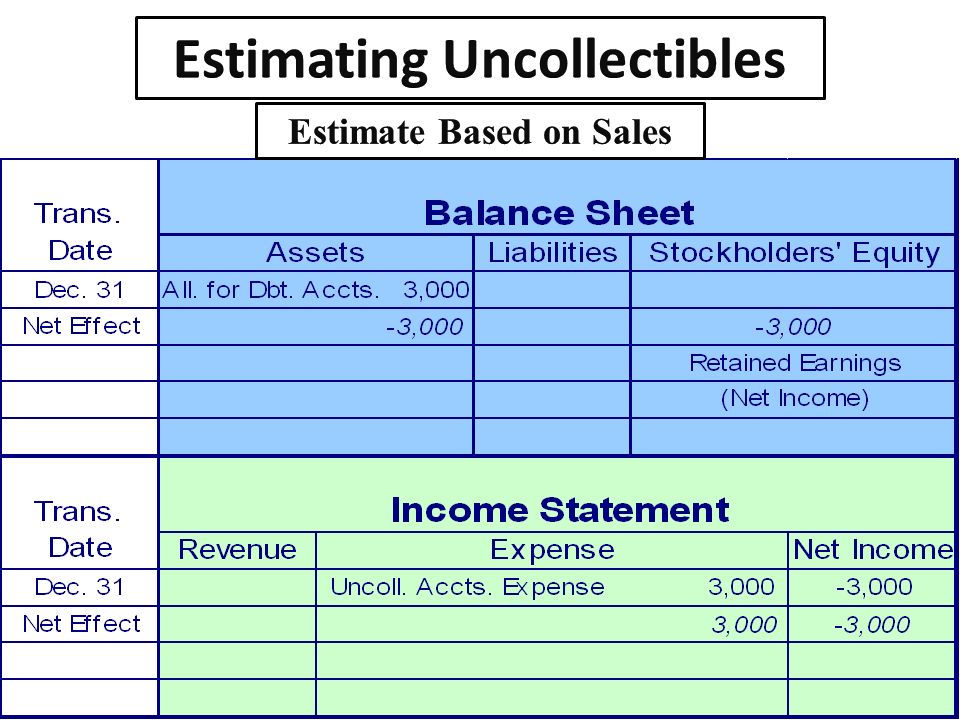
Methods of estimating uncollectible receivables.

12
6-12

15
Estimate Based on Aging of Receivables

16
Accounts Receivable Aging and Uncollectibles Not Days Past Due Past over CustomerBalanceDue 1-30 31-6061-9091-180 181-365 365 Ashby & Co. 150 150 B. T. Barr610 350260 Brock Co.470 470 J. Zimmer Co.160160 Total86,30075,000 4,0003,100 1,9001,200800300

17
2%5%10%20%30%50% 80% Uncollectibles PERCENT Uncollectible percentages based on experience and industry averages. Not Days Past Due Past over CustomerBalanceDue 1-30 31-6061-9091-180 181-365 365 Ashby & Co. 150 150 B. T. Barr610 350260 Brock Co.470 470 J. Zimmer Co.160160 Total86,300 75,000 4,0003,1001,9001,200800300 Accounts Receivable Aging and Uncollectibles

18
2%5%10%20%30%50% 80% Uncollectibles PERCENT AMOUNT 3,390 =1,500200310380360400 240 3,390 =1,500200310380360400 240 Accounts Receivable Aging and Uncollectibles Not Days Past Due Past over CustomerBalanceDue 1-30 31-6061-9091-180 181-365 365 Ashby & Co. 150 150 B. T. Barr610 350260 Brock Co.470 470 J. Zimmer Co.160160 Total86,30075,000 4,0003,1001,9001,200800300

19
Estimate Based on Aging of Receivables

21
On January 21 John Parker, one of Richards Company’s receivables, files for bankruptcy. Thus, his account of 6,000 is deemed uncollectible.

22
John Parker won the state lottery, so he is paying all of his bankruptcy debts. On June 10, Richards Co. receive a check for 6,000.

23
6-23 End of Lecture 22

24
Receivables and Inventories Chapter 6 Lecture 23

25
4 Describe the common classifications of inventories.

26
Accounting for Merchandising Business Lecture 23

27
Merchandising Business Revenue activities of a merchandising business involve the buying and selling of merchandise Comparison to service business Service BusinessMerchandising Business Fees earnedSales Less Operating expenses Less Cost of merchandise sold =Net income=Gross Profit Less Operating expenses =Net Income

28
New Accounts on the Income Statement – SALES – revenues collected from the sale of merchandise – COST OF MERCHANDISE SOLD – GROSS PROFIT – Sales – Cost of merchandise sold

29
Merchandizing Company Income Statement For the Year Ended December 31, 20— Revenue from sales: Sales 189,300 Less:: Sales returns and allowances 1,700 Sales discounts 500 2,200 Net sales 187,100 Cost of merchandise sold XXXX 100,000 Gross profit 87,100 Operating expenses: Selling expenses: Sales salaries expense 17,700 Administrative expenses: Rent expense 7,800 Office salaries expense 22,550 Depreciation expense—office equipment 2,800 33,150 Total operating expenses 50,850 Income from operations 36,250 Other expense: Interest expense 2,000 Net income 34,250

30
Computation of Costs Computation of Cost of Merchandise Sold Purchases Less merchandise inventory, December 31 =Cost of merchandise sold Computation of Cost of Merchandise Purchased Purchases Less: purchases returns and allowances Less: purchases discount =Net purchases Add: transportation in =Cost of merchandise purchased

31
Balance Sheet Accounts Merchandise inventory – merchandise on hand at the end of an accounting period.

32
Merchandising Terms Sales – total amount charged to customers for merchandise sold Sales returns and allowances – are granted by the seller to customers for damaged or defective merchandise Sales discount – are granted by the seller to customers for early Net sales = Sales –returns - discount

33
Merchandising Terms Cost of goods sold – Cost of merchandise sold to customers Purchases discounts – Offered by the seller to buyer – For early payment Purchases allowances and returns – Buyer may receive a reduction in the intial price at which the merchandise is purchased.

34
Merchandising Terms Merchandise available for sale = – Beginning merchandise inventory + net purchases Net purchases = – Purchases minus discounts – returns and allowances

35
Closing Entries – Accounts that must be closed Sales Rent revenue Sales returns and allowances Sales discounts Cost of merchandise sold All expenses and revenues Dividends

36
6-36

37
6-37 End of Lecture 23

38
6-38

39
6-39 End of Lecture 24

40
Manufacturing Organizations

41
Materials inventory consists of the cost of raw materials used in manufacturing a product. Work in process inventory consists of the costs for partially completed products. Direct materials Direct labor costs Factory overhead

42
Finished goods inventory consists of the costs of direct materials, direct labor, and factory overhead for completed products. When the merchandise is sold, the costs are transferred to Cost of Goods Sold

43
Describe the three inventory cost flow assumptions and how they impact the financial statements. 5

44
Three identical units of Item X are purchased during May. Item X Units Cost May 10Purchase1$ 9 18Purchase113 24Purchase1 14 Total3$36 Average cost per unit$12 One unit is sold on May 30 for $20, the unit that was purchased on May 18.

45
The gross profit from this sale would be $7, which is the selling price of $20 less the May 18th cost of $13.

46
Purchased goods Sold goods Fifo Method

47
6-47 Item X Units Cost May 10Purchase1$ 9 18Purchase113 24Purchase1 14 Total3$36 Average cost per unit$12

48
6-48 Income Statement Sales$20 Cost of merchandise sold 9 Gross profit$11 Balance Sheet Merchandise inventory$27 $14 13 Effect of Inventory Costing Methods on Financial Statements

49
6-49 Purchased goods Sold goods

50
6-50 Item X Units Cost May 10Purchase1$ 9 18Purchase113 24Purchase1 14 Total3$36 Average cost per unit$12

51
6-51 Income Statement Sales$20 Cost of merchandise sold 14 Gross profit$ 6 $13 9 Balance Sheet Merchandise inventory$22 Effect of Inventory Costing Methods on Financial Statements

52
6-52 Purchased goods Sold goods

53
6-53 Item X Units Cost May 10Purchase1$ 9 18Purchase113 24Purchase1 14 Total3$36 Average cost per unit$12

54
6-54 $12 12 Income Statement Sales$20 Cost of merchandise sold 12 Gross profit$ 8 Balance Sheet Merchandise inventory$24 Effect of Inventory Costing Methods on Financial Statements

55
6-55 Compare and contrast the use of inventory costing methods. 6 Learning Objective

56
6-56 First-In, First-Out Net sales$15,000 Cost of merchandise sold: Beginning inventory$ 1,800 Purchases 8,600 Merchandise available for sale$10,400 Less ending inventory 3,400 Cost of merchandise sold 7,000 Gross profit$ 8,000

57
6-57 Average Cost Net sales$15,000 Cost of merchandise sold: Beginning inventory$ 1,800 Purchases 8,600 Merchandise available for sale$10,400 Less ending inventory 3,120 Cost of merchandise sold 7,280 Gross profit$ 7,720

58
6-58 Last-In, First-Out Net sales$15,000 Cost of merchandise sold: Beginning inventory$ 1,800 Purchases 8,600 Merchandise available for sale$10,400 Less ending inventory 2,800 Cost of merchandise sold 7,600 Gross profit$ 7,400

59
6-59 Inventory Costing Methods 600 500 400 300 200 100 0 FIFOLIFO Average cost Number of firms (> $1Billion Sales)
")
60
6-60 Describe how receivables and inventories are reported. 7 Learning Objective

61
6-61 Starbucks’ ASSETS Sept. 30, 2001 (in thousands) Current assets: Cash and cash equivalents$113,237 Marketable securities107,312 Accounts receivable, net of allowance of $4,59090,425 Inventories221,253 Prepaid expenses and other current assets 61,698 Total current assets$593,925
 Current assets: Cash and cash equivalents$113,237 Marketable securities107,312 Accounts receivable, net of allowance of $4,59090,425 Inventories221,253 Prepaid expenses and other current assets 61,698 Total current assets$593,925.")
62
6-62 In the lower-of-cost-or-market method, market is the cost to replace the merchandise on the inventory date.

63
$ 3,800 2,700 4,650 3,920 Total $15,520$15,472$15,070 6-63 Valuation of Inventory at Lower-of-Cost-or-Market A400$10.25$ 9.50$ 4,100$ 3,800 B12022.5024.102,7002,892 C6008.007.754,8004,650 D28014.0014.753,9204,130 Unit InventoryCostMarketTotalTotal Lower ItemQuantityPricePriceCostMarketC or M The market decline is either: 1. Based on total inventory ($15,520 – $15,472) = $48 2. Based on individual items ($15,520 – $15,070) = $450
 = $48 2. Based on individual items ($15,520 – $15,070) = $450.")
64
6-64 Compute and interpret the accounts receivable and inventory turnover ratios. 8 Learning Objective

65
6-65 Accounts Receivable Turnover 20062005 Net sales on account$1,498,000$1,200,000 Accounts receivable (net): Beginning of year$ 120,000$ 140,000 End of year 115,500120,000 Total$ 235,000$ 260,000 Average$ 117,500$ 130,000 $1,498,000 $117,500 $1,200,000 $130,000 Net Sales Average accounts receivable Use:To assess the efficiency in collecting receivables and in the management of credit 12.7 9.2
: Beginning of year$ 120,000$ 140,000 End of year 115,500120,000 Total$ 235,000$ 260,000 Average$ 117,500$ 130,000 $1,498,000 $117,500 $1,200,000 $130,000 Net Sales Average accounts receivable Use:To assess the efficiency in collecting receivables and in the management of credit")
66
6-66 Inventory Turnover Ratios Safeway Inc. Zale Cost of merchandise sold$22,482,400,000$920,003,000 Inventories: Beginning of year$2,444,900,000$571,669,000 End of year $2,508,000,000$630,450,000 Average$2,476,450,000$601,059,500 Inventory turnover9.1 times1.5 times Cost of merchandise sold Average inventory Use:To assess the efficiency in the management of inventory

67
6-67 The End Chapter 6

68
6-68

Similar presentations


 2009 Prentice Hall. All.>")


