Download presentation
Presentation is loading. Please wait.

1
SCM 330 Ocean Discovery through Technology Area F GE

2
Sensors - Biological Traditional Approach Nets Bottles Sensors Fluorometers Optical Scattering (particle size) Flow Cytometers Acoustics VPR Light Sheets Molecular Tagging Theory Application Sensor
 Flow Cytometers Acoustics VPR Light Sheets Molecular Tagging Theory Application Sensor")
3
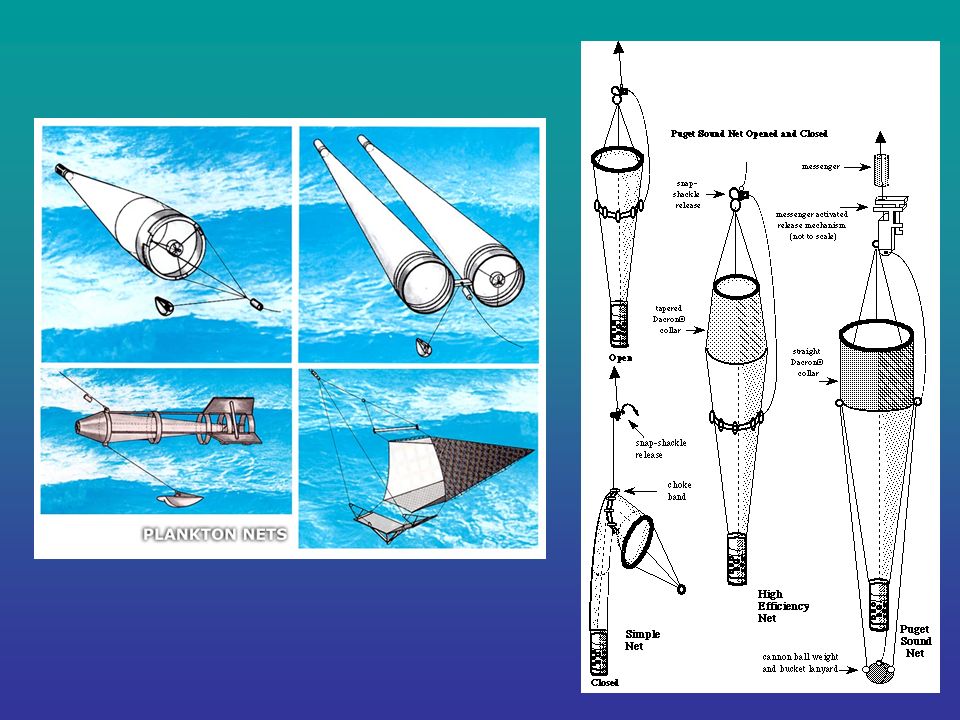
Nets

8
Bottles

17
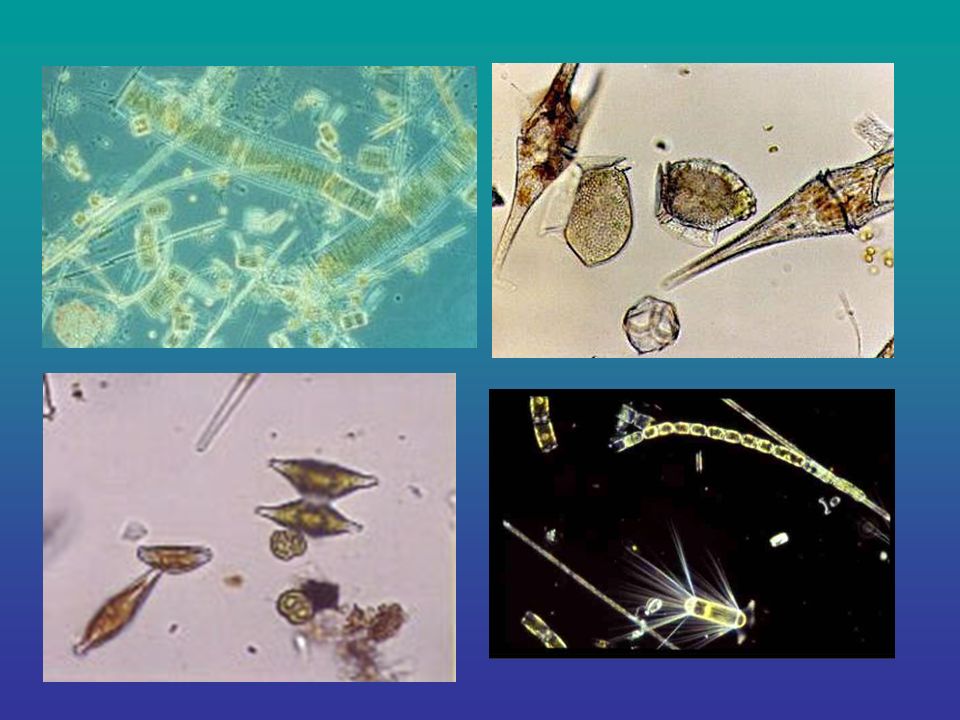
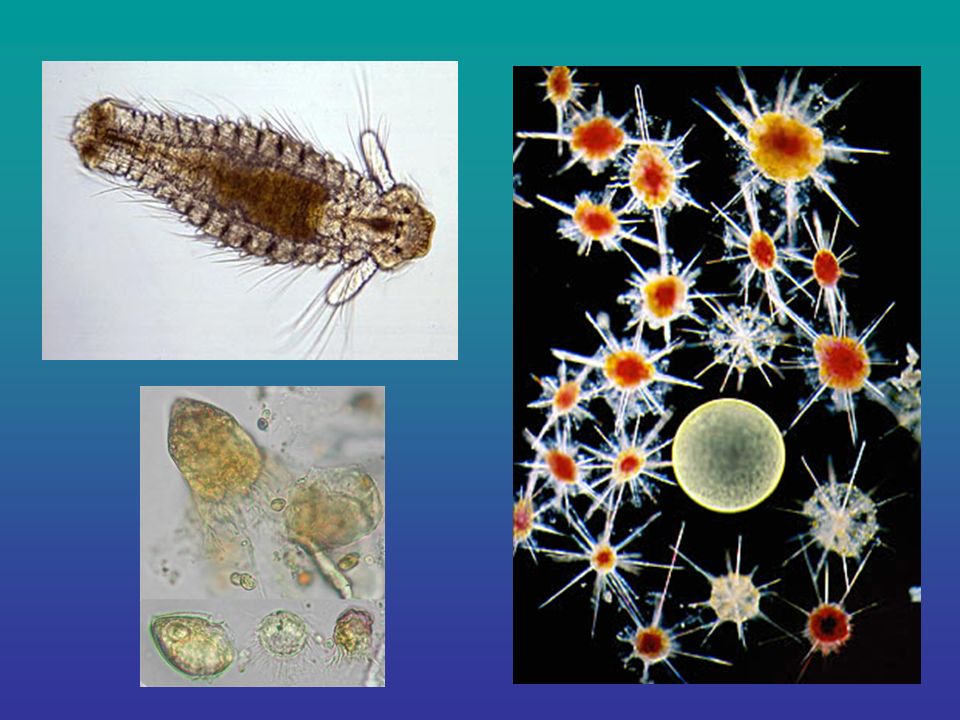
The Challenge How to distinguish what is in the water? Plants Animals (larvae/adults) Size Range (um to meters) Size Ranges Overlap Different Shapes Different Chemical Composition DNA
 Size Range (um to meters) Size Ranges Overlap Different Shapes Different Chemical Composition DNA.")
18
Sensor Design Requirements Compact Low Power High Sampling Rate General Application Pressure Tolerant Low Cost

19
Fluorometers

20
Excite in the Blue… emission in the Red

23
Spectrofluorometer (Multiple Excitation/Multiple Emission)
")
24
Off the Coast of Oregon

25
Shore Station Off Canada

26
Morro Bay

27
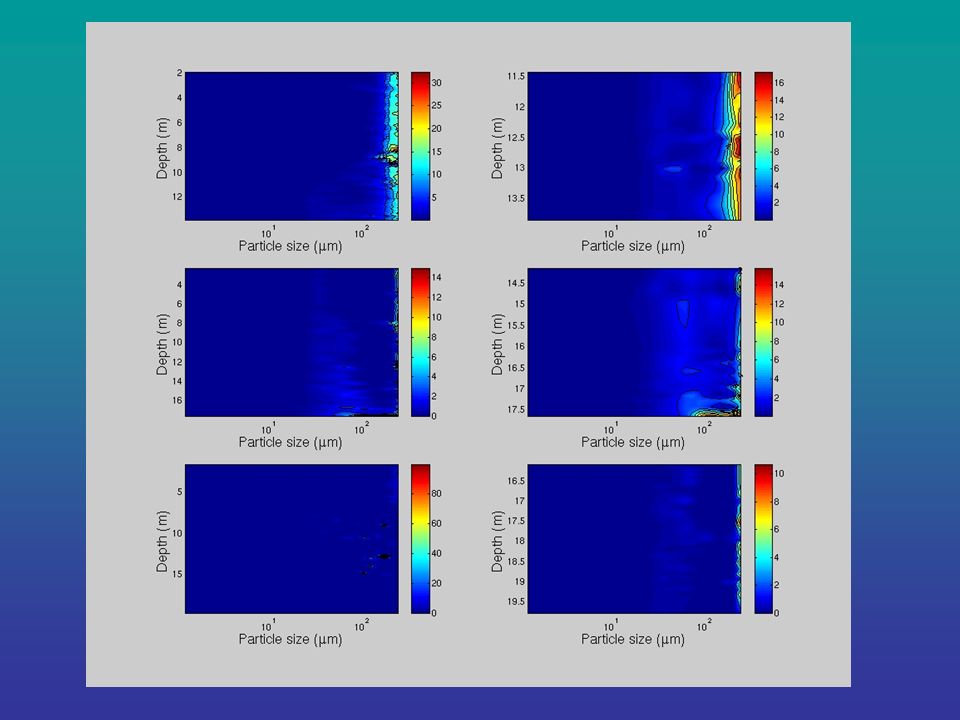
Optical Scattering Scattering at 32 angles is the primary information that is recorded. This primary measurement is mathematically inverted to get the size distribution (1um – 2000um) Backscatter decreases with size – Used as a tool to look at size distributions of particles. Laser In-Situ Scattering and Transmissometer (LISST)
 Backscatter decreases with size – Used as a tool to look at size distributions of particles. Laser In-Situ Scattering and Transmissometer (LISST).")
28
1. As the LISST descends through the water it projects a laser beam toward ring- shaped detectors on the main body of the instrument. 2. This top view of LISST's laser and detectors show how the instrument uses scattering to measure particle sizes. 3. From the inside surface of the crossbar a laser beam shines on particles in the water. 4. Particles scatter the laser light at different angles depending on particle size. Small particles scatter light toward outer rings of the detector while large particles scatter light toward inner rings. 5. The amount of scattered light detected by each ring is recorded by the instrument's internal computer. These data are later converted into graphs of the abundance of particles of each size.

30
Inshore Offshore

31
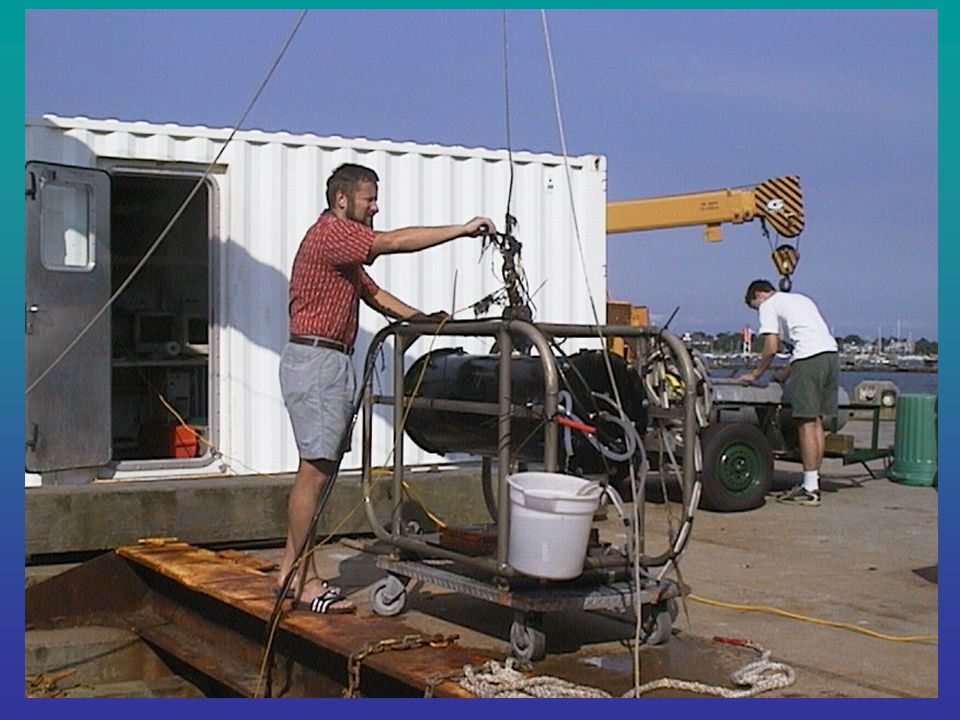
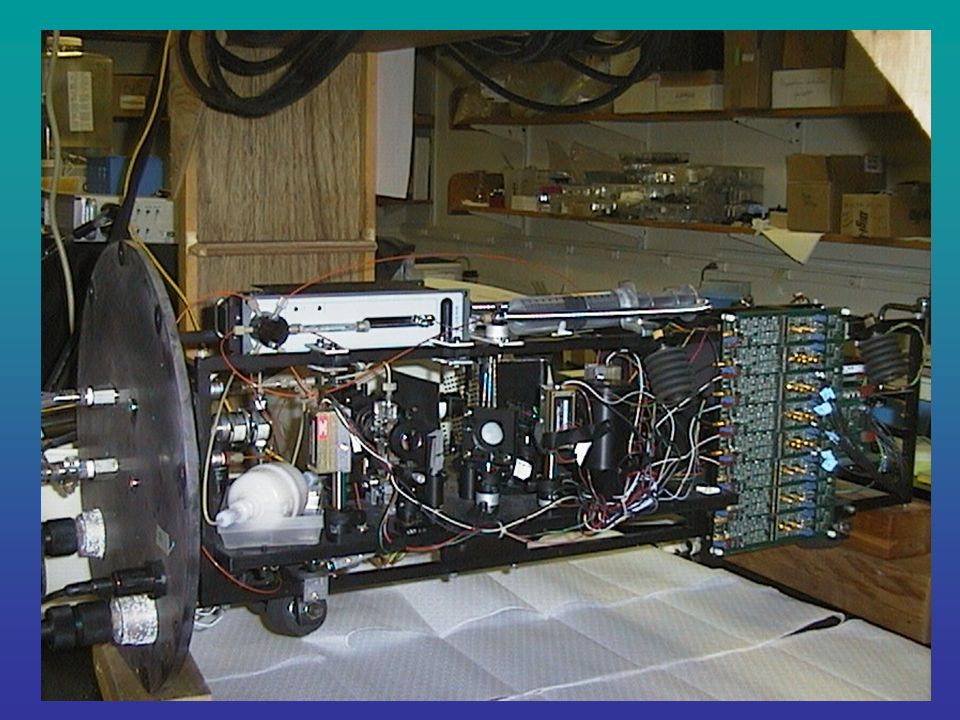
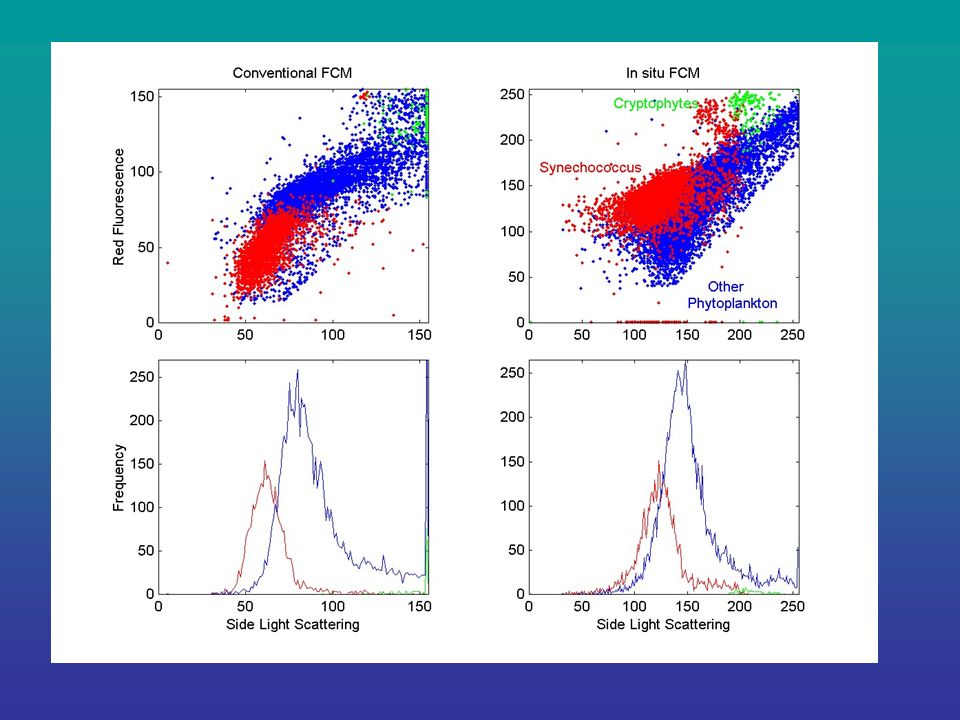
Flow Cytometry Flow cytometry has proved a valuable tool for the analysis of phytoplankton and other suspended particles because of its speed and quantitative measurements, but the method’s oceanographic application has been limited by the need to take discrete water samples for analysis on board ship or in the laboratory. This instrument differs from conventional flow cytometers in that it uses a simple ducted flow of seawater through the flow cell, rather than hydrodynamically focusing a stream of sample seawater by injecting it into a sheath of particle-free fluid. The new instrument defines a sensing region in the center of a diode-pumped 532 nm laser beam, based on the intersection of 2 diode lasers; only signals from those particles which pass through all 3 beams are accepted.

37
Acoustic Data Trawl Survey Data quantitative continuity low variance little avoidance quick, cost effective quantitative species identification length biology Whole Estimates of Fish abundance distribution size biomass species Acoustics

38
Collecting Acoustic Data Computer Echosounder Towfish Transducer Cruise Vessel

46
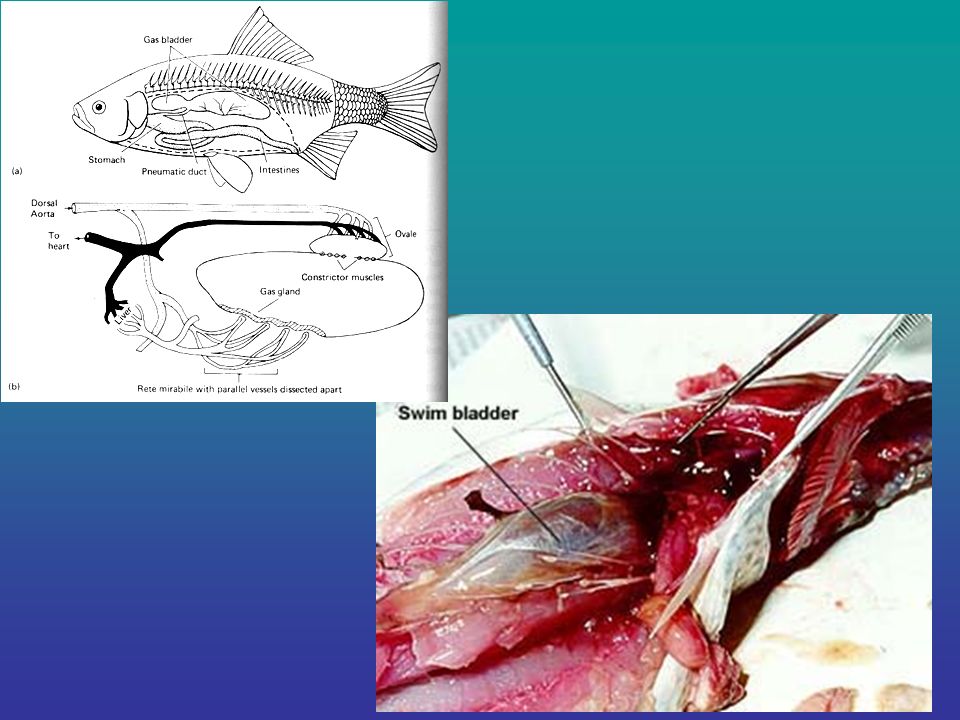
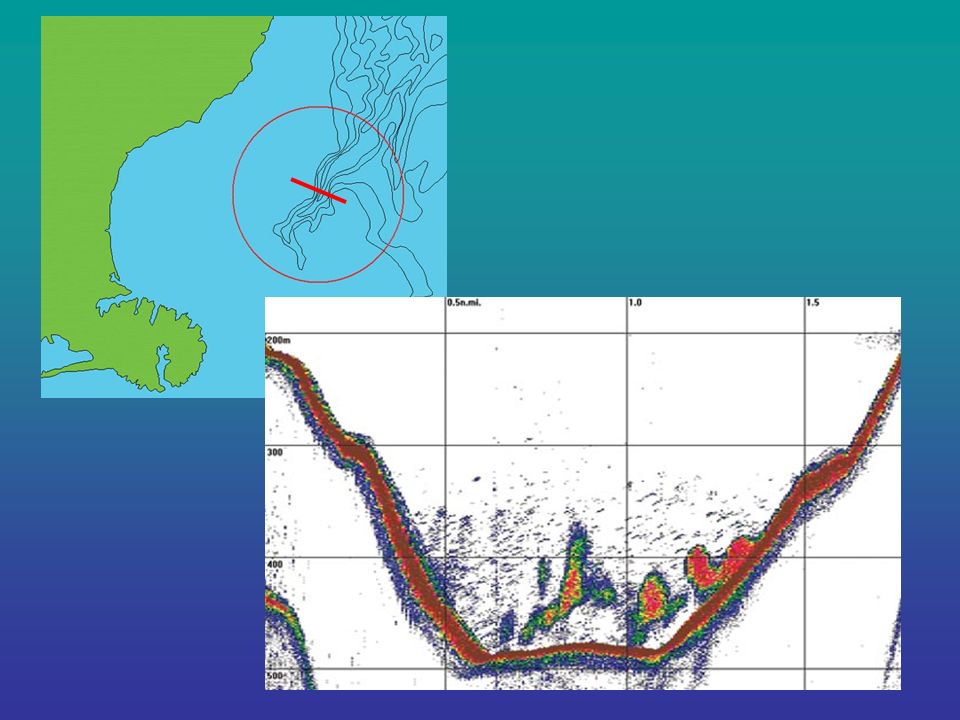
Acoustic Echogram Surface Fish targets Bottom substrate

47
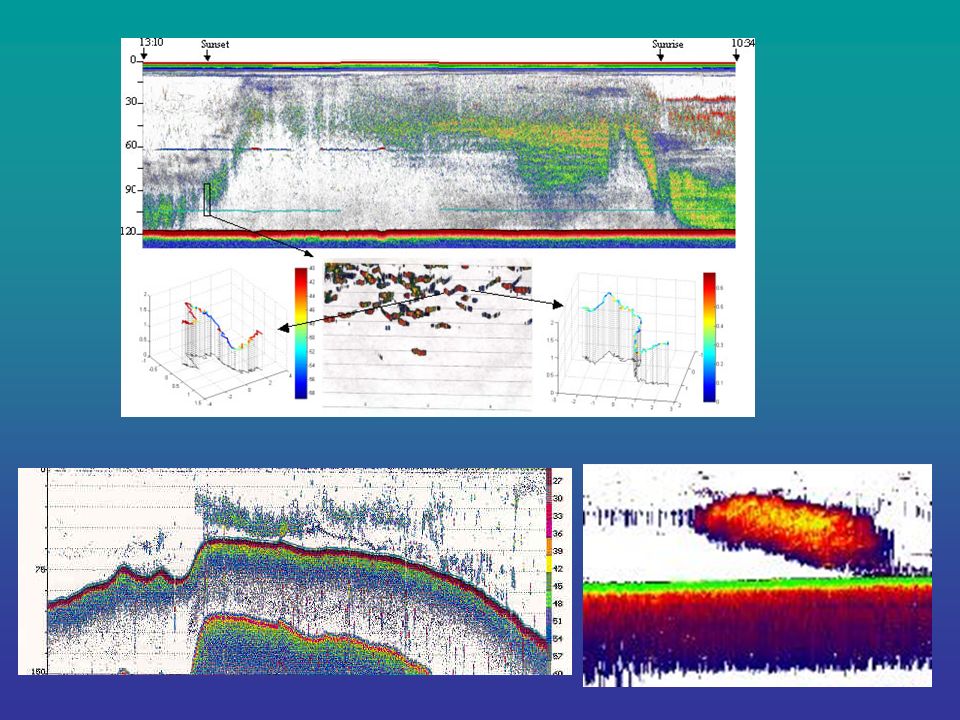
Assessing Schooling Behavior of Fish with Acoustics Depth (m) 0 21 1312h 1315h 1917h 1919h 0102h 0107h Mid-day Dusk Night
 h 1315h 1917h 1919h 0102h 0107h Mid-day Dusk Night")
51
PollockSalmon

Similar presentations


 of blood...>")

 Optical Light Scatter and Flow Cytometry.>")


 Dr. Hayder Kh. Q. Ali 1.>")


>")
, Gerald Denis (X4-1371),>")
 CTD>")
