Download presentation
Presentation is loading. Please wait.

1
WOCE and BEYOND WOCE and BEYOND Nov. 2002 Sea Level Rise: Can we explain what we measure? Anny Cazenave LEGOS-GRGS/CNES Toulouse, France

3
- STERIC sea level: change in Density - EUSTATIC sea level: change in Ocean Mass Temperature Salinity Water mass exchange with continents and ice caps

4
-0.5 0.51.01.52.00.0 1.0 mm/year 2.0 mm/year Thermal expansion Glaciers Greenland (present) Antarctica (present) Ice sheets (long term) Permafrost Sedimentary deposits TOTAL OBSERVATIONS Continental waters 20 th Century Sea Level Rise, IPCC, 2001
 Antarctica (present) Ice sheets (long term) Permafrost Sedimentary deposits TOTAL OBSERVATIONS Continental waters 20 th Century Sea Level Rise, IPCC, 2001")
5
SUMMARY OF RECENT RESULTS During the 1990s, sea level has been rising by During the 1990s, sea level has been rising by ~ 3 mm/yr evidence for a recent acceleration ??? Steric and eustatic sea level change recognized as highly non uniform overestimate of the 20 th century sea level rise by tide gauges ??? Steric and eustatic sea level change recognized as highly non uniform overestimate of the 20 th century sea level rise by tide gauges ??? New rates for glaciers and ice sheets recent melting New rates for glaciers and ice sheets recent melting Land water mass contribution to sea level rise can now be estimated Land water mass contribution to sea level rise can now be estimated

6
Observationsof Present-Day Sea Level Rise

7
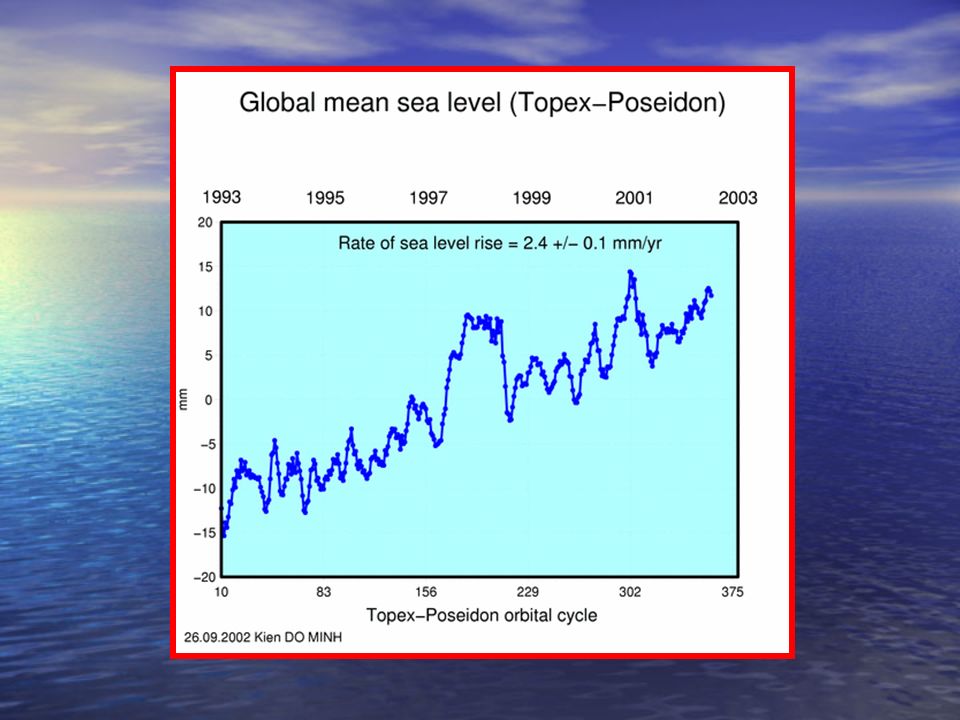
Sea Level Rise during the 1990s from from Satellite Altimetry

8
TOPEX/POSEIDON

10
SEA LEVEL TRENDS measured by TOPEX/POSEIDON (1993-2001) Trends in mm/year
 Trends in mm/year")
11
Satellite Altimetry for Global Mean Sea Level Advantages high-precisionhigh-precision high spatio-temporal resolutionhigh spatio-temporal resolution global coverageglobal coverage absolute measurementsabsolute measurements Drawbacks time series still short (10 years)time series still short (10 years) no coverage of high- latitude oceans (T/P & Jason)no coverage of high- latitude oceans (T/P & Jason)
time series still short (10 years) no coverage of high- latitude oceans (T/P & Jason)no coverage of high- latitude oceans (T/P & Jason)")
12
Sea Level Rise during the 20 th century from from Tide Gauges

13
WORLDWIDE TIDE GAUGE NETWORK -2001-

14
Tide gauges used by B. Douglas (1997)
")
15
SAN FRANCISCO BREST NEW YORK STOCKHOLM

16
Main processes causing vertical land motions Tectonic deformationsTectonic deformations Seismic activitySeismic activity Volcanic activityVolcanic activity Viscous deformation of the Earth’s mantleViscous deformation of the Earth’s mantle (Post Glacial Rebound) (Post Glacial Rebound) Land subsidence due to sediments compaction, underground water extraction, etc.Land subsidence due to sediments compaction, underground water extraction, etc. Surface loading due to air and water mass redistribution among atmosphere, oceans, continental water reservoirs and ice capsSurface loading due to air and water mass redistribution among atmosphere, oceans, continental water reservoirs and ice caps

17
Deformation of the Earth’s mantle under ice sheet loading and POST GLACIAL REBOUND

18
TIDE GAUGE-BASED SEA LEVEL RISE FOR THE 20 th CENTURY Global 1.5 +/- 0.5 mm/yr (IPCC, 2001)1.5 +/- 0.5 mm/yr (IPCC, 2001) 1.71 +/- 0.55 mm/yr (Douglas, 2001;1.71 +/- 0.55 mm/yr (Douglas, 2001; 27 sites) 27 sites) 1.84 +/- 0.35 mm/yr (Peltier, 2001;1.84 +/- 0.35 mm/yr (Peltier, 2001; 27 sites) 27 sites) 1.5 +/- 0.4 mm/yr (Tamaseia et al., 2001; 23 sites)1.5 +/- 0.4 mm/yr (Tamaseia et al., 2001; 23 sites)
1.5 +/- 0.5 mm/yr (IPCC, 2001) / mm/yr (Douglas, 2001;1.71 +/ mm/yr (Douglas, 2001; 27 sites) 27 sites) / mm/yr (Peltier, 2001;1.84 +/ mm/yr (Peltier, 2001; 27 sites) 27 sites) 1.5 +/- 0.4 mm/yr (Tamaseia et al., 2001; 23 sites)1.5 +/- 0.4 mm/yr (Tamaseia et al., 2001; 23 sites)")
19
Tide Gauges for Global Mean Sea Level Advantages historical informationhistorical information (back to 1900) (back to 1900) useful for calibrating onboard altimetry systemsuseful for calibrating onboard altimetry systemsDrawbacks heterogeneous and limited coverageheterogeneous and limited coverage gaps in data recordsgaps in data records land motion contaminationland motion contamination data sensitive to local perturbationsdata sensitive to local perturbations
 (back to 1900) useful for calibrating onboard altimetry systemsuseful for calibrating onboard altimetry systemsDrawbacks heterogeneous and limited coverageheterogeneous and limited coverage gaps in data recordsgaps in data records land motion contaminationland motion contamination data sensitive to local perturbationsdata sensitive to local perturbations")
20
Sea level change during the last 6000 years 20 th century -6000 years present From Lambeck, 2002

21
CONSTRAINTSFROMASTRONOMICAL/GEOPHYSICAL OBSERVABLES OBSERVABLESCONSTRAINTSFROMASTRONOMICAL/GEOPHYSICAL

22
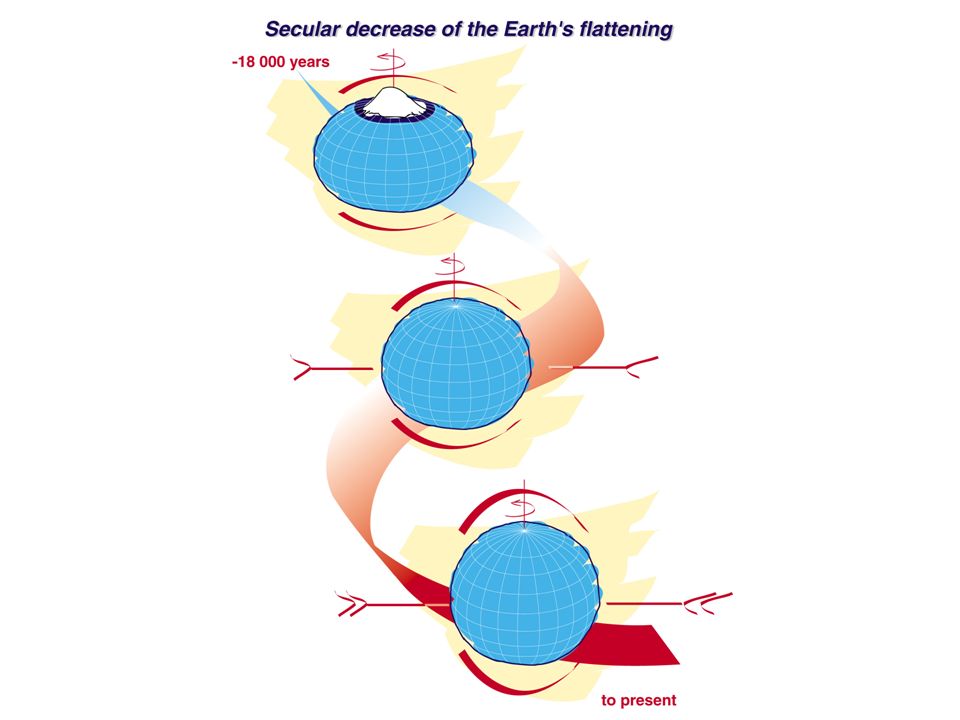
Astronomical/Geophysical Observables Non-tidal Earth ’s rotation acceleration or length of day -LOD- deceleration: -0.6 ms/cy for the past 2500 years Non-tidal Earth ’s rotation acceleration or length of day -LOD- deceleration: -0.6 ms/cy for the past 2500 years Secular decrease of the Earth ’s dynamical flattening : -3x10 -11 /yr for the past 25 years Secular decrease of the Earth ’s dynamical flattening : -3x10 -11 /yr for the past 25 years Secular movement of the Earth ’s rotation pole: 10 m/cy towards Greenland over the past 100 years Secular movement of the Earth ’s rotation pole: 10 m/cy towards Greenland over the past 100 years

23
From Wahr and Davis, 2002 Length of Day (LoD)variations for the past 2500 years LoD J2J2J2J2 -500 year 2000
variations for the past 2500 years LoD J2J2J2J year 2000")
24
Secular decrease of the Earth ’s flattening (J 2 ) From Cox and Chao, 2002
 From Cox and Chao, 2002")
25
From Wahr and Davis, 2002 Length of Day (LoD)variations for the past 2500 years LoD J2J2J2J2 -500 year 2000
variations for the past 2500 years LoD J2J2J2J year 2000")
27
From Sabadini and Vermeersen, 2002 Post Glacial Rebound PGR + present-day melting A A+G observation Secular Decrease of the Earth’s Flattening

28
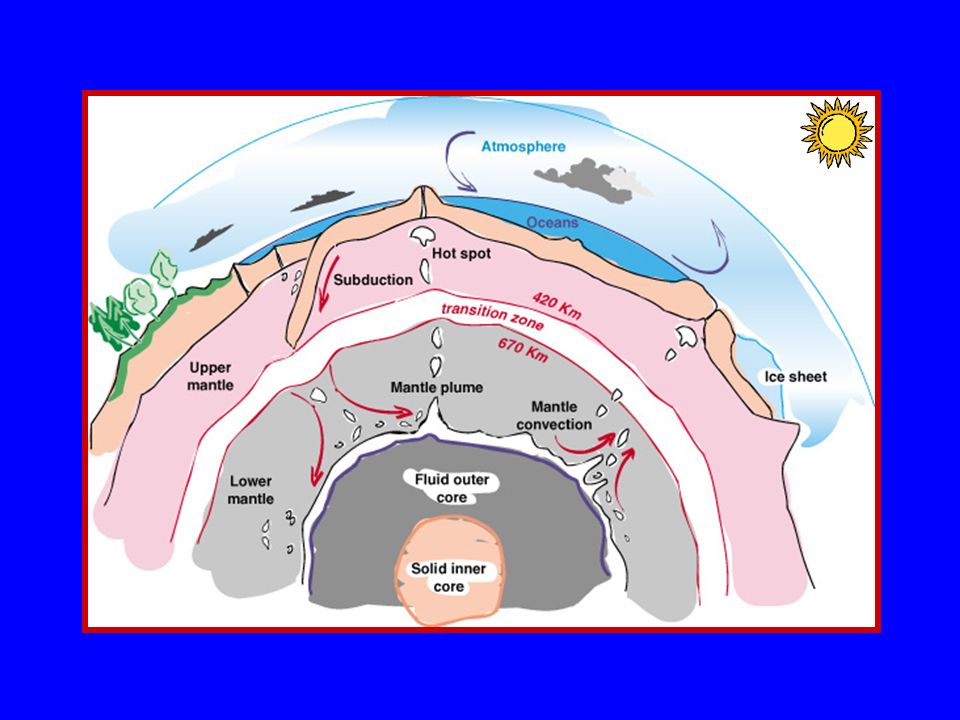
Long-wavelength geoid Sketch of the Earth’s interior Viscosity of the Earth’s mantle

29
Sketch of the Earth’s interior Lower mantle Core Core Uppermantle Viscosity profiles from global circulation models from global circulation models

30
Secular decreases of Length of Day and Earth’s flattening are not strong constraints on present-day eustatic sea level rise

31
DO WE UNDERSTAND OBSERVATIONS OFPRESENT-DAY SEA LEVEL RISE?

32
Sea Level Rise during the 1990s the 1990s

33
SEA LEVEL TRENDS FOR 1993-1998 (mm/yr) Upper map : Observed (Topex/Poseidon) (Topex/Poseidon) Bottom map: Computed (thermal expansion) - Topex/Poseidon (1993-1998) Thermal expansion (1993-1998) From Cabanes et al., 2001 -27 mm/yr +27
 Upper map : Observed (Topex/Poseidon) (Topex/Poseidon) Bottom map: Computed (thermal expansion) - Topex/Poseidon ( ) Thermal expansion ( ) From Cabanes et al., mm/yr +27")
34
World ocean temperature data base S. Levitus, C. Stephens, J.I. Antonov & T.P. Boyer NOAA Atlas NESDIS 40, 2000 World ocean temperature data base S. Levitus, C. Stephens, J.I. Antonov & T.P. Boyer NOAA Atlas NESDIS 40, 2000 Global gridded time series of ocean temperature data at different depths: 0-500 m : yearly means for 1945-1998 0-3000 m : 5-year means for 1945-1995 Global gridded time series of ocean temperature data at different depths: 0-500 m : yearly means for 1945-1998 0-3000 m : 5-year means for 1945-1995

35
Topex/Poseidon sea level--- Thermal expansion---- Résidual---- From Cabanes et al., 2001

36
Sea level rise measured by Topex/Poseidon is mainly caused by thermal expansion (warming) of ocean waters
 of ocean waters")
37
Sea Level Rise during the 20 th century the 20 th century

38
-0.5 0.51.01.52.00.0 1.0 mm/year 2.0 mm/year Thermal expansion Glaciers Greenland (present) Antarctica (present) Ice sheets (long term) Permafrost Sedimentary deposits TOTAL OBSERVATIONS Continental waters 20 th Century Sea Level Rise, IPCC, 2001
 Antarctica (present) Ice sheets (long term) Permafrost Sedimentary deposits TOTAL OBSERVATIONS Continental waters 20 th Century Sea Level Rise, IPCC, 2001")
39
Past Century Sea Level Rise: Sea Level Rise: is the observed 1.5 mm/yr rate too high? OR are climate-related contributionsunderestimated? Past Century Sea Level Rise: Sea Level Rise: is the observed 1.5 mm/yr rate too high? OR are climate-related contributionsunderestimated?

40
Steric contribution (thermal expansion) to sea level rise for 1955-1995 0.5 +/- 0.05 mm/yr Steric sea level trends Global mean steric sea level From Cabanes et al., 2001
 to sea level rise for / mm/yr Steric sea level trends Global mean steric sea level From Cabanes et al., 2001")
41
STERIC SEA LEVEL TRENDS (1955-1995) STERIC SEA LEVEL TRENDS (1955-1995)
 STERIC SEA LEVEL TRENDS ( )")
42
0.5 +/- 0.05 mm/yr 1.4 +/- 0.1 mm/yr Steric sea level trends map and tide gauge sites used by Douglas (1997) 1.3 +/- 0.1 mm/yr 1.3 +/- 0.1 mm/yr 0.5 +/- 0.05 mm/yr From Cabanes et al., 2001
 1.3 +/- 0.1 mm/yr 1.3 +/- 0.1 mm/yr 0.5 +/ mm/yr From Cabanes et al., 2001")
43
SEA LEVEL RISE (1955-1995) Steric average at the 25 tide gauge sites: 1.3 +/- 0.1 mm/yr 1.3 +/- 0.1 mm/yr Observed by tide gauges (25 sites) : 1.6 +/- 0.15 mm/yr Thermal expansion (global mean) : 0.5 +/- 0.05 mm/yr Salinity effect (global mean) : 0.05 +/- 0.02 mm/yr SEA LEVEL RISE (1955-1995) Steric average at the 25 tide gauge sites: 1.3 +/- 0.1 mm/yr 1.3 +/- 0.1 mm/yr Observed by tide gauges (25 sites) : 1.6 +/- 0.15 mm/yr Thermal expansion (global mean) : 0.5 +/- 0.05 mm/yr Salinity effect (global mean) : 0.05 +/- 0.02 mm/yr
 Steric average at the 25 tide gauge sites: 1.3 +/- 0.1 mm/yr 1.3 +/- 0.1 mm/yr Observed by tide gauges (25 sites) : 1.6 +/ mm/yr Thermal expansion (global mean) : 0.5 +/ mm/yr Salinity effect (global mean) : / mm/yr SEA LEVEL RISE ( ) Steric average at the 25 tide gauge sites: 1.3 +/- 0.1 mm/yr 1.3 +/- 0.1 mm/yr Observed by tide gauges (25 sites) : 1.6 +/ mm/yr Thermal expansion (global mean) : 0.5 +/ mm/yr Salinity effect (global mean) : / mm/yr")
44
Map of steric sea level trends and GLOSS tide gauge network Steric sea level: - global mean (in blue) -subsampled at GLOSS sites (in red)
 -subsampled at GLOSS sites (in red)")
45
The inhomogeneous distribution of historical tide gauges used to estimate the 20 th century sea level rise cannot capture the regional thermosteric variability Tide gauge-based estimates of 20 th century sea level rise too high???

46
EUSTATIC SEA LEVEL RISE (ocean mass change)
")
47
Eustatic contribution from land water storage (change in the global water cycle ) Eustatic contribution from land water storage (change in the global water cycle )
 Eustatic contribution from land water storage (change in the global water cycle )")
48
-0.5 0.51.01.52.00.0 1.0 mm/year 2.0 mm/year Thermal expansion Glaciers Greenland (present) Antarctica (present) Ice sheets (long term) Permafrost Sedimentary deposits TOTAL OBSERVATIONS Continental waters 20 th Century Sea Level Rise, IPCC, 2001
 Antarctica (present) Ice sheets (long term) Permafrost Sedimentary deposits TOTAL OBSERVATIONS Continental waters 20 th Century Sea Level Rise, IPCC, 2001")
49
Precipitation Evaporation Transpiration Precipitation : Rivers Lakes Oceans Soil Moisture Ground Waters Atmosphere Snow Pack

50
Water mass balance : dW/dt = P - E - R W: Water stored in soils W: Water stored in soils P : Precipitation E : Evapotranspiration E : Evapotranspiration R: Runoff GLOBAL HYDROLOGICAL MODELS

51
THE LAND DYNAMICS (LaD) MODEL P.C.D. Milly and A.B. Shmakin NOAA/university of Princeton J. Hydrometeorology, 2001 GLOBAL MODELING OF LAND WATER AND ENERGY BALANCES

52
LaD MODEL Monthly grids of : - Snow depth - Soil moisture - Underground waters (aquifers) for 1981-1998
 for")
53
0.13 mm/yr 0.05 mm/yr 0.18 mm/yr 0.18 mm/yr Soil waters Snow Total

54
Trends in land water content (1981-1998) drierwetter drier wetter - 3 mm/yr 3 mm/yr - 3 mm/yr 3 mm/yr
 drierwetter drier wetter - 3 mm/yr 3 mm/yr - 3 mm/yr 3 mm/yr")
55
Trends in precipitation on land (1981-1998) drierwetter drier wetter
 drierwetter drier wetter")
56
Land water mass contribution to sea level rise over 1980-2000 amounts to 0.2 mm/year

57
EUSTATIC CONTRIBUTION FROM MOUNTAIN GLACIERS AND ICE SHEETS ICE SHEETS EUSTATIC CONTRIBUTION FROM MOUNTAIN GLACIERS AND ICE SHEETS ICE SHEETS

58
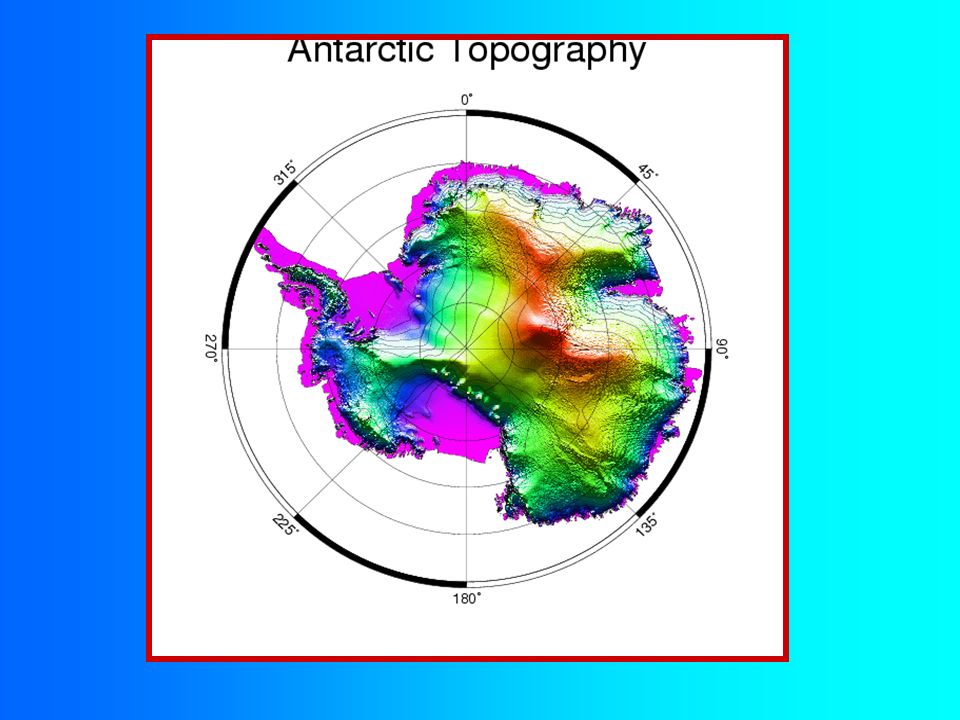
Eustatic contribution from mountain glaciers, ice sheets and land waters MOUNTAIN GLACIERS : < +0.5 mm/yr MOUNTAIN GLACIERS : < +0.5 mm/yr ICE SHEETS : ICE SHEETS : Greenland : +0.13 mm/yr (Krabill et al., 2000) Greenland : +0.13 mm/yr (Krabill et al., 2000) Antarctica : +0.16 +/- 0.05 mm/yr (WA) Antarctica : +0.16 +/- 0.05 mm/yr (WA) 0 +/- 0.07 mm/yr (EA) 0 +/- 0.07 mm/yr (EA) total = + 0.16 mm/yr total = + 0.16 mm/yr (Rignot and Thomas, 2002) LAND WATER :+0.2 mm/yr (Milly et al., 2002) LAND WATER :+0.2 mm/yr (Milly et al., 2002) TOTAL : ~1 mm/yr
 Greenland : mm/yr (Krabill et al., 2000) Antarctica : / mm/yr (WA) Antarctica : / mm/yr (WA) 0 +/ mm/yr (EA) 0 +/ mm/yr (EA) total = mm/yr total = mm/yr (Rignot and Thomas, 2002) LAND WATER :+0.2 mm/yr (Milly et al., 2002) LAND WATER :+0.2 mm/yr (Milly et al., 2002) TOTAL : ~1 mm/yr")
59
From Dyurgerov and Meier, 2002 Sea level rise due to mountain glaciers

60
Eustatic contributions from mountain glaciers, ice sheets and land waters MOUNTAIN GLACIERS : < +0.5 mm/yr MOUNTAIN GLACIERS : < +0.5 mm/yr ICE SHEETS : ICE SHEETS : Greenland : +0.13 mm/yr (Krabill et al., 2000) Greenland : +0.13 mm/yr (Krabill et al., 2000) Antarctica : +0.16 +/- 0.05 mm/yr (WA) Antarctica : +0.16 +/- 0.05 mm/yr (WA) 0 +/- 0.07 mm/yr (EA) 0 +/- 0.07 mm/yr (EA) total = + 0.16 mm/yr total = + 0.16 mm/yr (Rignot and Thomas, 2002) LAND WATER :+0.2 mm/yr (Milly et al., 2002) LAND WATER :+0.2 mm/yr (Milly et al., 2002) TOTAL : ~1 mm/yr
 Greenland : mm/yr (Krabill et al., 2000) Antarctica : / mm/yr (WA) Antarctica : / mm/yr (WA) 0 +/ mm/yr (EA) 0 +/ mm/yr (EA) total = mm/yr total = mm/yr (Rignot and Thomas, 2002) LAND WATER :+0.2 mm/yr (Milly et al., 2002) LAND WATER :+0.2 mm/yr (Milly et al., 2002) TOTAL : ~1 mm/yr")
61
since SEA LEVEL RISE of the 1990s is fully explained by thermal expansion, there is no room for an additional 1 mm/yr eustatic contribution…..

62
-0.5 0.51.01.52.00.0 1.0 mm/year 2.0 mm/year Thermal expansion Glaciers Greenland (present) Antarctica (present) Ice sheets (long term) Permafrost Sedimentary deposits TOTAL OBSERVATIONS Continental waters 20 th Century Sea Level Rise, IPCC, 2001
 Antarctica (present) Ice sheets (long term) Permafrost Sedimentary deposits TOTAL OBSERVATIONS Continental waters 20 th Century Sea Level Rise, IPCC, 2001")
63
ACCELERATION OF SEA LEVEL RISE IN THE LAST 1-2 DECADES ???

64
STERIC SEA LEVEL --------- OBSERVED BY TOPEX/POSEIDON ------ 19501990

65
194520001970 GLOBAL OCEAN - STERIC SEA LEVEL- EOF mode 1 (0-500 m ) 0-3000 m 194519702000
 m")
66
194520001970 ATLANTIC OCEAN - STERIC SEA LEVEL-EOF mode 1 0-500 m 0 -3000 m 194519702000

67
TOPEX/POSEIDON SEA LEVEL EOF mode 1 1993 2003

68
From Dyurgerov and Meier, 2002 Sea level rise due to mountain glaciers c hange in rate?

69
PERSPECTIVES

70
JASON-1

71
Global mean sea level from Topex/Poseidon and Jason-1 Global mean sea level from Topex/Poseidon and Jason-1 Jason-1

72
GRACE satellites launched on March 17, 2002

73
TEMPORAL CHANGE OF THE GRAVITY FIELD

74
GRACE MISSION: GRACE MISSION: Spatio-temporal gravity variations Resolution : 2°x2° Precision : 0.5 cm (water height) Time scale : 1 month to several years GRACE MISSION: GRACE MISSION: Spatio-temporal gravity variations Resolution : 2°x2° Precision : 0.5 cm (water height) Time scale : 1 month to several years
 Time scale : 1 month to several years GRACE MISSION: GRACE MISSION: Spatio-temporal gravity variations Resolution : 2°x2° Precision : 0.5 cm (water height) Time scale : 1 month to several years")
75
Precipitation Evaporation Transpiration Precipitation : Rivers Lakes Oceans Soil Moisture Ground Waters Atmosphere Snow Pack

77
Separation of thermal and mass contributions and mass contributions Sea level rise GRACE (land) Land water and ice sheets ice sheets mass balance mass balance Ocean water mass change GRACE (ocean) JASON
 Land water and ice sheets ice sheets mass balance mass balance Ocean water mass change GRACE (ocean) JASON")
Similar presentations

, Mallorca, SPAIN. 2 National Oceanography Centre, Southampton,>")
 Rise Estimates Average of Trends (Douglas et.>")


 Percent of Total Water Percent of Fresh Water Oceans, Seas, & Bays1,338,00096.5- Ice caps,>")


