Download presentation
Presentation is loading. Please wait.

1
The contribution of to the understanding of oscillations Leslie Camilleri CERN, PH University of Bologna November 10, 2005

2
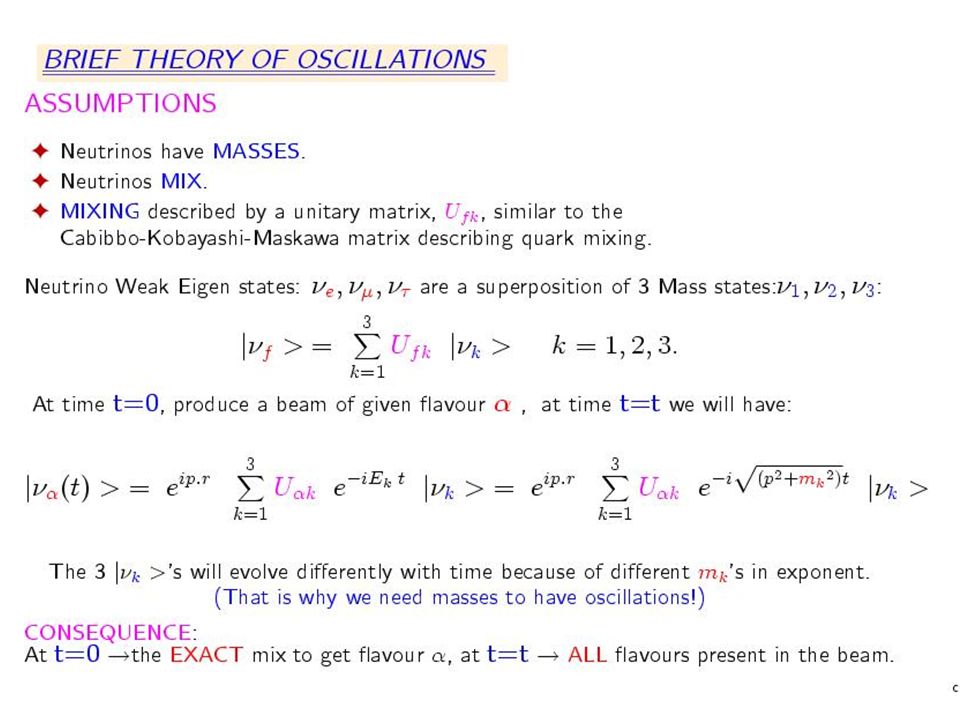
Plan of the talk A very brief theory of neutrino oscillations. The Past: The discovery of oscillations in Solar and Atmospheric neutrino experiments. The Far Future programmes: A Super-conducting Proton Linac (SPL). A beam. A Neutrino Factory The Present programmes: Double- decay Reactors Accelerator long baseline experiments. NO A
. A beam. A Neutrino Factory The Present programmes: Double- decay Reactors Accelerator long baseline experiments. NO A.")
4
Theory 2

5
Theory 3

6
The PAST Discovery of Oscillations

7
Solar spectrum

9
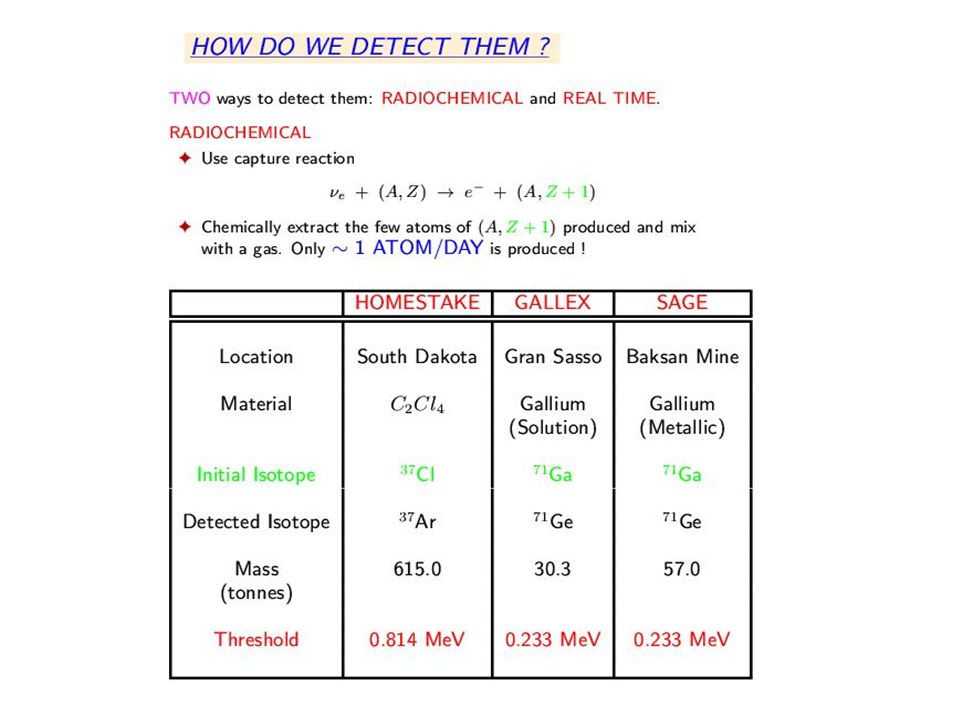
Real Time Charged Current (CC) reactions on nucleons e + n p + e - At quark level e + d u + e- Sensitive ONLY to e the flux of e Neutral Current (NC) reactions on nucleons x + n n + x Sensitive to flux from ALL flavours, e, , CC and NC on nucleons: negligible in WATER due to Oxygen being very tightly bound (>15 MeV) Important in HEAVY WATER: deuterium binding energy only 2 MeV. Elastic Scattering (ES) on electron: ES is large in WATER and HEAVY WATER Sensitive to ( ) only Sensitive to flux from ALL flavours, ( e, , ) But rate smaller than W exch.
 on electron: ES is large in WATER and HEAVY WATER Sensitive to ( ) only Sensitive to flux from ALL flavours, ( e, , ) But rate smaller than W exch..")
10
Super-Kamiokande The Detector 50000 tons ultra-pure water 1 km overburden = 2700 m.w.e. 22500 tons fiducial volume Sensitive to Elastic Scattering ONLY Mostly e ’s

11
SK-I: 8 B Solar Neutrino Flux 8 B flux = 2.35 0.02 0.08 [x10 6 /cm 2 /s] Data / SSM BP2004 = 0.406 0.004(stat.) +0.014 -0.013 (syst.) 22400 230 solar events PLB539 (2002) 179 Electron total energy: 5.0-20MeV May 31, 1996 – July 15, 2001 (1496 days ) Data / SSM BP2000 = 0.465 0.005(stat.) +0.016 -0.015 (syst.)
![SK-I: 8 B Solar Neutrino Flux 8 B flux = 2.35 0.02 0.08 [x10 6 /cm 2 /s] Data / SSM BP2004 = 0.004(stat.) (syst.) 230 solar events PLB539 (2002) 179 Electron total energy: MeV May 31, 1996 – July 15, 2001 (1496 days ) Data / SSM BP2000 = 0.005(stat.) (syst.)](http://images.slideplayer.com/26/8707052/slides/slide_11.jpg "SK-I: 8 B Solar Neutrino Flux 8 B flux = 2.35 0.02 0.08 [x10 6 /cm 2 /s] Data / SSM BP2004 = 0.004(stat.) (syst.) 230 solar events PLB539 (2002) 179 Electron total energy: MeV May 31, 1996 – July 15, 2001 (1496 days ) Data / SSM BP2000 = 0.005(stat.) (syst.)")
12
Suppression relative to Standard Solar Model Suppression relative to Standard Solar Model is observed in all experiments. Is it due to a misunderstanding as to how the sun “works” ? Standard solar model. Or are the neutrinos “disappearing” ?

13
SNO (Heavy water):Sensitive to CC, NC, ES. Calculate flux from each. Flavor content of solar flux. e only e mostly e Neutrinos DO NOT disappear. They just Change Flavour ! Driven by enhanced oscillations in the dense matter of the sun. Using ALL neutrinos Fully Consistent with Standard Solar Model NC ES SK ES CC SSM ee

14
Matter effects: Mikheyev-Smirnov-Wolfenstein e e e e N ee ee All flavours Only e flavour Introduces extra potential for e ZoZo W-W-

15
Confirmed by KAMLAND: Reactor antineutrinos to detector at Kamioka Solar Experiments KAMLAND KamLAND + Solar Completely consistent

16
Atmospheric Neutrinos: e and Zenith angle Baseline Produced by and K decays in upper atmosphere

17
/e identification sharp ring e fuzzy ring due to many particles in shower

18
Suppression of zenith angle and energy dependent Explained by oscillations No oscillations Oscillations

19
Confirmed by K2K: KEK accelerator to Super-Kamiokande Completely consistent

20
Near Future (Accelerators) OPERA (CNGS beam) ~732km MINOS (NUMI beam) 732km Confirm ~ oscillations by searching for appearance in a beam using X ... Emulsions to observe the kink in decays They look for disappearance to observe oscillatory pattern in energy spectrum. Measure m 2 and 23

21
3-family oscillation matrix S = sine c = cosine CP violation phase. drives SOLAR oscillations: sin 2 12 = 0.314 +0.056 -0.047 (+- 16%) 23 drives ATMOSPHERIC oscillations: sin 2 23 = 0.44 +0.18 -0.10 (+44% -22%) 13 the MISSING link ! sin 2 13 < 0.03 Set by a reactor experiment: CHOOZ.
 23 drives ATMOSPHERIC oscillations: sin 2 23 = (+44% -22%) 13 the MISSING link . sin 2 13 < 0.03 Set by a reactor experiment: CHOOZ..")
22
CHOOZ: A reactor experiment to measure 13 Reactors emit 6 e ’s per fission 5.6 x 10 20 e /second for a 3 GW reactor (Few MeV) Excellent source of antineutrinos. With a detector at 1 km, L/E = 1km/1MeV ~ same as atmospheric ~ 1000km/1GeV. Can probe same m 2 If they oscillate to or they would NOT have enough energy to create ’s or ’s via CC interactions. Cannot study oscillations through an “appearance” experiment. Must study oscllations via e disappearance. P ee = 1 – sin 2 2 13 sin 2 [( m 23 2 L)/(4E )] Looked for distortions of the expected energy spectrum or in the rate Did not find any. Set a limit on sin 2 2 13 > 0.12 for m 2 atm or sin 2 13 > 0.03
/(4E )] Looked for distortions of the expected energy spectrum or in the rate Did not find any. Set a limit on sin 2 2 13 > 0.12 for m 2 atm or sin 2 13 >")
23
Mass hierarchy Sign of m 2 23 m2m1m2m1 m3m3 m2m1m2m1 m3m3 m 23 2 = 2.4 x 10 -3 eV 2 m 23 2 = 2.4 x 10 -3 eV 2 m 12 2 = 7.9 x 10 -5 eV 2 > 0.05 eV 2 Normal Hierarchy Inverted Hierarchy Oscillations only tell us about DIFFERENCES in masses Not the ABSOLUTE mass scale: Direct measurements or Double decay Upper limit: Tritium decay: mass ( e ) < 2.2 eV Lower limit: (2.4 x 10 -3 ) 1/2 > 0.05 eV m 12 2 = 7.9 x 10 -5 eV 2 e
 < 2.2 eV Lower limit: (2.4 x ) 1/2 > 0.05 eV m 12 2 = 7.9 x eV 2 e ")
24
Why are neutrino masses so low???? Other particles

25
What’s needed next? Determine 13. Determine the mass hierarchy. Any CP violation in he neutrino sector?

26
Correlations in Oscillation Probability From M. Lindner: Measuring P ( ~ e ) does NOT yield a UNIQUE value of 13. Because of correlations between 13, CP and the mass hierarchy (sign of m 2 31 ) CP violation: Difference between Neutrino and Antineutrino Oscillations
 does NOT yield a UNIQUE value of 13. Because of correlations between 13, CP and the mass hierarchy (sign of m 2 31 ) CP violation: Difference between Neutrino and Antineutrino Oscillations.")
27
8-fold degeneracies 13 - ambiguity. Mass hierarchy two-fold degeneragy A measure of P e can yield a whole range of values of 13 Measuring with ’s as well reduces the correlations 23 degeneracy: For a value of sin 2 2 23, say 0.92, 2 23 is 67 o or 113 o and 23 is 33.5 o or 56.5 In addition if we just have a lower limit on sin 2 2 23, then all the values between these two are possible.

28
Correlations In vacuum and without CP violation: P( e ) vac = sin 2 23 sin 2 2 sin 2 atm with atm = 1.27 m 2 32 (L/E) For m 2 32 = 2.5 x 10 -3 eV 2 and for maximum oscillation We need: atm = /2 L(km)/E(GeV) = 495 For L = 800km E must be 1.64 GeV, and for L = 295km E = 0.6 GeV Introducing matter effects, at the first oscillation maximum: P( e ) mat = [1 +- (2E/E R )] P( e ) vac with E R = [12 GeV][ m 2 32 /(2.5x10 -3 )][2.8 gm.cm -3 / ]~ 12 GeV +- depends on the mass hierarchy. Matter effects grow with energy and therefore with distance. 3 times larger (27%) at NO A (1.64 GeV) than at T2K (0.6 GeV)
![Correlations In vacuum and without CP violation: P( e ) vac = sin 2 23 sin 2 2 sin 2 atm with atm = 1.27 m 2 32 (L/E) For m 2 32 = 2.5 x eV 2 and for maximum oscillation We need: atm = /2 L(km)/E(GeV) = 495 For L = 800km E must be 1.64 GeV, and for L = 295km E = 0.6 GeV Introducing matter effects, at the first oscillation maximum: P( e ) mat = [1 +- (2E/E R )] P( e ) vac with E R = [12 GeV][ m 2 32 /(2.5x10 -3 )][2.8 gm.cm -3 / ]~ 12 GeV +- depends on the mass hierarchy.](http://images.slideplayer.com/26/8707052/slides/slide_28.jpg "Matter effects grow with energy and therefore with distance. 3 times larger (27%) at NO A (1.64 GeV) than at T2K (0.6 GeV).")
29
The FAR Future

30
Superconducting Proton Linac Power : 4 MW Kinetic Energy : 2.2 GeV (3.5 GeV) Repetition Rate: 50 Hz Spill Length: 11 msec. Accumulator needed to shorten pulse length. Target: Liquid Mercury Jet to cope with stress due to high flux. Focusing: Horn and Reflector optimized for 600 MeV/c particles Decay Tunnel: 20m long 1m radius Distance: 130km Neutrino energy to be at oscillation maximum for m 23 2 = 2.5 x 10 -3 eV 2 260 MeV Detector mass: 440 kton fiducial. Type: Water Cerenkov (Super-K) Location: New lab in Frejus tunnel
 Location: New lab in Frejus tunnel.")
31
Advantage of mixing neutrino and antineutrino running 3.5 and 4.5 GeV proton beam 260 and 350 MeV options 5 years of running. 2 years of running and 8 years of running The limit IMPROVES near = 90 o Limit: ~0.001

32
Beta beams Idea introduced by Piero Zucchelli. Accelerate radioactive ions decaying via + or -. Because of Lorentz boost, the decay electron neutrinos or antineutrinos will be focused forward into a beam. Look for: Appearance of or Advantages: “Clean” beams with no intrinsic component. Precisely calculable energy spectra. Energy of beam tunable through acceleration of ions. Accelerate protons in SPL Impinge on appropriate source Bunch resulting ions Accelerate ions in PS and SPS. Store in decay ring. 8 bunches. Favourite scheme: 6 He 6 Li + e - + e 18 Ne 18 Ne + e + + e Half lives: 0.8 sec and 0.64 sec. Detector: Same as for SPL (Frejus)
.")
33
sensitivity for = 60,100 Statistics limited CP violation Asymmetry decreases with increasing 2% Syst. Unc. 2.9 x 10 18 6 He ions and 1.2 x 10 18 18 Ne ions per year decaying in straight sections M. Mezzetto SPSC Villars 3 Down to ~ = 35 o Sin 2 2

34
Neutrino Factory p s 1.2 10 14 s =1.2 10 21 yr 0.9 10 21 yr 3 10 20 e yr 3 10 20 yr e + e oscillates e interacts giving WRONG SIGN MUON interacts giving Need to measure charge Magnetic detector e + e

35
Neutrino Factory

36
The NEAR Future

37
Neutrinoless Double- decay e-e- e-e- W-W- W-W- e-e- e-e- i W-W- W-W- N N´N´ N´N´ N Standard 2-neutrino double decay Neutrinoless double decay Can only happen if the neutrino is reabsorbed as an Antineutrino Helicity must flip non-zero mass If the neutrino is its own Antiparticle: Majorana i i (A,Z) (A,Z+2) + 2 e -
 (A,Z+2) + 2 e -")
38
Detection arbitrary units (Q ~ MeV) Look for a peak at the end point of the2-neutrino spectrum One claim: not generally believed New experiments will use: 130 Te, 132 Xe, 76 Ge, 100 Mo Will observe the 2 electrons through bolometric, calorimetric or tracking techniques
 Look for a peak at the end point of the2-neutrino spectrum One claim: not generally believed New experiments will use: 130 Te, 132 Xe, 76 Ge, 100 Mo Will observe the 2 electrons through bolometric, calorimetric or tracking techniques")
39
Limits Claim Rate = (T o ½ ) -1 = (Phase space factor) x (Matrix element) 2 x 2 = | U e1 2 m 1 + U e2 2 m 2 +U e3 2 m 3 | New experiments will go down 100-300 milli eV Small if m 3 is heaviest state, because multiplied by U e3 2 (= sin 2 13 ) which is small (<0.03). Better with inverted hierarchy

40
13 with Reactors P ee = 1 – sin 2 2 13 sin 2 [( m 23 2 L)/(4E )] near oscillation maximum Advantage: NO dependence on CP or mass hierarchy: No ambiguities. Disadvantage: Cannot determine them! Measured through inverse decay: e + p = e+ + n Distortion of the e energy spectrum Oscillation effects are SMALL Must know e energy spectrum well to control SYSTEMATICS. CHOOZ: One detector at 1100m Systematic uncertainty: 2.7%
![ 13 with Reactors P ee = 1 – sin 2 2 13 sin 2 [( m 23 2 L)/(4E )] near oscillation maximum Advantage: NO dependence on CP or mass hierarchy: No ambiguities.](http://images.slideplayer.com/26/8707052/slides/slide_40.jpg "Disadvantage: Cannot determine them. Measured through inverse decay: e + p = e+ + n Distortion of the e energy spectrum Oscillation effects are SMALL Must know e energy spectrum well to control SYSTEMATICS. CHOOZ: One detector at 1100m Systematic uncertainty: 2.7%.")
41
Technique Solution: Use 2 detectors Additional NEAR detector: measure flux and cross sections BEFORE oscillations. Even better: interchange NEAR and FAR detectors part of the time to reduce detector systematics Detectors : Liquid scintillator loaded with gadolinium: Neutron capture photons p p e+e+ e-e- e+e+ 511 keV n n p 2.2 MeV ~200 s e e + annihilates with e - of liquid: MeV n captured by Gadolinium: 8 MeV of photons emitted within 10’s of sec. Delayed Coincidence of 2 signals

42
Proposed experiments ExperimentLocation SitesSystematicsLimit Double CHOOZFranceNear/Far0.6%0.02 BraidwoodUSANear/Far0.3%0.005 Daya BayChinaNear/Mid/Far0.36-0.12%0.009-0.006 Example: Double CHOOZ 1% 0.4% Importance of systematics 0.035 0.027 CHOOZ systematics Was 2.7%

43
Future (Accelerators) T2K (Japan) 295km NO A (NUMI beam) 810km Both projects are Long Baseline Off-axis projects. They search for ~ e oscillations by searching for e appearance in a beam. Determine that is non-zero Measure it? Mass hierarchy?

44
OFF-AXIS Technique Most decay pions give similar neutrino energies at the detector: The Neutrino Energy Spectrum is narrow: know where to expect e appearance Can choose the off-axis angle and select the mean energy of the beam. ( Optimizes the oscillation probability) Target Horns Decay Pipe Super-K. 2 o 3 o
 Target Horns Decay Pipe Super-K. 2 o 3 o.")
45
T2K 0.7 GeV e from K (hashed) and decays 0.4 % background at peak e New 40 GeV Proton Synchrotron (JPARC) Reconstructed Super-K Near detector to measure unoscillated flux distance of 280 m (Maybe 2km also) JPARC ready in 2008 T2K construction 2004-2008 Data-taking starting in 2009
 and decays 0.4 % background at peak e New 40 GeV Proton Synchrotron (JPARC) Reconstructed Super-K Near detector to measure unoscillated flux distance of 280 m (Maybe 2km also) JPARC ready in 2008 T2K construction Data-taking starting in 2009")
46
disappearance: m 23 2 and 23. Position of dip m 23 2 to an accuracy of ~ 10 -4 eV 2 Depth of dip Sin 2 2 23 to an accuracy of 0.01 Factor of 10 improvement in both

47
Measurement of 13. e appearance

48
Sensitivity, correlations, degeneracies But, the limit on sin 2 2 is much worse if we take into account correlations and degeneracies Sin 2 2 13 ~ 0.04 CP 150

49
T2K II: Hyper-Kamiokande One megaton Water Cerenkov and 4MW accelerator. 0.01 0.001 +150 o -150 o sin 2 2 13 Improvement by more than an order of magnitude on 13 sensitivity All degeneracies included

50
T2K II: Sensitivity to CP Definition: For each value of sin 2 2 13 : The minimum for which there is a difference Of 3 between CP and NO CP violation Limited by statistics CP violation asymmetry ( bar) decreases with increasing sin 2 2 13 Sin 2 2 13 0.01 0.0001 20 o 50 o
 decreases with increasing sin 2 2 13 Sin 2 2 o 50 o ")
51
NO A Detector Given relatively high energy of NUMI beam, decided to optimize NO A for resolution of the mass hierarchy Detector placed 14 mrad (12 km) Off-axis of the Fermilab NUMI beam (MINOS). At Ash River near Canadian border (L = 810km) : New site. Above ground. Fully active detector consisting of 15.7m long plastic cells filled with liquid scintillator: Total mass 30 ktons. Each cell viewed by a looped WLS fibre read by an avalanche photodiode (APD) 760 000 cells TiO 2 Coated PVC tubes
 : New site. Above ground. Fully active detector consisting of 15.7m long plastic cells filled with liquid scintillator: Total mass 30 ktons. Each cell viewed by a looped WLS fibre read by an avalanche photodiode (APD) cells TiO 2 Coated PVC tubes.")
52
NO A The quantum efficiency of APD’s is much higher than a pm’s: ~80%. Especially at the higher wave lengths surviving after traversing the fibre. Measured Photoelectrons Per muon track 30 pe Asic for APD’s: 2.5 pe noise S/N ~ 12 After15.7m still 30 photoelectrons/mip. with looped fibre. Coating:15% TiO 2

53
Avalanche Photodiode Hamamatsu 32 APD arrays Pixel size 1.8mm x 1.05mm (Fibre 0.8mm diameter) Operating voltage 400 Volts Gain 100 Operating temperature: -15 o C (reduces noise) Photon Asic for APD’s: 2.5 pe noise S/N ~ 30/2.5 = 12
 Operating voltage 400 Volts Gain 100 Operating temperature: -15 o C (reduces noise) Photon Asic for APD’s: 2.5 pe noise S/N ~ 30/2.5 = 12")
54
APD response Measured with light equivalent to one and two mip’s Noise Signal well separated from noise 0 20 40 60 80 pe

55
The Beam PROTONS: 6.5 x 10 20 protons on target per year. Greatly helped by Cancellation of BTeV Termination of Collider programme by 2009. A gain of a factor of > 2 in numbers of protons delivered. Longer term: Construction of an 8 GeV proton driver: x 4 25.2 x 10 20 protons on target per year is the goal.

56
The Beam: Same NUMI beam as MINOS 14 mrad Can select low, medim and high energy beams by moving horn and target Best is the Medium energy beam

57
Beam spectra Signal Sin 2 2 13 = 0.04 Beam e background ~ 0.5%

58
e separation Electrons (shower) Electrons (shower) Muons Low energyHigh energy o in NC also a problem. Signal e efficiency: 24%. CC background 4 x 10 -4 NC background 2 x 10 -3

59
Location

60
3 discovery limits for 13 = 0 Discovery limit is better than 0.02 for ALL ’s and BOTH mass hierarchies. 2.5 years each and . 5 years

61
3 discovery limits for 13 = 0 Comparison with Proton Driver 2.5 years each and .

62
3 discovery limits for 13 = 0 Comparison with T2K and 2 Reactor experiments Braidwood Double Chooz T2K

63
Resolution of mass hierarchy Fraction of over which the mass hierarchy can be resolved at qual amounts of neutrino and antineutrino running: 3 years each assuming Phase I. Near the CHOOZ limit the mass hierarchy can be resolved over 50% of the range of . T2K Phase I can only resolve the hierarchy in a region already excluded by CHOOZ. Because of its lower energy. Some small improvement if we combine T2K and NO A results CHOOZ limit T2K

64
Looking further ahead With a proton driver, Phase II, the mass hierarchy can be resolved over 75% of near the CHOOZ limit. In addition to more protons in Phase II, to resolve hierarchy a second detector at the second oscillation maximum can be considered: atm = 1.27 m 2 32 (L/E) = L/E = 1485, a factor of 3 larger than at 1 st max. For ~ the same distance, E is 3 times smaller: matter effects are smaller by a factor of 3 50 kton detector at 710 km. 30km off axis (second max.) 6 years (3 + 3 ) Determines mass hierarchy for all values of down to sin 2 2 13 = 0.02
 = L/E = 1485, a factor of 3 larger than at 1 st max. For ~ the same distance, E is 3 times smaller: matter effects are smaller by a factor of 3 50 kton detector at 710 km. 30km off axis (second max.) 6 years (3 + 3 ) Determines mass hierarchy for all values of down to sin 2 2 13 =")
65
CP reach To look for CP violation requires the proton driver. But combining with a second detector is what really becomes SIGNIFICANT. Proton driver Proton driver + 2 nd detector

66
Near Detector to understand the beam 262 T 145 T totally active 20.4 T fiducial (central 2.5 x 3.25 m) 8-plane block 10.6 T full 1.6 T empty Muon catcher 1 m iron Target region Veto region 9.6 m 5 m 3.5 m Shower containment region
 8-plane block 10.6 T full 1.6 T empty Muon catcher 1 m iron Target region Veto region 9.6 m 5 m 3.5 m Shower containment region")
67
Near detector locations M Test MINOS Surface Building NuMI Access Tunnel

68
Cost and schedule Total cost (Far and near detectors, building, admin etc…) 164 M$ (including 50% contingency) Status Approved by Fermilab Program Advisory Committee Going through reviews Schedule Assumption: Approval in 2006. Building ready: May 2009. First kiloton: October 2009. Completion: July 2011. Possible CERN participation. European groups already in NO A: Athens, College de France, Tech. Univ. Munich, Oxford, Rutherford

69
Status of NUMI/MINOS: Near detector They get ~ 2.5 x 10 13 protons/spill Spill: either 2.2 or 3.8 secs. (Depends on antiproton cooling) Delivered so far: 0.8 x 10 20. With 2.5 x 10 13 and 2 sec spill 2.5 x 10 20 /year With a factor of ~ 2 from stopping collider ~ 5 x 10 20 Not Far off NOvA target…! Event time in Spill Structure: Booster batches Energy of CC events For running in 3 configurations: Only target moved Direction of track In CC events Relative to nominal beam
 Delivered so far: 0.8 x With 2.5 x and 2 sec spill 2.5 x /year With a factor of ~ 2 from stopping collider ~ 5 x Not Far off NOvA target…. Event time in Spill Structure: Booster batches Energy of CC events For running in 3 configurations: Only target moved Direction of track In CC events Relative to nominal beam.")
70
Status of NUMI/MINOS: Far detector Blind analysis. Plots are for 1 week running. Should have about 500 CC events if no oscillations Event time in Spill Structure: Booster batches Cosmic rays: from above 180 o Beam events: 90 o

71
Conclusions The neutrino oscillation programme is very rich. The smallness of neutrino masses is fascinating. The mass hierarchy must be determined. Is there any CP violation in the neutrino sector? The road to these is the observation of a non-zero The NUMI beam is functioning well. NO A has a well-developed long term research programme.

72
Near Detector in MINOS Surface Building 45,000 CC events2,200 e CC events 6.5 x 10 20 pot in 75 mrad off-axis beam Kaon peak

73
Neutrino spectra at near and far detectors CC events e CC events Far Detector x 800 Site 1.5 Site 2

74
3 Determination of CP Violation

Similar presentations


 Atmospheric Solar –SNO & SK-I Active solar –SK.>")
 S = sine c = cosine CP violation phase. drives SOLAR.>")


