Download presentation
Presentation is loading. Please wait.

1
REMS 6022 – Lab 4 NEST – Interferometric Synthetic Aperture Radar Exercises
I hope its ok to do these InSAR exercises as the lab. I kept getting errors in the oil slick lab. It wouldn’t let me proceed past the oil detection tool, the software kept crashing. Venessa Bennett

2
InSAR Course - Overview
Two training exercises are summarized in the following presentation. The exercise represent training in the use of the NEST SAR toolbox developed by ESA. Exercise 1 is the generation of an Interferogram on Etna Volcano and exercise 2 is the generation of an interferogram of the BAM earthquake. BACKGROUND Radar interferometry: Study of interference patterns caused created by combining two sets of radar signals. Interferogram: When two interferometric radar data sets are combined the first product made is called an interferogram

3
InSAR - Theory Interferometric Synthetic Aperture Radar (InSAR) is a geodetic technique that can identify movements of the Earth's surface Observations of surface movement made using InSAR can be used to detect, measure, and monitor crustal changes associated with geophysical processes such as tectonic activity and volcanic eruptions Ground subsidence caused by anthropogenic influences such as groundwater or hydrocarbon extraction can also be identified with InSAR When combined with ground-based geodetic monitoring, such as GPS, InSAR can identify surface movements of millimetre to centimetre scale with high spatial resolution. SOURCE:

4
InSAR - Theory InSAR uses two or more Synthetic Aperture Radar (SAR) images of an area to identify surface movements through time. Remote sensing satellites that collect SAR imagery transmit pulses of microwave energy to the Earth's surface and record the amount of backscattered energy. SAR images contain information on the Earth's surface in the form of the amplitude and phase components of the backscattered radar signal The amplitude image records information on the terrain slope and surface roughness, while the phase image records information on the distance between the satellite and the Earth's surface. SOURCE:

5
InSAR - Theory Differential InSAR uses two SAR images of the same area acquired at different times. If the distance between the ground and satellite changes between the two acquisitions due to surface movement, a phase shift will occur SOURCE:

6
InSAR - Theory

7
InSAR - Theory

8
InSAR - Theory

9
IMAGE 1 Acquisition start : 01-Aug-1995 21:16:47.897
Exercise 1: Generation of an interferogram on ETNA Vulcano, Sicily (Italy), using a ERS1&2 couple acquired on 1/2 August 1996. IMAGE 1 Acquisition start : 01-Aug :16:47.897 IMAGE 2 Acquisition start: 02-Aug :16:50.666 STEPS 1. DATA PREPARATION Load data Create new project Apply ephemeris information to data coregister both input images (cubic convolution resampling method) 2. GENERATE INTERFEROGRAM Use InSAR Tools to generate flattened interferogram Estimate coherence between 2 input images and compare two images (two wave sources are coherent if they have a constant phase difference and the same frequency) Carry out topographic phase removal Complete multilook analysis Geocode and Review in Google Earth
, using a ERS1&2 couple acquired on 1/2 August IMAGE 1 Acquisition start : 01-Aug :16: IMAGE 2 Acquisition start: 02-Aug :16: STEPS. 1. DATA PREPARATION. Load data. Create new project. Apply ephemeris information to data. coregister both input images (cubic convolution resampling method) 2. GENERATE INTERFEROGRAM. Use InSAR Tools to generate flattened interferogram. Estimate coherence between 2 input images and compare two images. (two wave sources are coherent if they have a constant phase difference and the same frequency) Carry out topographic phase removal. Complete multilook analysis. Geocode and Review in Google Earth.")
10
Mt Etna Interferograms

11
Mt Etna Interferogram Coherence

12
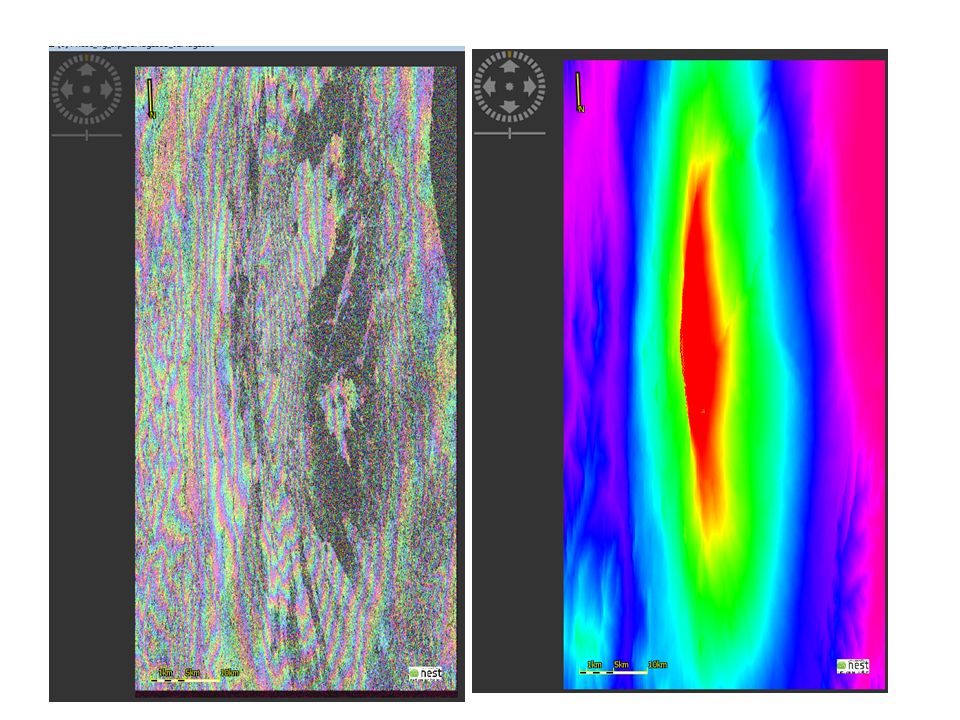
Mt Etna Interferogram vs Coherence

13
Mt Etna Topographic Phase Removal

15
Mt Etna Topographic Phase Removal

16
Does not work in NEST 5.1 as in NEST 4B-1
Mt Etna Multilook Does not work in NEST 5.1 as in NEST 4B-1

17
Mt Etna Geocode and Review in Google Earth

18
Exercise 2: Generation of DInSAR inteferogram of the BAM earthquake
IMAGE 1 Acquisition start 03-Dec :13:06.358 IMAGE 2 Acquisition start: 11-Feb :13:03.504 Graph builder is used to process the data 1. DATA PREPARATION Load data Create new project coregister both input images (cubic convolution resampling method) 2. GENERATE INTERFEROGRAM Use InSAR Tools to generate flattened interferogram Estimate coherence between 2 input images and compare two images 3. Hue Saturation Intensity Visualization
 2. GENERATE INTERFEROGRAM. Use InSAR Tools to generate flattened interferogram. Estimate coherence between 2 input images and compare two images. 3. Hue Saturation Intensity Visualization.")
19
Graph Builder Model

20
BAM flattened Interferogram & Coherence Images

21
Mt Etna Interferogram vs Coherence

22
HSV Visualization

Similar presentations

 Falah FAKHRI Harokopio University.>")

: principles>")


 What's the difference>")
 : a high resolution 2-D ground mapping technique.>")
 Geophysics (Deformation via GPS and InSAR, Seismicity, etc. )>")


