Download presentation
Presentation is loading. Please wait.

1
Extending Group-Based Trajectory Modeling to Account for Subject Attrition (Sociological Methods & Research, 2011) Amelia Haviland Bobby Jones Daniel S. Nagin

2
4% 28% 52% 16%

3
Trajectories Based on 1979 Dutch Conviction Cohort

4
The Likelihood Function

5
Missing Data Two Types – Intermittent missing assessments (y 1, y 2,.,y 4,.,y 6 ) – Subject attrition where assessments cease starting in period τ (y 1, y 2, y 3,.,.,.) Both types assumed to be missing at random Model extension designed to account for potentially non-random subject attrition No change in the model for intermittent missing assessments
 – Subject attrition where assessments cease starting in period τ (y 1, y 2, y 3,.,.,.) Both types assumed to be missing at random Model extension designed to account for potentially non-random subject attrition No change in the model for intermittent missing assessments")
6
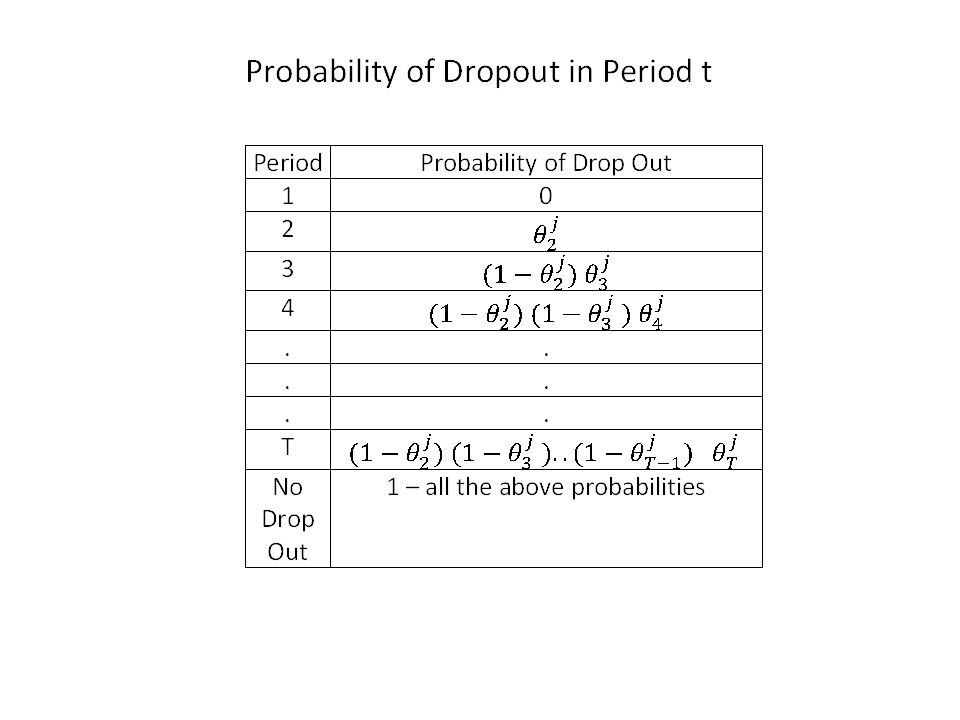
Some Notation τ i =period t in which subject i drops out T=number of assessment periods = Probability of Drop out in group j in period t

8
The Dropout Extended Likelihood for Group j

9
Specification of Binary Logit Model Predictor Variables – Fixed characteristics of i, – Prior values of outcome, If trajectory group was known within trajectory group j dropout would be “exogenous” or “ignorable conditional on observed covariates” Because trajectory group is latent, at population level, dropout is “non-ignorable”

10
Simulation Objectives Examine effects of differential attrition rate across groups that are not initially well separated Examine the effects of using model estimates to make population level projections

11
Simulation 1: Two Group Model With Different Drop Probabilities and Small Initial Separation 10 No dropout Slope=.5 Time E(y) Time
 Time")
12
Group 1 Per Period Dropout Probability Expected Group 1 Assessment Periods Probability of Group 1 Dropout on or before Period 6 Model Without Dropout Model With Dropout Group 1 Prob. Est. ( π 1 ) Percent Bias Group 1 Prob. Est. ( π 1 ) Percent Bias Dropout Prob. Est. 06.00.200 0.0.200 0.0.000.055.3.226.171-14.5.199-0.5.051.104.7.410.146-27.0.199-0.5.099.154.2.556.122-39.0.200 0.0.150.203.7.672.100-50.0.199-0.5.199.253.3.762.079-60.5.200 0.0.250.302.9.832.061-69.5.199-0.5.301.352.6.884.046-77.0.199-0.5.350.402.4.922.034-83.0.199-0.5.398 Simulation Results: Group 1 and Group 2 Initially not Well Separated
 Percent Bias Group 1 Prob. Est. ( π 1 ) Percent Bias Dropout Prob. Est Simulation Results: Group 1 and Group 2 Initially not Well Separated.")
13
An Important Distinction from Zhang and Rubin (2003) Dropout due death – Subject exits population of interest-the living – Data said to be “truncated” Dropout due termination of study participation – Subject exits the sample but remains in the population – Data said to be censored
 Dropout due death – Subject exits population of interest-the living – Data said to be truncated Dropout due termination of study participation – Subject exits the sample but remains in the population – Data said to be censored")
14
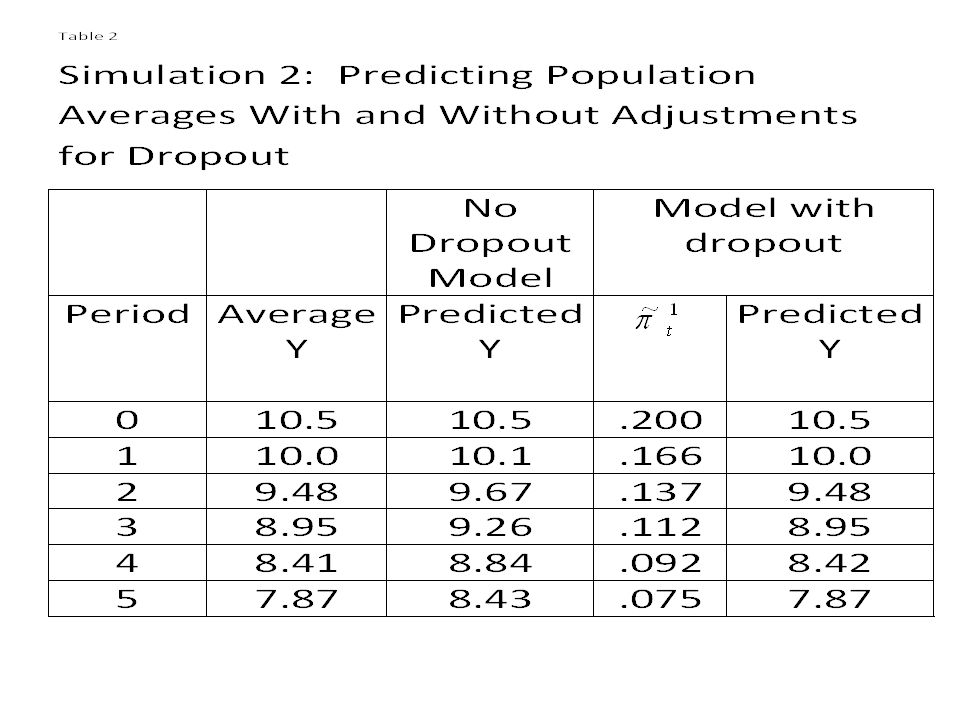
Simulation 2: Projecting to the Population Level from Model Parameter Estimates

15
Simulation 2 Continued 12.5 10 No Dropout Dropout=.2 per period

17
Chinese Longitudinal Healthy Longevity Survey (CLHLS) Random selected counties and cities in 22 provinces 4 waves 1998 to 2005 80 to 105 years old at baseline 8805 individual at baseline 68.9% had died by 2005 Analyzed 90-93 years old cohort in 1998
 Random selected counties and cities in 22 provinces 4 waves 1998 to to 105 years old at baseline 8805 individual at baseline 68.9% had died by 2005 Analyzed years old cohort in 1998")
18
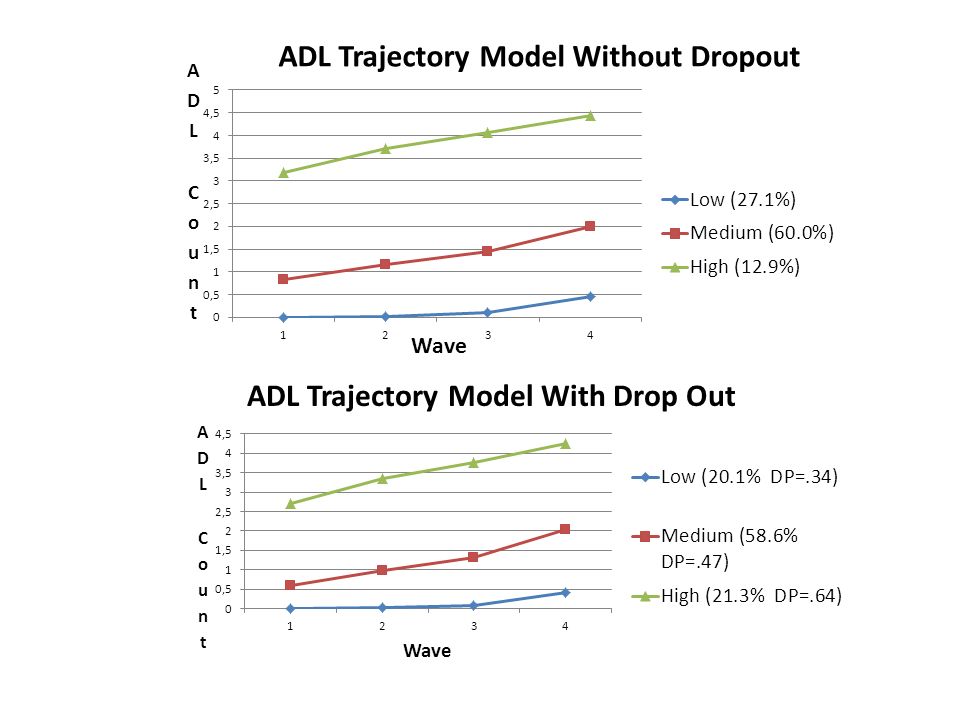
Activities of Daily Living On your own and without assistance can you: – Bath – Dress – Toilet – Get up from bed or chair – Eat Disability measured by count of items where assistance is required

22
Adding Covariates to Model to Test the Morbidity Compression v. Expansion Hypothesis Will increases in longevity compress or expand disability level in the population of the elderly? “Had a life threatening disease” at baseline or prior is positively correlated with both ADL counts at baseline and subsequent mortality rate. Question: Would a reduction in the incidence of life threatening diseases at baseline increase or decrease the population level ADL count?

23
Testing Strategy and Results Specify group membership probability ( π j ) and dropout probability ( ) to be a function of life threatening disease variable Both also functions of sex and dropout probability alone of ADL count in prior period Life threatening disease significantly related to group membership in expected way but has no relationship with dropout due to death Thus, unambiguous support for compression
 and dropout probability ( ) to be a function of life threatening disease variable Both also functions of sex and dropout probability alone of ADL count in prior period Life threatening disease significantly related to group membership in expected way but has no relationship with dropout due to death Thus, unambiguous support for compression")
24
Projecting the reduction in population average ADL count from a 25% reduction in the incidence of the life threatening disease at baseline Year1998200020022005 Reduction (%)3.02.21.5.7 Projected % Reduction in Population Average ADL Count
 Projected % Reduction in Population Average ADL Count")
25
Conclusions and Future Research Large differences in dropout rates across trajectory groups matter Future research – Investigate effects of endogenous selection – Compare results in data sets with more modest dropout rates – Further research morbidity expansion and contraction

Similar presentations


 David Madigan Rosenbaum, P.R. (2002). Observational Studies (2 nd edition). Springer.>")


. Involves the collection and analysis of highly structured.>")


