Download presentation
Presentation is loading. Please wait.

1
Modeling asset and Liability cashflows in a dynamic setting: Basic tools and risk measures 2000 CAS DFA Seminar Robert J. Walling Paratus consulting limited london - bloomington - Chicago - San Francisco - Boston

2
“The good old days”

3
Point estimate modeling Advantages –Straight-forward –Easy to Explain –Point Estimate Drawbacks –Over-Simplified –May Lack Diagnostic Detail –Depends on the Past Repeating Itself –One Set of Economic Assumptions –One Set of Investment Assumptions –One Set of Market Assumptions –No Feedback Between Rate Action & Premium

4
Scenario Testing

5
Advantages –Straight-forward –Easy to Explain –Still Provides Point Estimate –Allows for Different Conditions Drawbacks –Over-Simplified –May Lack Diagnostic Detail –Depends on the Past Repeating Itself –No Feedback Between Rate Action & Premium –“Wishful Thinking” Risk

6
Loss ratio Modeling

7
Loss ratio modeling Advantages –Straight-forward –Easy to Explain –Still Provides Point Estimate –Allows for Different Conditions –Works Well for Relatively Stable Lines Drawbacks –Over-Simplified –May Lack Diagnostic Detail –Depends on the Past Repeating Itself –No Feedback Between Rate Action & Premium –“Wishful Thinking” Risk –Can Struggle with Large Losses –Does not Separate Business & Liability Risk

8
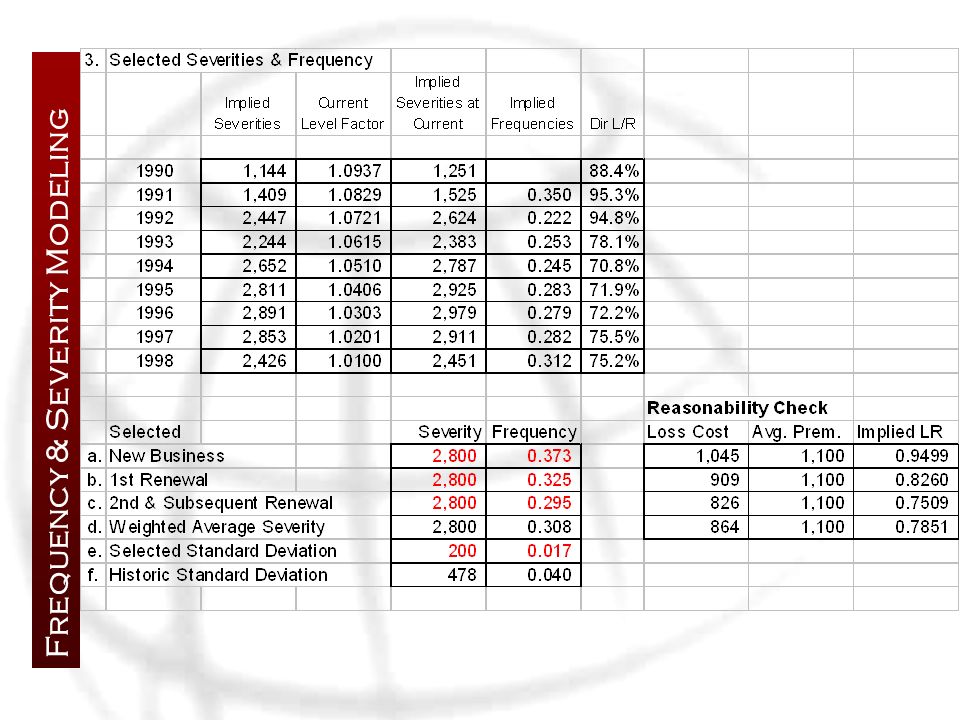
Frequency & Severity Modeling

10
Frequency & Severity modeling Advantages –Provides Diagnostic Detail –Allows Different Trend Factors –Still Provides Point Estimate –Allows for Different Conditions Drawbacks –Can be Over-Complicated –Difficult to Parameterize with Limited Data

11
convolution Modeling

12
convolution modeling Advantages - Lots of Detail - Allows for Large Single Events Drawbacks –Lots of Detail

13
Why Enhance Rate Modeling? Key to Underwriting Cash Flows Imprecise Process at Many Companies Key Decision-Making Element Deterministic Approach Over-Simplified Somewhat Controllable Premium Growth does not Quantify Underlying Exposure Changes

14
Approaches to Rate Modeling Inflation Only Demand Curves that Respond to U/W Cycle Competitive Need Indicated Rate Need Blended Approaches Retention Modeling

16
Rate Modeling Assumptions: - 4% Line Specific Inflation - Market Demands –5% Rate Change to Meet Growth Objectives - Sufficient Data Available to Calculate Indicated Rate Need

17
Rate Modeling Results

18
Rate Modeling – Additional Considerations Underwriting Cycle Jurisdictional Risk Retention Behavior New Business Success (Hit Ratios)
")
19
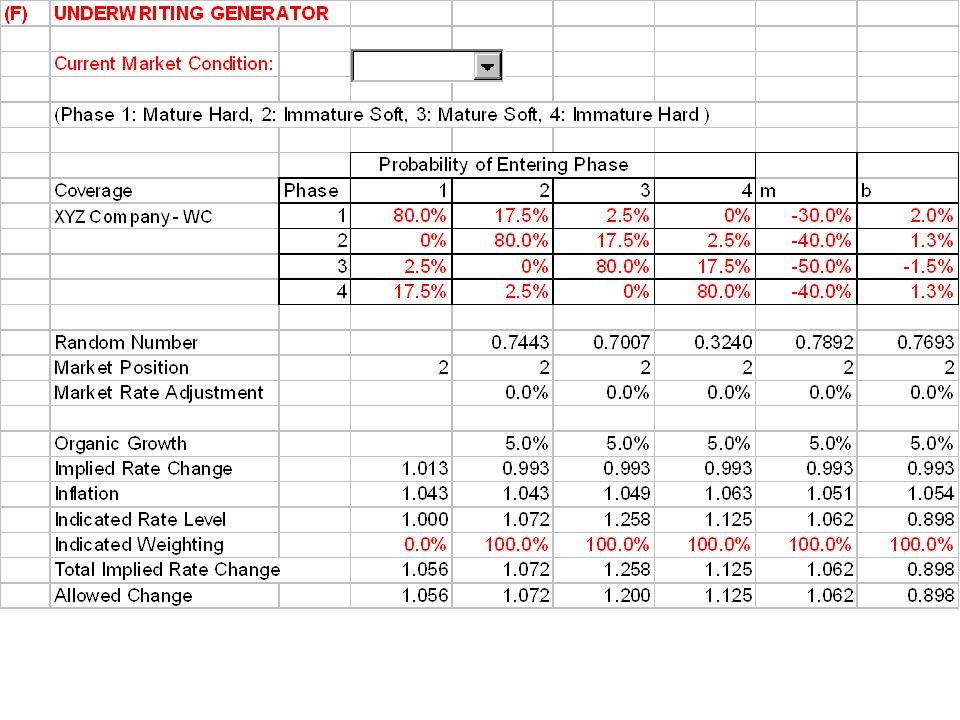
The Underwriting Cycle? Difficult to quantify Affects average rate charged or number of exposures written Everybody has a different opinion on what drives the cycle –Interest rates –Industry capacity When will it turn?

20
Underwriting Cycle Components Current perceived position Probability of turning Demand curve –Expected rate change based upon desired exposure growth –Based upon competitive pressures –Unique for individual companies –May be unique by state

21
Jurisdictional Risk Risk characteristics unique to individual states: Residual market burdens Rate “stickiness” Judicial climate Legislative climate Regulatory climate Implementation lag

22
Jurisdictional Risk Components Allowable rate changes –Without going thru extensive filing support –Increases –Decreases Implementation lag –Includes systems Potential Regulatory “Shocks” As perceived by company

23
Jurisdictional Risk Components

24
Modeling Retention Renewal Behavior Depends on: Customer Characteristics Change in Pricing on Renewal Competitive Positioning Suggested Curve: Has Flexible Shape Accommodates GLM Estimation Creates Actuarially Intuitive Scenarios

25
Modeling Retention Premium Retention can be modeled as: where: P 1 = Proposed Rate Level P 0 = Current Rate Level P M = Market Level

27
Benefits of Rate Modeling Allows Pricing to be Dynamic to Market and Underwriting Conditions. Allows Reflection of Inflationary Pressures that are Impacting Losses and/or Exposures. Flexible Enough to Approximate Actual Company Rate Setting Processes. Allows for Balance of Adequacy and Marketability.

28
Why Enhance Underwriting Expense Modeling? Start-up Organization or Line of Business or Distribution Channel with Initial Fixed Costs Some Lines of Business have Significant Fixed Costs Significant Growth/Shrinkage or Technology Changes may Require the Buying or Selling of Fixed Items

29
Approaches to Underwriting Expense Modeling All Variable with Direct Written Premium Some Portion of General and Other Acquisition is Fixed Per Unit Cost (e.g. Policy Counts) “Sticky” Fixed Expenses (Shed some fixed expense elements once DWP increases/decreases by some amount)
 Sticky Fixed Expenses (Shed some fixed expense elements once DWP increases/decreases by some amount).")
30
Expense modeling

31
U/W Expense Modeling Results

32
U/W Expense Modeling Benefits Allows Companies to Focus on Operational Efficiency Allows Companies to Incorporate Staffing Models into DFA Allows Better Forecasts of U/W Expense Results in Growth/Decline Scenarios Allows More Accurate Measurement of Expense Component of New Business Penalty

Similar presentations


 Seminar on Ratemaking Nashville, TNRuss Bingham March 11-12, 1999Hartford Financial Services.>")

>")


 Discount explicit forecast period CF 2) Capitalize continuing value = Add 1 + 2 for value.>")
 Course : Security Analysis and Portfolio Management Unit I: Introduction to Security Analysis Lesson No. 1.3–>")


