Download presentation
Presentation is loading. Please wait.

2
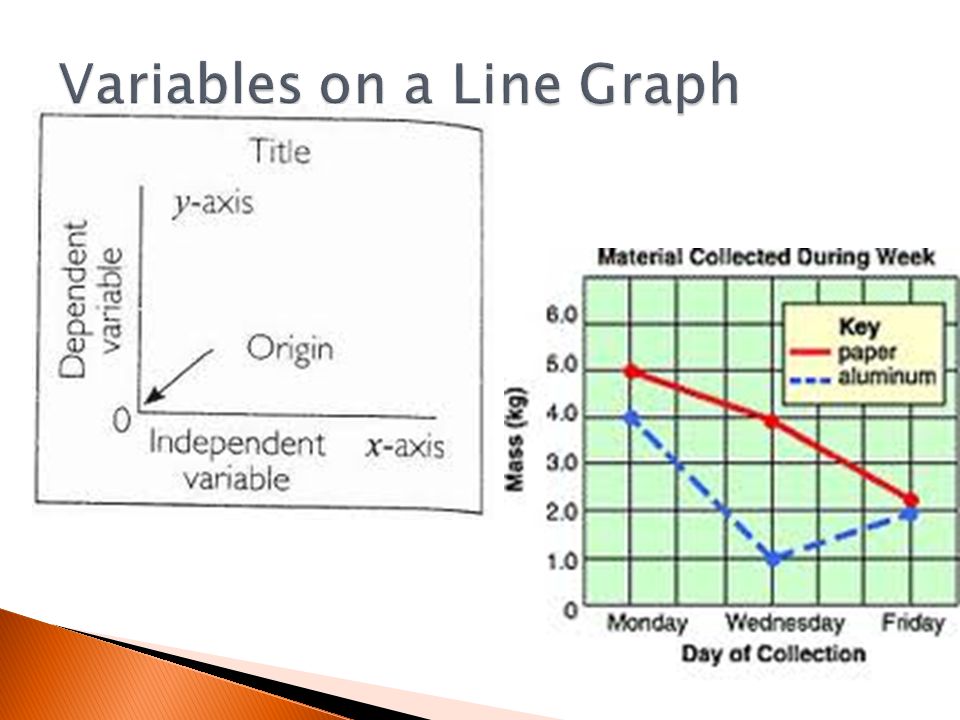
Line graph - Measures change over time

3
Measures counted information

4
Measures parts of a whole OR %

5
Linear Non-LinearConstant

6
Tables that organize data or information You make graphs from data tables

8
Roughly (guess) calculate or judge the value, number, quantity, amount
 calculate or judge the value, number, quantity, amount")
9
What is the formula? Practice: 1. If the ball has a mass of 24 g and a volume of 6 mL, what is the density of the ball? 2. If a juice box has a volume of 3 mL and a mass of 12 g, what is the density of the ball?

Similar presentations