Download presentation
Presentation is loading. Please wait.

1
Proof of Concept and Dose Estimation in Phase II Clinical Trials Bernhard Klingenberg Asst. Prof. of Statistics Williams College Slides, paper and R-code available at: www.williams.edu/~bklingen

2
Outline Introduction Goals Traditional Methods Trend / Contrast Tests Modeling Advantages/ Disadvantages Unified Framework Methodology Candidate set Permutation distribution of penalized LR-test Dose Estimation C.I. for target dose Example Establish PoC for GI data (parallel, 5 dose clinical trial) Estimate target dose
 Estimate target dose.")
3
Introduction Existence, nature and extent of dose effect Four questions (Ruberg, 1995): 1.Is there any evidence of a dose effect (PoC)? 2.Which doses exhibit a response different from control? 3.What is the nature of the dose-response relationship? 4.What dose should be selected for further study/marketing? Answer: Trend or single/multiple contrast tests Answer: Statistical modeling, GLMs; dose estimation via inverse regression

4
Introduction GI Example:

5
Introduction Trend / Contrast Tests for binary responses: General form of test statistic(s): Cochran-Armitage: Dunnett: Williams, Hirotsu, Marcus, Helmert,… PoC: > critical value
: Cochran-Armitage: Dunnett: Williams, Hirotsu, Marcus, Helmert,… PoC: > critical value")
6
Introduction Modeling approach for binary responses: General form of model: E.g., logistic regression: PoC: Get target dose estimate from fitted model

7
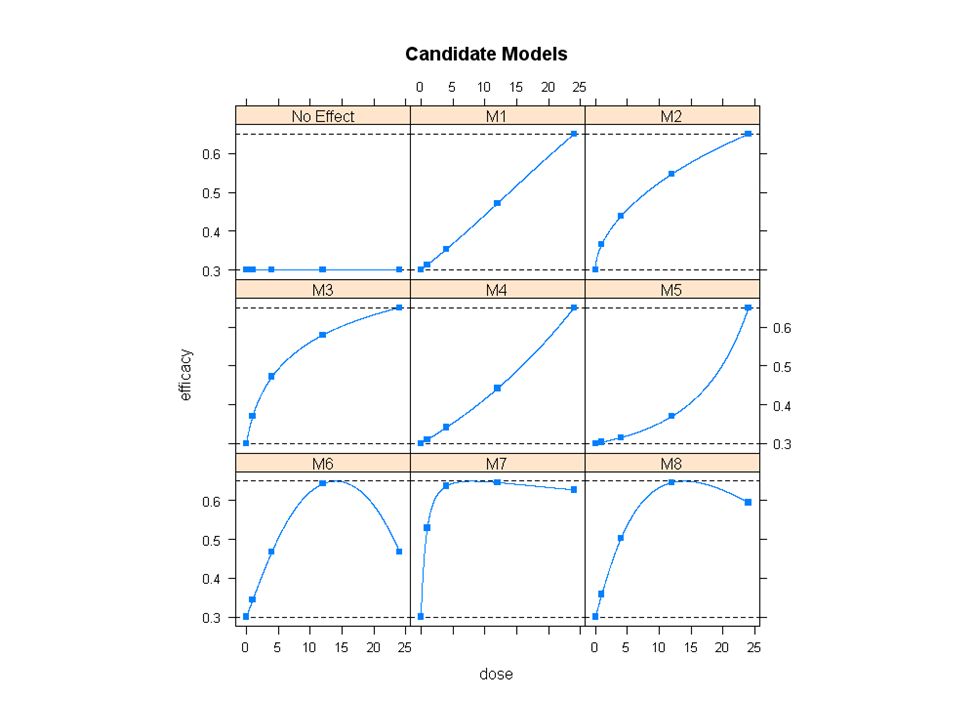
Unified Framework Goal: Combine advantages Robustness + Strong Error control + Dose estimate with margin of error Step 1: Specify candidate models Step 2: Test PoC and select “best” ones, controlling FWER Step 3: Get target dose estimate by model averaging over best models

8
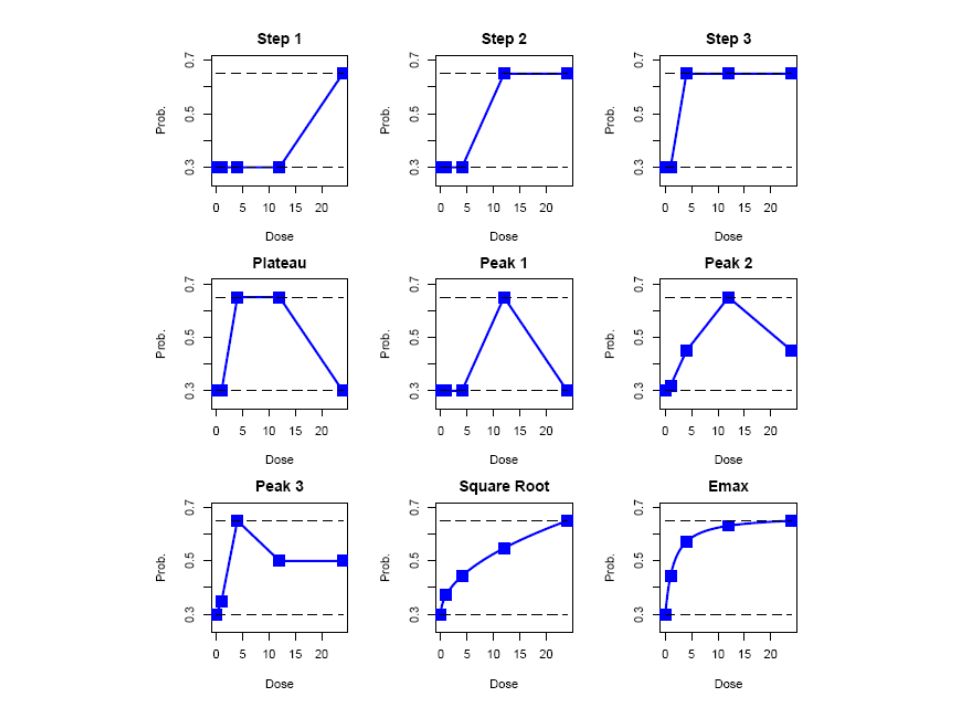
Unified Framework Step 1: Specify candidate models In consultation with clinical team Models can vary with respect to link function or nature of dose effect

10
Unified Framework Step 2: Test for PoC For each model M s, test for a (positive) dose effect via a signed penalized likelihood ratio test (difference in deviance): Common penalty term: 2(diff. in # of parms) Interested in models that “best” pick up observed dose- response signal, i.e., that deviate the most from no- effect model M 0 Establish PoC if (some critical value)
 Interested in models that best pick up observed dose- response signal, i.e., that deviate the most from no- effect model M 0 Establish PoC if (some critical value).")
11
Unified Framework Step 2: Determining c that controls FWER Under H 0 : no dose effect, doses are interchangeable To determine c, look at permutation distributionof This controls familywise error rate of declaring spurious signals as real c

12
Unified Framework Step 2: Test for PoC, IBS Example

13
Unified Framework Power Comparison: Percent of establishing Proof of Concept

15
Unified Framework Step 2: Power Comparison under model misspecification

16
Unified Framework Step 3: Target Dose Estimation Settle on model(s) that pass the PoC filter Estimate target dose via inverse regression Here: Estimation of Minimum Effective Dose (MED) MED: Smallest dose that is clinically relevant and statistically significant GI-data: MED=0.7mg [0.4; 3.9]
![Unified Framework Step 3: Target Dose Estimation Settle on model(s) that pass the PoC filter Estimate target dose via inverse regression Here: Estimation of Minimum Effective Dose (MED) MED: Smallest dose that is clinically relevant and statistically significant GI-data: MED=0.7mg [0.4; 3.9]](http://images.slideplayer.com/26/8675825/slides/slide_16.jpg "Unified Framework Step 3: Target Dose Estimation Settle on model(s) that pass the PoC filter Estimate target dose via inverse regression Here: Estimation of Minimum Effective Dose (MED) MED: Smallest dose that is clinically relevant and statistically significant GI-data: MED=0.7mg [0.4; 3.9]")
17
Unified Framework Step 3: Target Dose Estimation under model uncertainty Combine MED’s from significant models (weighted average) with existing MED’s. (Penalized) likelihood ratio btw. models M s and M s’ : Weights:
 likelihood ratio btw. models M s and M s’ : Weights:.")
18
Unified Framework Step 3: Target Dose Estimation under model uncertainty

19
Unified Framework Step 3: Target Dose Estimation: Performance

20
Summary Framework Unified Framework for PoC and dose estimation Combines elements from multiple contrast tests and modeling Step 1: Specify candidate model set Step 2: Obtain permutation distribution of maximum signed penalized deviance statistic and critical value Step 3: Obtain target dose estimate from significant model(s) via model averaging
 via model averaging")
21
Conclusion PoC Analysis Incorporates model uncertainty in PoC decision Controls Type I error in strong sense As powerful or more powerful in establishing PoC as competing contrast tests, uniformly under a variety of shapes Target Dose Estimation Incorporates model uncertainty Provides confidence bounds for target dose estimate Covariates, unbalanced sample size, unequally spaced doses

22
Extensions Framework applicable to PoC and dose estimation in more complicated categorical data sets such as: Bivariate binary responses Two primary endpoints Efficacy and safety endpoint considered jointly Repeated categorical data Contrast tests not well developed With GEE implementation: Consider generalized score statistic (Boos, 1992) instead of LR-statistic
 instead of LR-statistic")
Similar presentations

>")


: –Hypothesis Tests and Confidence Intervals for Intercept and Slope –Confidence.>")


