Download presentation
Presentation is loading. Please wait.

1
February 6, 2007 Steve Heminger Executive Director Smart Growth in the Bay Area: Carrots or Sticks Painted Orange? Carrots or Sticks Painted Orange?

2
San Francisco Bay Area counties Million people; almost 4 million jobs Public transit operators Municipalities Elected Transit Boards in US MPO and COG Joint Policy Committee A Complex Region 9 7 26 101 2 of the 3 Separate New

3
Housing Crisis Exacerbates Sprawl

4
25 yr Transportation Plan Expenditures Expansion Operations & Maintenance SF Bay AreaTop 19 Metro Areas Expansion Operations & Maintenance

5
Smart Growth Started with Flexibility Federal ISTEA law (1991) brought flexibility Federal ISTEA law (1991) brought flexibility STP - Surface Transportation Program CMAQ - Congestion Mitigation Air Quality TE - Transportation Enhancements SB45 - CA state law (1998) devolves funds to regions 75% of federal/state funds subvened to regions County-based return to source
 brought flexibility Federal ISTEA law (1991) brought flexibility STP - Surface Transportation Program CMAQ - Congestion Mitigation Air Quality TE - Transportation Enhancements SB45 - CA state law (1998) devolves funds to regions 75% of federal/state funds subvened to regions County-based return to source")
6
Evolution of Smart Growth Transportation/Land Use Policy 1996 Transp for Livable Communities (TLC) planning 1997 TLC capital 1998 Housing Incentive Program (HIP) 2000 Bay Area’s Smart Growth Vision 2002 Transportation/Land Use Platform 2004 TOD Policy for Transit Expansion 2005 FOCUS: Priority Areas for Smart Growth 2007 New 25-yr Regional Transportation Plan 2009 Jim Spering Solano County
 planning 1997 TLC capital 1998 Housing Incentive Program (HIP) 2000 Bay Area’s Smart Growth Vision 2002 Transportation/Land Use Platform 2004 TOD Policy for Transit Expansion 2005 FOCUS: Priority Areas for Smart Growth 2007 New 25-yr Regional Transportation Plan 2009 Jim Spering Solano County")
7
Funding Incentives Overview 1. TLC Planning ($3M) 67 community-led plans 2. TLC Capital ($84M) 81 capital projects - 40 cities Additional $36M subvened to 9 counties 3. Housing Incentive Program ($40M) 11,800 market rate bedrooms 4,800 affordable rate bedrooms 4. Station Area Planning ($3M) to support new TOD policy
 81 capital projects - 40 cities Additional $36M subvened to 9 counties 3. Housing Incentive Program ($40M) 11,800 market rate bedrooms 4,800 affordable rate bedrooms 4. Station Area Planning ($3M) to support new TOD policy.")
8
Evolution of Annual Funding

9
Fruitvale Transit Village Oakland Alameda County Library, health clinic, senior center, retail, 47 rental units 300+ housing units in phase 2 TLC planning: $47,000 TLC Capital Grant: $2 million TLC Project

10
Metropolitan Apartments San Mateo San Mateo County 218 housing units near bus transit and commuter rail HIP Grant: $682,500 Density: 60 units per acre HIP Project HIP grants funded pedestrian and streetscape improvements along Third and Fourth Avenues in downtown San Mateo (same project area).
.")
11
Richmond Transit Village Richmond Contra Costa County Ownership Townhouses hub of heavy rail (BART), Amtrak & local bus HIP Grant: $865,500 Density: 25 units per acre HIP Project
, Amtrak & local bus HIP Grant: $865,500 Density: 25 units per acre HIP Project")
12
Bay Area’s 2030 Smart Growth Vision 2 million more people -- 1.4 million more jobs Bay Area Vision calls for more housing on smaller urban footprint

13
Incommuting Remains Major Problem +64% +83% +90% +120% Growth in interregional commuting 2000 –2030

14
MTC’s TOD Policy: Key Transit Corridors existing rail corridors Proposed BRT Proposed rail corridors Proposed ferry terminals

15
TOD Policy - Housing Requirements Transit Technology Minimum Housing Threshold Equivalent Net Densities BART/ Heavy Rail 3850 avg per station 50-150 units/acre Light Rail 3300 avg per station 40-80 units/acre Bus Rapid Transit 2750 avg per station 30-60 units/acre Commuter Rail 2200 avg per station 20-50 units/acre Ferries 750 avg per terminal 10-30 units/acre

16
TOD Policy: Leveraging Regional Investment

17
TOD Not Just About Transit Mixed Use Critical to Capture Non-Commute Trips by Walking/Biking 29% 29%transit Mode Share of TOD Residents: 2000 Bay Area Travel Survey 24%walk/bike

18
TOD Policy Just the Beginning Percent of Bay Area’s Future Growth through 2030

19
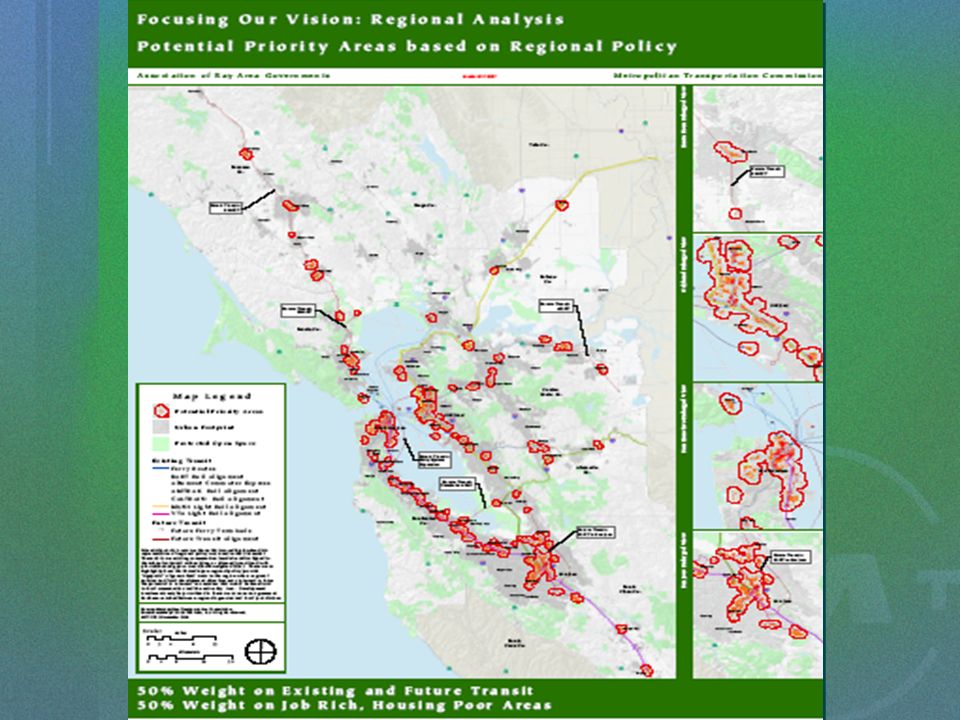
FOCUS Project: A Regional Partnership Led by sister agency - ABAG Voluntary local gov’t partners TOD + Housing near Job Centers Regional Commitment to Provide Incentives Local commitment to expedited housing approval Initial map of priority areas Oct 2007 Led by sister agency - ABAG Voluntary local gov’t partners TOD + Housing near Job Centers Regional Commitment to Provide Incentives Local commitment to expedited housing approval Initial map of priority areas Oct 2007

21
New CA State Bonds as Addt’l Incentives SourceAccountFunding(Millions) Prop 1C - HousingBond Regional Planning, Housing and Infill Incentives $850 Transit-oriented Development $300 Housing-related Parks $200 Prop 84 – ParksBond Urban Greening $90 Urban Forestry $20 Local and Regional Parks $400 Planning Grants and Loans $90 TOTAL NEW BOND FUNDING $1,950
 Prop 1C - HousingBond Regional Planning, Housing and Infill Incentives $850 Transit-oriented Development $300 Housing-related Parks $200 Prop 84 – ParksBond Urban Greening $90 Urban Forestry $20 Local and Regional Parks $400 Planning Grants and Loans $90 TOTAL NEW BOND FUNDING $1,950")
22
Growing a Bigger Carrot? 2009 Regional Transportation Plan Starting first with regional land use vision Transportation projects to support vision Financial realities for new transit expansion Addt’l incentives for priority areas – potholes, transit, rehab, others?

23
www.mtc.ca.gov Staff Contacts: James Corless Staff Contacts: James Corless Doug Johnson Valerie Knepper 510-817-5700

Similar presentations