Download presentation
Presentation is loading. Please wait.

1
Statistical description of UV climate and climatological maps Second EDUCE Meeting, Bordeaux 2001 H. Slaper and P.N. den Outer

2
UV climatology: u Retrieve and analyse large amounts of data, spectral and pyranometer data. Sets requirements on format (data format, cosine correction,….) u Construction of integrated properties: daily, monthly, annual dosesV-dat How to deal with data gaps? u Models required since UV-data exist for limited periods only Validation of models (ground-based and satellite-based) u QA/QC-tools on irradiance scale errors
 u Construction of integrated properties: daily, monthly, annual dosesV-dat How to deal with data gaps. u Models required since UV-data exist for limited periods only Validation of models (ground-based and satellite-based) u QA/QC-tools on irradiance scale errors.")
3
DATA SUPPLEMENTATION Data gaps supplemented with: RB-measurements fractional: Test: 35 days interchanged 1. randomly 2. in a row Data used: 1998, skin cancer weighted RIVM, Bilthoven, The Netherlands RB cal.: RB = spectroradiometer

4
MonthsRandom Average: UV supp /UV meas s.d. RB-supp. 1.000 0.0061.0000.002 Fractional1.000 0.0051.000 0.003

5
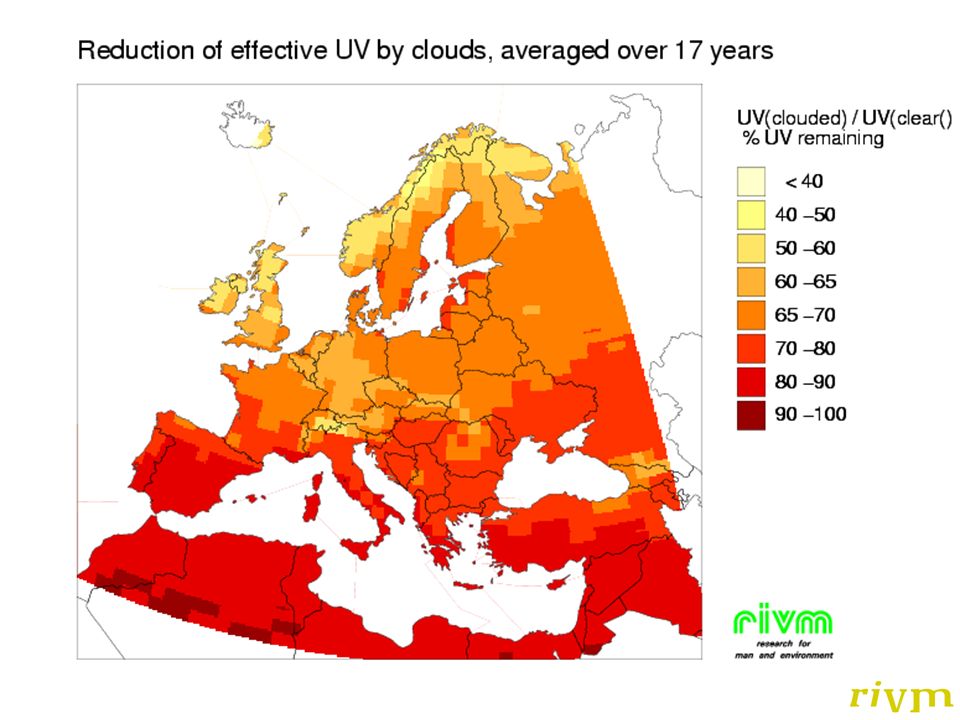
UV-transfer model UV-reduction algorithm 1. Global Solar Irradiation, pyranometers, WRDC 2. TOMS Reflection 3. ISCCP (ρ, τ CLD ) Ozone SZA Standard atmosphere Cloudless sky UV Cloudy sky UV Extra terrestrial UV
 Ozone SZA Standard atmosphere Cloudless sky UV Cloudy sky UV Extra terrestrial UV.")
6
UV v.s. Global Solar Irradiation:

7
Trends: 5±1%/decade, cloudless 6±2%/decade, cloudy sky Standard deviations in yearly sums 1.00 ± 0.01, cloudless 0.98 ± 0.03, cloudy sky Monthly doses Yearly doses

8
CORRELEATION WITH GROUND-BASED DATA ISCCP, and TOMS versus GDF Belgium + Southern Netherlands correlation

10
Cloudless sky Cloudy sky Percent change

11
Cloudless skyCloudy sky

13
UV v.s. Global Solar Irradiation:

14
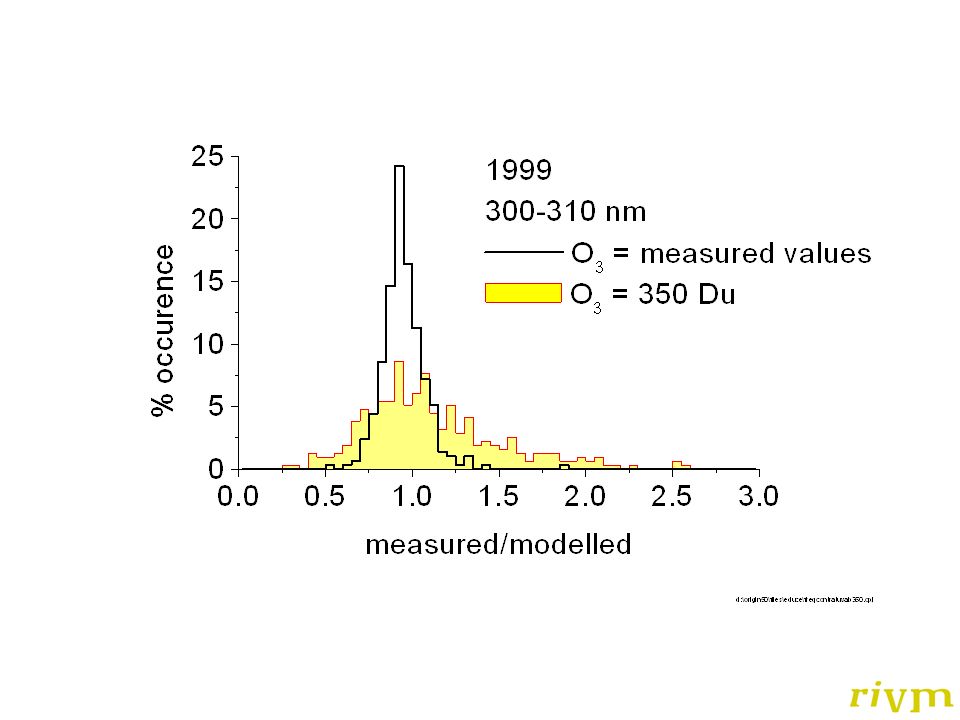
UVB 300-310 nm UVA 340-350 nm Individual measurements Dialy sums Global Irradiation UVB 300-310 nm, summer data Clear sky model Direct related SZA-dependent

15
Results QA/QC-absolute irradiance Gaussian fit95% conf.sd All UVA0.0860.103 summer UVA0.0790.103 All UVB 0.120.16 summer UVB0.1030.13 Check threshold UVA: 20% UVB:35% Thresholds apply to all weather conditions

17
Conclusions 1) data gaps can be eliminated without introducing much uncertainty: 10% loss of data adds 0.5% uncertainty 2) Use of pyranometer and ozone data is good approach to model UV. The approach yields good correlation with satellite data based models next step: validation at other locations using DB 3) Agreement of model with measurements allows for irradiance checks on the 20% level
 Agreement of model with measurements allows for irradiance checks on the 20% level.")
Similar presentations


>")
 SCIAvisie Meeting, KNMI, De Bilt, 08-02-2013 Absorbing.>")
 WP 10: Level-1 validation L.G. Tilstra 1, I. Aben 2, and P. Stammes 1 1 Royal Netherlands Meteorological Institute.>")
 satellite retrievals Zifeng Lu, David G. Streets Decision and Information Sciences.>")

Kipp & Zonen, Delft (The Netherlands) 2)JRC, Ispra.>")


>")

. A candidate for causing.>")


>")
