Download presentation
Presentation is loading. Please wait.

1
The Economic Burden of Injury in Ontario Dr. Philip Groff Director, Research & Evaluation SMARTRISK SMARTRISK Learning Series October 17, 2006

2
The Human Cost of Injury

4
Partners SMARTRISK The Hygeia Group Health Canada Emergency Health Services Branch -- Ministry of Health and Long-Term Care Kingston, Frontenac and Lennox & Addington Health Unit

5
Canada 1995 Manitoba 2004 British Columbia 2001 Atlantic Canada 2003 Alberta 2002 Saskatchewan 2001 Ontario 1999 Economic Burden Studies

6
Burden of Injury Across Canada Burden of Injury Across Canada

7
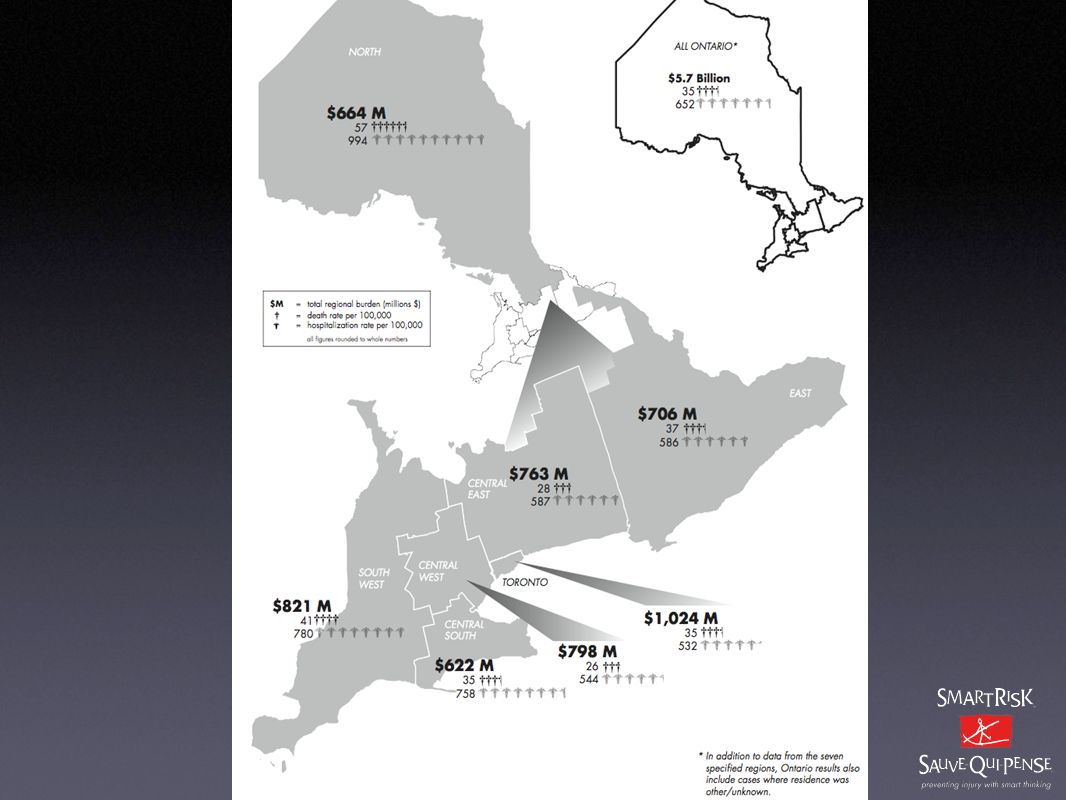
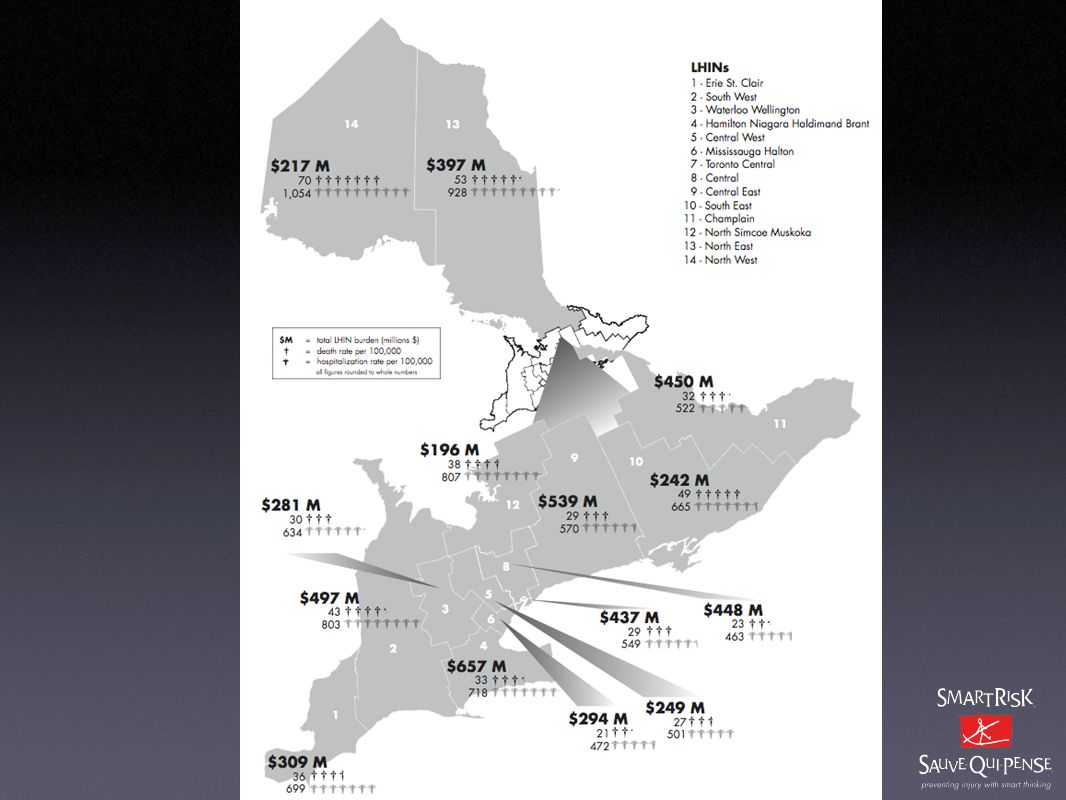
A New Ontario Study Update the numbers and methodology Include costs for intentional injury Breakdowns by Region and LHIN Focus on Alcohol Focus on Physical Activity

8
Thanks The Hygeia Group Ministry of Health & Long Term Care Ministry of Health Promotion Canadian Institute for Health Information CAMH / APOLNET SMARTRISK Staff

9
The Electronic Resource Allocation Tool (ERAT) Spreadsheet workbook in MS Excel format Allows Incidence Costing In 1999 Dollars Based upon Provincial Data / Ratios
 Spreadsheet workbook in MS Excel format Allows Incidence Costing In 1999 Dollars Based upon Provincial Data / Ratios")
10
Incidence Costing Costs of injury over the life-course charged to the year of the injury incident –Contrast with Prevalence Costing Chosen because of the focus on injury prevention Ability to evaluate cost savings from a variety of potential prevention initiatives specific scenarios in this study

11
Direct and Indirect Costs Direct Costs All costs to the health care system. Indirect Costs Lost productivity due to death and disability.

12
Causes of Injury Death Total Deaths 4,044 Total Deaths 4,044 Ontario 1999

13
Causes of Injury Hospitalization Total Hospitalized 75,176 Total Hospitalized 75,176 Ontario 1999

14
Causes of Non-Hospitalized Injury Ontario 1999 Total Non- Hospitalize d 492,438 Total Non- Hospitalize d 492,438

15
Injury Deaths Hospitalize d Injuries Non- hospitalize d Injuries Injuries Resulting in Partial Permanent Disability Injuries Resulting in Total Permanent Disability Total Annual Cost 4,04475,176 492,43 8 20,6931,426 $5.7 Billion Summary of All Injury Ontario, 1999

16
Direct and Indirect Costs Ontario, 1999

17
Costs of Unintentional Falls Ontario, 1999

18
Costs of Motor Vehicle Traffic Collision Ontario, 1999

19
Costs of Intentional Injuries Ontario, 1999

22
Injury Deaths Hospitalize d Injuries Non- hospitalize d Injuries Injuries Resulting in Partial Permanent Disability Injuries Resulting in Total Permanent Disability Total Annual Cost 1926,99953,4342,134157 $655 Million Injuries Resulting from Physical Activity Ontario, 1999

23
Costs of Injuries Resulting from Physical Activity Ontario, 1999

24
Type of Injury% Deaths % Hospitalized Injuries % Non- hospitalized Injuries Motor Vehicle Traffic Collisions 231310 Unintentional Falls 766 Suicide and Self-Inflicted Injury 1412 Interpersonal Violence 2522 Estimated Cases of Injury with Alcohol Involvement Ontario, 1999

25
Costs of Injuries Associated with Alcohol Ontario, 1999

26
$1 spent on…Saves painting traffic lines on roads$61 front seat belts$49 functional family therapy for juvenile delinquents $32 smoke detectors$15 comprehensive fall prevention programs for community-dwelling, high risk seniors $ 7 Big Brother/Sister mentoring for violence prevention $ 5 intensive sobriety checkpoints$ 3 Injury Prevention Cuts Costs

27
Five Prevention Scenarios 20% reduction in falls among 55+ 20% reduction in falls among children <15 30% reduction in MVC 20% reduction in self-inflicted poisoning 20% reduction in interpersonal violence Total combined savings of $500 Million annually

28
One Prevention Scenario: Falls Among Seniors 55+ In 1999 $927 million attributed to direct costs of falls among those 55+ The proportion of Ontarians ages 65+ will nearly double by 2031, rising to 24% Existing strategies have been demonstrated to reduce falls among seniors by 20% 4,000 fewer hospital stays 1,000 fewer seniors disabled $121 million reduction in direct health care costs

29
Conclusion Ontarians bear a heavy burden This burden is not static, there is a cost to inaction Proven approaches to prevention exist Ontario needs to tackle the burden of injury in a strategic way

30
www.smartrisk.ca

Similar presentations


 An Economic Tsunami – The cost of diabetes in Canada Presentation to the First Canadian Summit on Metabolic Surgery.>")


