Download presentation
Presentation is loading. Please wait.

1
A Research Update Mechel S. Paggi,Fumiko Yamazaki and Sean Hurley * 52nd Annual Conference of the October 15-19, 2011 Portland, Oregon * Director & Senior Research Economist respectively, Center for Agricultural Business, California State University, Fresno, Jordan College of Agricultural Sciences and Technology; Associate Professor, Department of Agricultural Business, Cal Poly, San Luis Obispo. “The Contribution of Food Distribution to Greenhouse Gas Emissions: A Case Study of the Transportation of Fresh Produce,”

3
Importance of California Produce Means of Transportation and Destinations Some Issues with the Current System Why Look at CO 2 Examples from the Study Summary and Implications

4
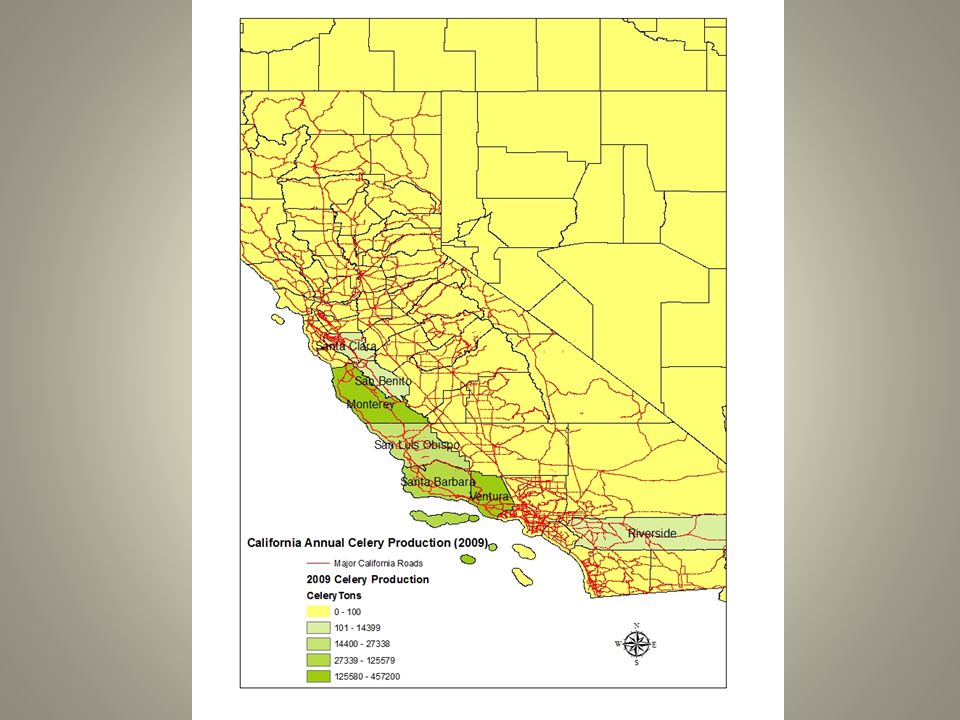
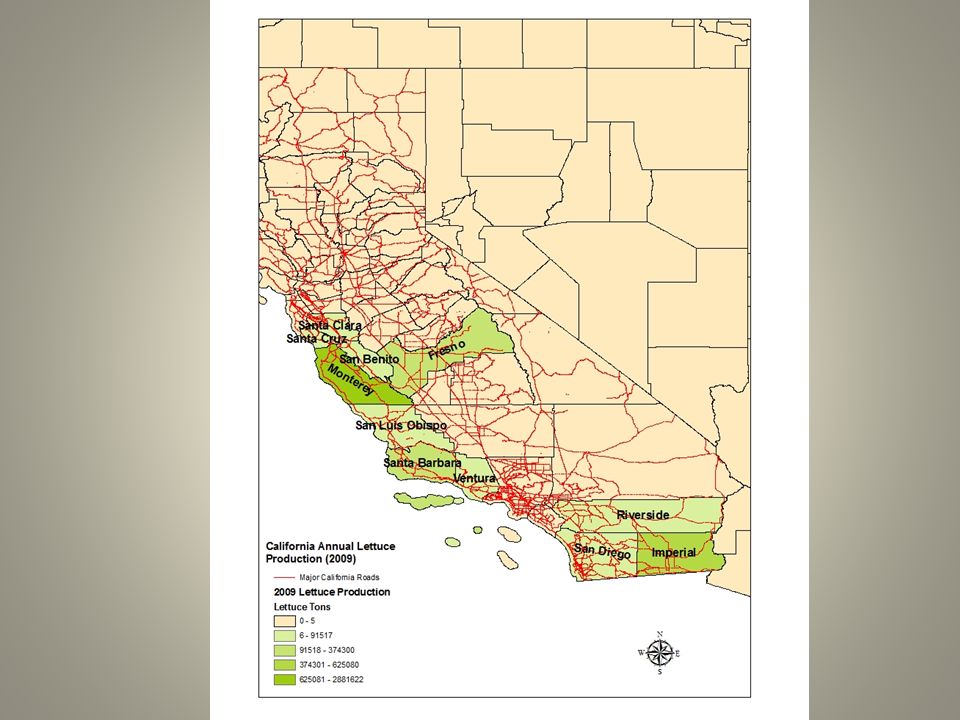
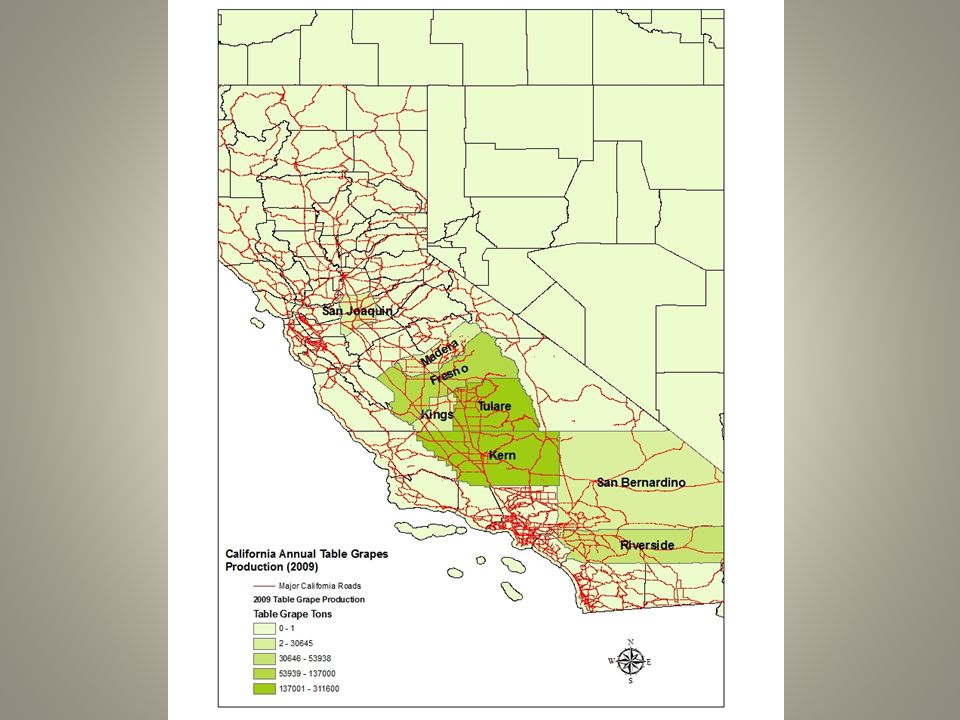
California: Supplier of Domestic Fruits and Vegetables 98% of U.S. Table Grape Production 70% of U.S. Head Lettuce; 85% of Leaf Lettuce; 74% of Romaine 86% of U.S fresh strawberries 88 % of U.S. Broccoli 94% of U.S. Celery Etc. UC-Davis, AIC, The Measure of California Agriculture, August, 2009

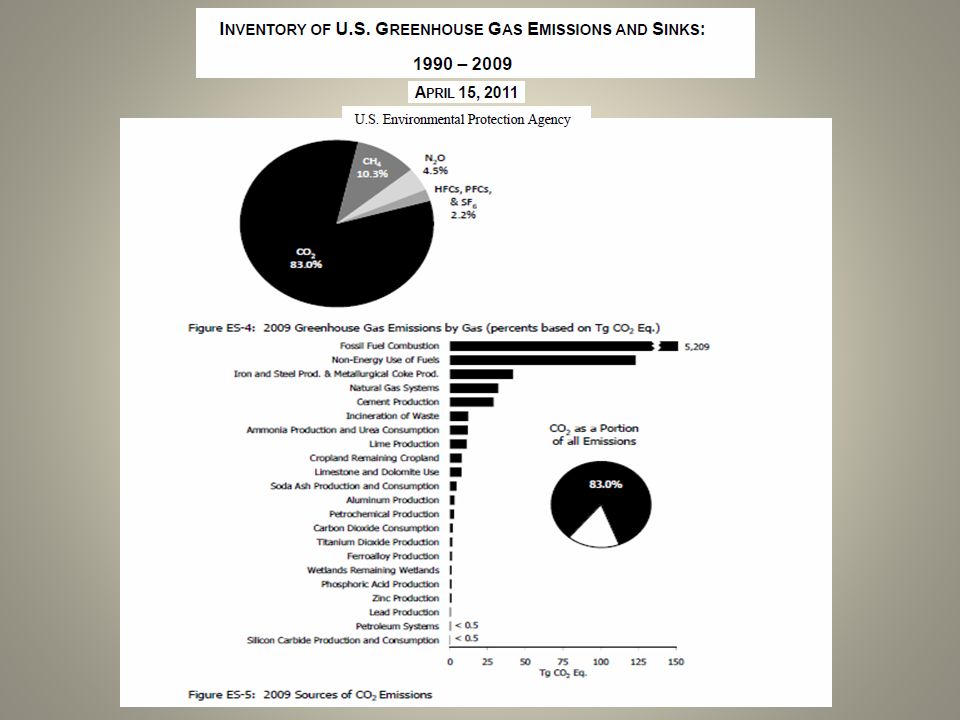
5
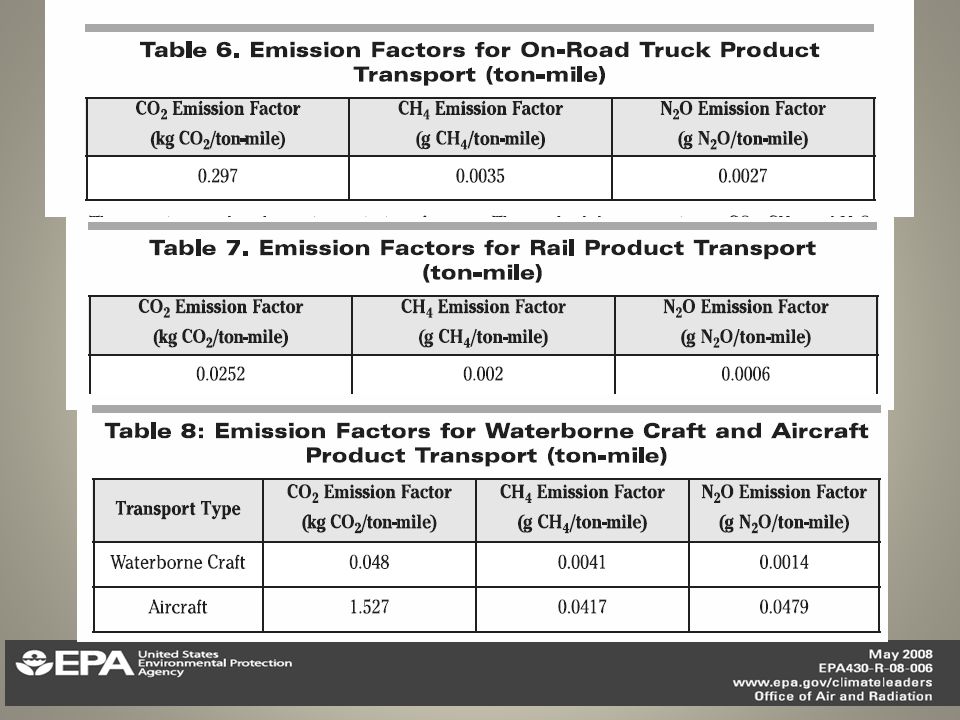
Preferred Conveyance to Minimize Emissions 297 25.2

7
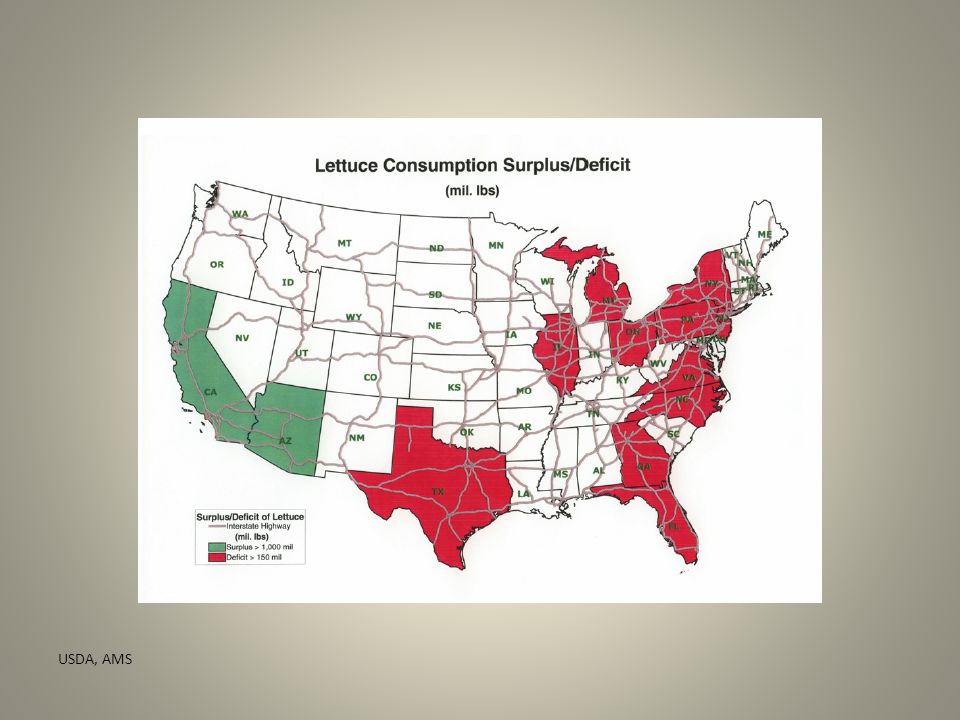
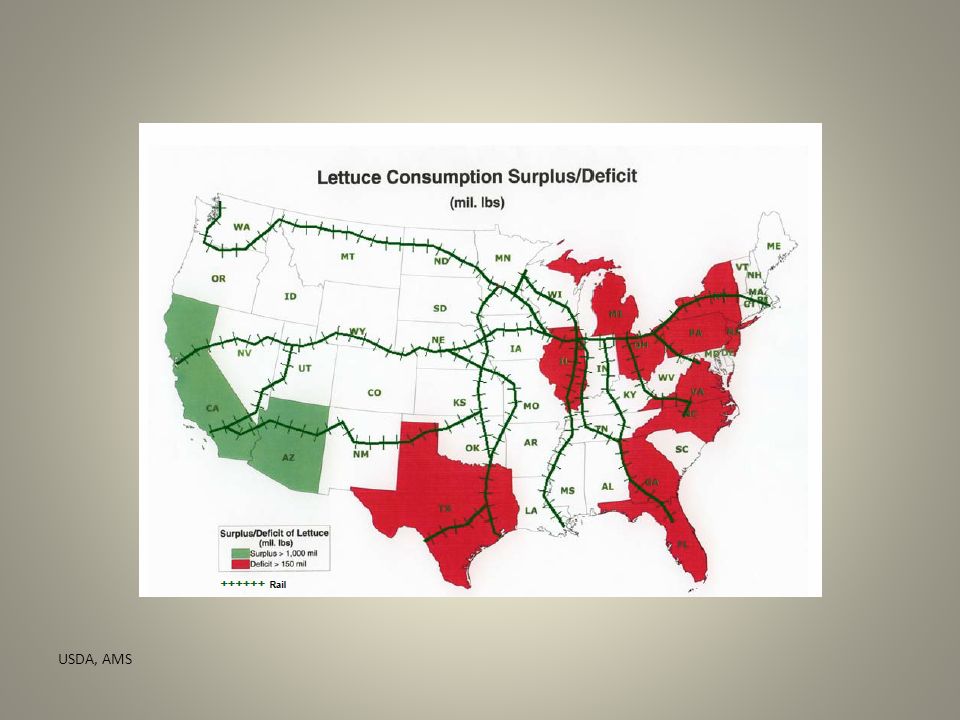
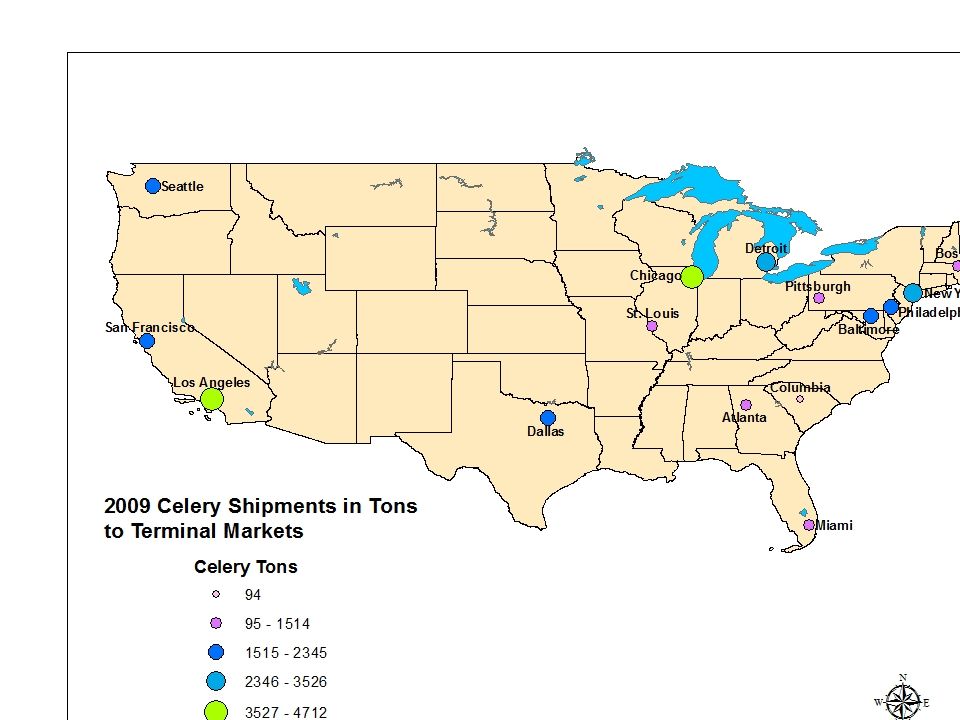
Atlanta GA Baltimore MD Boston MA Chicago IL Columbus OH Dallas TX Detroit MI Los Angeles CA Miami FL New York NY Philadelphia PA Pittsburg PA San Francisco CA Seattle WA St. Louis MO For Produce: Trucks Haul About 90% Of All Refrigerated Perishables With 15 Key Domestic Destinations USDA, AMS

11
The Heart of the Matter

14
Food Climate Research Network Transportation Only Part of the Issue

15
“Transportation as a whole represents only 11% of Life-cycle GHG emissions, and final delivery from Producer to retail contributes only 4%. “

16
Over the Road Miles Only Part of the Transport Story

19
Modal Share Celery

21
Mileage Chart Ship From: Fresno CASalinas CASanta Maria CAEl Centro CAOxnard CA Rancho Palos Verdes CAYuma AZAverage Ship To: Atlanta GA 23012397230520322230220219732205.71429 Baltimore MD 28262923283026152755272725562747.42857 Boston MA 31123197311629413042301328823043.28571 Chicago IL 21442229214820452074204519862095.85714 Columbus OH 23772473238021662306227821072298.14286 Dallas TX 15571654156112501486145911911451.14286 Detroit MI 24092494241322752338231022162350.71429 Los Angeles CA 2193031702126131269180.714286 Miami FL 28702966290625482797275724892761.85714 New York NY 29123004291527012841281326422832.5714 Philadelphia PA 28452972284926342774274625752770.71429 Pittsburg PA 25612674256423502490246222912484.57143 San Francisco CA 192106264591388404648370.428571 Seattle WA 928895105313471144116014031132.85714 St. Louis MO 19562052195917441884185616861876.71429 Average Distances From Shipment Points 15 City Destinations Derived from USDA. Fresh Fruit and Vegetable Arrival Totals for 20 Cities, last published in 1998. Washington, D.C., Agricultural Marketing Service, FVAS-3; Smaller volume cities added to nearest major volume destinations;

22
Emissions Per Truck Load: Average Mileage from Shipping PointsMPG Quantity of Fuel (Total Gallons) Carbon CoefficientFraction CombustedKg/gal Emissions per Truck Load (MT CO2) Atlanta GA 2205.71435.8380.295510.0472499%3782.73.7827 Baltimore MD 2747.42865.8473.694610.0472499%4711.74.7117 Boston MA 3043.28575.8524.704410.0472499%5219.15.2191 Chicago IL 2095.85715.8361.354710.0472499%3594.33.5943 Columbus OH 2298.14295.8396.231510.0472499%3941.23.9412 Dallas TX 1451.14295.8250.197110.0472499%2488.72.4887 Detroit MI 2350.71435.8405.295610.0472499%4031.44.0314 Los Angeles CA 180.714295.831.157610.0472499%309.90.3099 Miami FL 2761.85715.8476.182310.0472499%4736.54.7365 New York NY 2832.57145.8488.374410.0472499%4857.74.8577 Philadelphia PA 2770.71435.8477.709410.0472499%4751.74.7517 Pittsburg PA 2484.57145.8428.374410.0472499%4260.94.2609 San Francisco CA 370.428575.863.86710.0472499%635.30.6353 Seattle WA 1132.85715.8195.320210.0472499%1942.81.9428 St. Louis MO 1876.71435.8323.571410.0472499%3218.53.2185 Emissions per Truck Load=(Quantity of Fuel x Carbon Coefficient x Fraction Combusted)/1000 Industry Sources For Rail Transport: Ton-Miles=(Arrival x Avg Weight of Shipment (lbs) x Avg Shipping Distance (mi))/2204(lbs) Total Yearly Emissions (in MT CO₂)=(Ton-Miles x (0.055 lbs CO₂ per Ton-Mile) www.carbonfund.org
/1000 Industry Sources For Rail Transport: Ton-Miles=(Arrival x Avg Weight of Shipment (lbs) x Avg Shipping Distance (mi))/2204(lbs) Total Yearly Emissions (in MT CO₂)=(Ton-Miles x (0.055 lbs CO₂ per Ton-Mile)")
23
CELERY-TRUCK Arrivals Emissions Per Truck Load (MT CO₂) Total Yearly Emissions (MT CO₂) Atlanta GA14593.78275519 Baltimore MD24674.711711624 Boston MA14155.21917385 Chicago IL49333.594317731 Columbus OH1043.9412410 Dallas TX24232.48876030 Detroit MI40204.031416206 Los Angeles CA54810.30991699 Miami FL11814.73655594 New York NY37884.857718401 Philadelphia PA16684.75177926 Pittsburg PA15634.26096660 San Francisco CA26060.63531656 Seattle WA18761.94283645 St. Louis MO12833.21854129 Total:36,267114,613 USDA/AMS Daily Movement Reports,;48-53 foot refrigerated trailers, 40,000 lb. shipment units;

24
CELERY-RAILAdjusted Arrival Avg Weight of Shipment (lbs.) Avg Shipping Distance (miles) MT-Miles Train Shipping Emissions Factor (lbs CO₂ per MT- Mile) Total Yearly Emission MT CO₂ Atlanta GA-40,000 2205.7143-0.0252- Baltimore MD2940,000 2747.42861,446,0150.025236 Boston MA17940,000 3043.28579,886,5360.0252249 Chicago IL30240,000 2095.857111,487,2750.0252289 Columbus OH-40,000 2298.1429 0.0252 Dallas TX-40,000 1451.1429 0.0252 Detroit MI-40,000 2350.7143 0.0252 Los Angeles CA-40,000 180.71429 0.0252 Miami FL-40,000 2761.8571 0.0252 New York NY36040,000 2832.571418,506,8190.0252466 Philadelphia PA15740,000 2770.71437,894,7760.0252199 Pittsburg PA-40,000 2484.5714 0.0252 San Francisco CA-40,000 370.42857 0.0252 Seattle WA-40,000 1132.8571 0.0252 St. Louis MO-40,000 1876.7143 0.0252 Total: 1,02740,00049,221,4200.02521240 Ton-Miles=( Arrivals x Avg Weight of Shipment (lbs) x Avg Shipping Distance (mi))/2204.6 (lbs) Total Yearly Emissions (in MT CO₂)=(Ton-Miles x (0.0252 kg CO₂ per Ton-Mile))/1000 Source: EPA430-R-08-006
 x Avg Shipping Distance (mi))/ (lbs) Total Yearly Emissions (in MT CO₂)=(Ton-Miles x ( kg CO₂ per Ton-Mile))/1000 Source: EPA430-R")
27
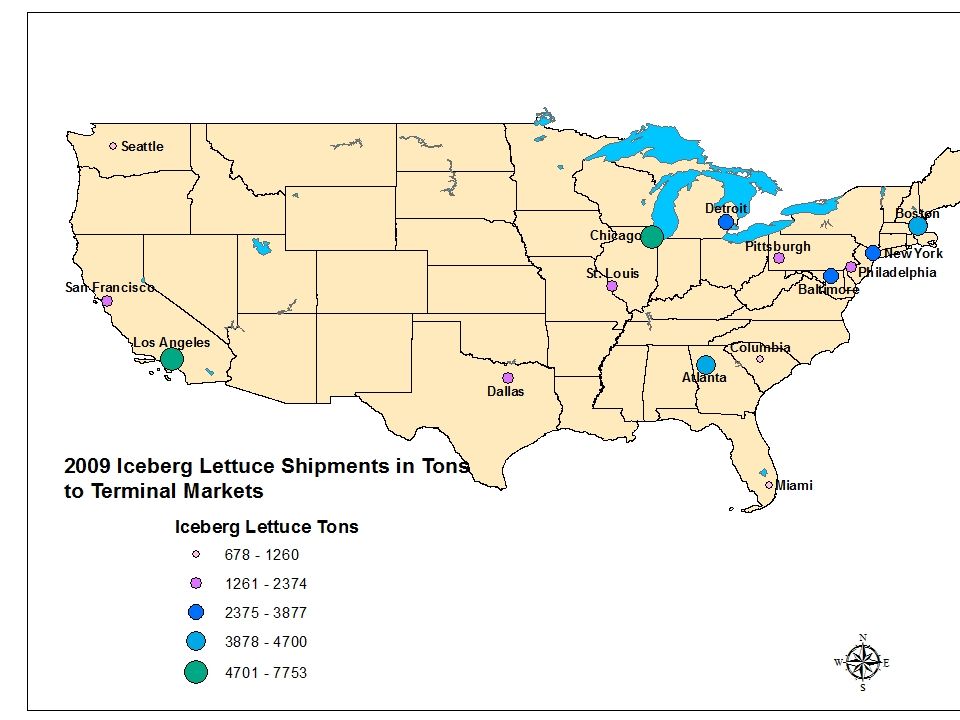
Modal Share Iceberg Lettuce

28
LETTUCE, ICEBERG-TRUCK Arrivals Emissions Per Truck Load (MT CO₂) Total Yearly Emissions (MT CO₂) Atlanta GA52223.782719753 Baltimore MD43074.711720293 Boston MA47435.219124754 Chicago IL74833.594326896 Columbus OH7533.94122968 Dallas TX28462.48877083 Detroit MI47764.031419254 Los Angeles CA91210.30992827 Miami FL13464.73656375 New York NY43894.857721320 Philadelphia PA21534.751710230 Pittsburg PA23164.26099868 San Francisco CA26380.63531676 Seattle WA14001.94282720 St. Louis MO20923.21856733

29
LETTUCE, ICEBERG-RAILAdjusted Arrival Avg Weight of Shipment (lbs) Avg Shipping Distance (mi) Ton-Miles Train Shipping Emissions Factor (lbs CO₂ per Ton- Mile) Total Yearly Emission (in MT CO₂) Atlanta GA-40,000 2205.7143-0.0252- Baltimore MD140,000 2747.428649,8630.02521 Boston MA440,000 3043.2857220,9280.02526 Chicago IL840,000 2095.8571304,2990.02528 Columbus OH-40,000 2298.1429-0.0252- Dallas TX-40,000 1451.1429-0.0252- Detroit MI-40,000 2350.7143-0.0252- Los Angeles CA-40,000 180.71429-0.0252- Miami FL-40,000 2761.8571-0.0252- New York NY840,000 2832.5714411,2630.025210 Philadelphia PA340,000 2770.7143150,8560.02524 Pittsburg PA-40,000 2484.5714-0.0252- San Francisco CA-40,000 370.42857-0.0252- Seattle WA-40,000 1132.8571-0.0252- St. Louis MO-40,000 1876.7143-0.0252- Total: 24 1,137,207.66 28.66

32
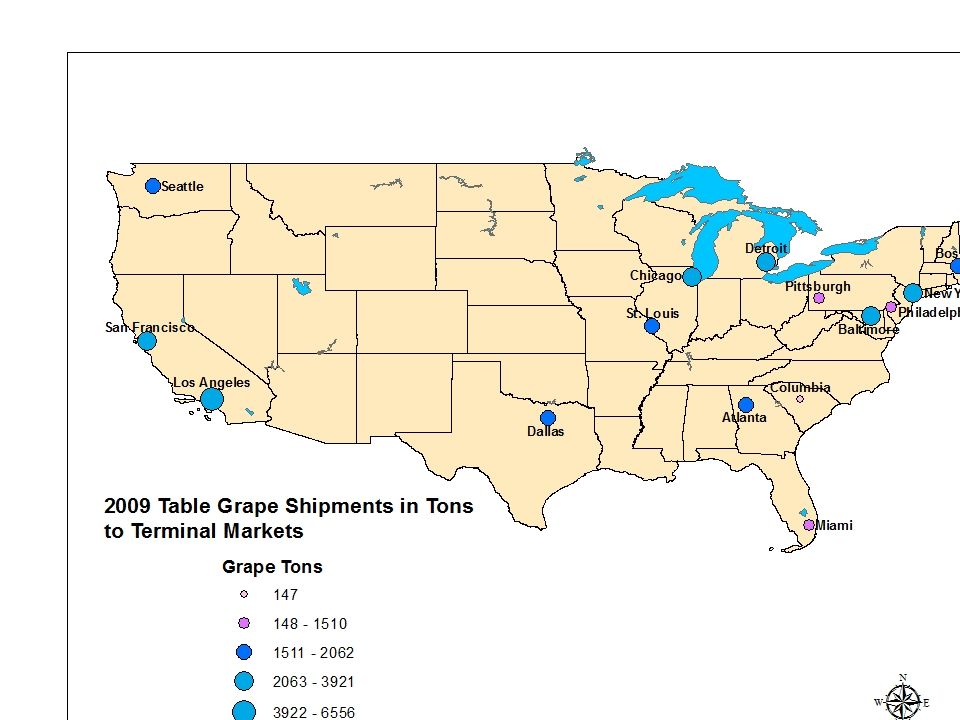
Modal Share Table Grapes

33
GRAPES, TABLE-TRUCKAdjusted Arrival Emissions Per Truck Load (MT CO₂) Total Yearly Emissions (MT CO₂) Atlanta GA22103.78278360 Baltimore MD36424.711717160 Boston MA20165.219110522 Chicago IL41333.594314855 Columbus OH1633.9412642 Dallas TX25782.48876416 Detroit MI41044.031416545 Los Angeles CA77130.30992390 Miami FL11464.73655428 New York NY35534.857717259 Philadelphia PA15964.75177584 Pittsburg PA12284.26095232 San Francisco CA43380.63532756 Seattle WA22101.94284294 St. Louis MO19003.21856115 Total:42,53052.48125,558

34
GRAPES, TABLE-RAILArrivals Avg Weight of Shipment (lbs) Avg Shipping Distance (mi) MT-Miles Train Shipping Emissions Factor (lbs CO₂ per Ton- Mile) Total Yearly Emission (in MT CO₂) Atlanta GA-40,000 2205.7143-0.0252- Baltimore MD-40,000 2747.4286-0.0252- Boston MA8740,000 3043.28574,805,1880.0252121 Chicago IL22340,000 2095.85718,482,3250.0252214 Columbus OH-40,000 2298.1429-0.0252- Dallas TX-40,000 1451.1429-0.0252- Detroit MI-40,000 2350.7143-0.0252- Los Angeles CA-40,000 180.71429-0.0252- Miami FL-40,000 2761.8571-0.0252- New York NY19240,000 2832.57149,870,3030.0252249 Philadelphia PA8240,000 2770.71434,123,3860.0252104 Pittsburg PA-40,000 2484.5714-0.0252- San Francisco CA-40,000 370.42857-0.0252- Seattle WA-40,000 1132.8571-0.0252- St. Louis MO-40,000 1876.7143-0.0252- Total:584 27,281,203 687

35
Cost of C0 2 Emissions California Fresh Produce Transport California to Boston Rail = 1.4 metric tons ; Truck = 5.2191 metric tons; UK plans a carbon floor price of $25.09 per metric ton from April 2013*; Australia initiaitive to start at A$23; ($22 US); Current estimates in CA $11 per metric ton for initial credit value; Origin-Destination Truck Rates for Selected Routes and Commodities, 2nd Quarter 2011 California to Boston, Lettuce, $7,710 ** About 1000 cartons per load (60 lbs. per); By Truck --- @$23.5/MT about 12 ¢ per carton / 0.2 ¢ lb. * Reuters Oct 3, 2011, 03.51pm IST ; ** USDA/AMS Ag Refrigerated Truck Quaterly, April – June, 2011.
; By Truck about 12 ¢ per carton / 0.2 ¢ lb. * Reuters Oct 3, 2011, 03.51pm IST ; ** USDA/AMS Ag Refrigerated Truck Quaterly, April – June,")
36
Summary & Implications Observations Market Demand for Variety Creates Need for Transport (Local may be desirable, but not practical for certain products) Dominance of Truck Mode Imposes a Definable Transportation Carbon Footprint Alternative Transport Scenarios Difficult if not Impossible in Foreseeable Future; Internalize Existing Costs at current value for carbon low per unit; Who Pays The Costs? Needs Better data on shipment numbers/destinations by mode. Leads to Better data & accountability to quantify the costs Development of Efficiency Options for the Existing System

37
Green House Gas Solutions Require Global Action

Similar presentations


 has released a compliance guide to help employers understand ERISA's requirements regarding qualified medical child support.>")


