Download presentation
Presentation is loading. Please wait.

1
Weather Patterns & Severe Storms
Chapter 20

2
Air Masses Section 20.1

3
Air Masses & Weather Air mass is immense body of air that is characterized by similar temp & amount of any given altitude Can be 1600km or more across & several km thick May take days to move over an area Movement of air masses As it moves out of area, carries conditions w/it Characteristics of air mass changes & so does weather in area over which it moves

4
Classifying Air Masses
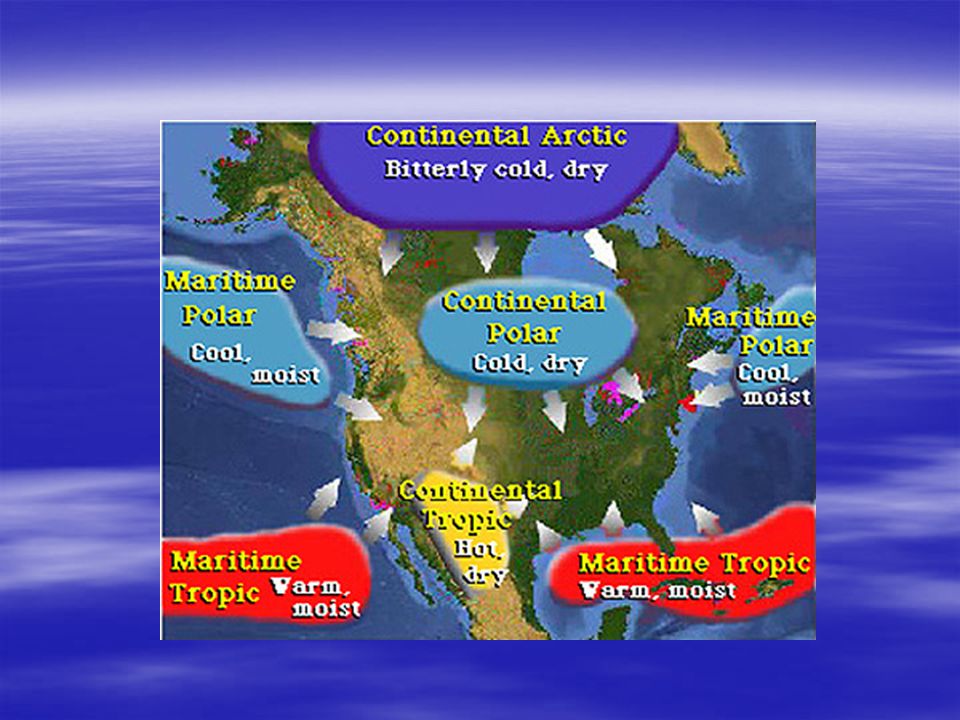
Gets it characteristic properties of temp & moisture from source region (area over which it forms) Named according to their source regions Polar (P) air mass – high latitudes near poles – COLD Tropical (T) air mass – low latitudes – WARM Classified by surface over which they form Continental (c) air mass – over land – DRY Maritime (m) air mass – over water – HUMID
 Named according to their source regions. Polar (P) air mass – high latitudes near poles – COLD. Tropical (T) air mass – low latitudes – WARM. Classified by surface over which they form. Continental (c) air mass – over land – DRY. Maritime (m) air mass – over water – HUMID.")
5
4 basic types 1. Continental polar (cP) – dry & cool 2. Continental tropical (cT) – dry & warm/hot 3. Maritime polar (mP) – humid & cool 4. Maritime tropical (mT) – humid & warm/hot
 – humid & cool. 4. Maritime tropical (mT) – humid & warm/hot.")
7
Weather in N.A. East of Rocky mtns influenced by cP (Alaska & Canada) & mT (Gulf of Mexico) Continental Polar Air Masses Cold & dry winter; cool & dry summer Not assoc w/heavy precip. Cause lake effect snows when passing over Great Lakes Air gets heated & moistened by water Drops off heat & moisture when it hits land again

8
Maritime Tropical Air Masses
Warm, inc. moisture, unstable Source of most precip. in U.S. High heat & humidity in summer Maritime Polar Air Masses Mild, humid, unstable Low clouds & shower before it hits mtns Heavy rain/snow on windward slopes of mtns Nor’easter – when New England is on N or NW side of passing low-pressure center, causes counterclockwise rotation of mP air Continental Tropical Air Masses Least influence on weather Occasionally affect weather outside of source region Indian summer in fall

9
Fronts Section 20.2

10
Formation of Fronts Front is boundary btwn 2 air masses
Formed when 2 air masses meet Often assoc w/precip. Narrow – km wide One air mass advances into another causing some mixing of air

11
Types of Fronts Warm fronts Cold Front
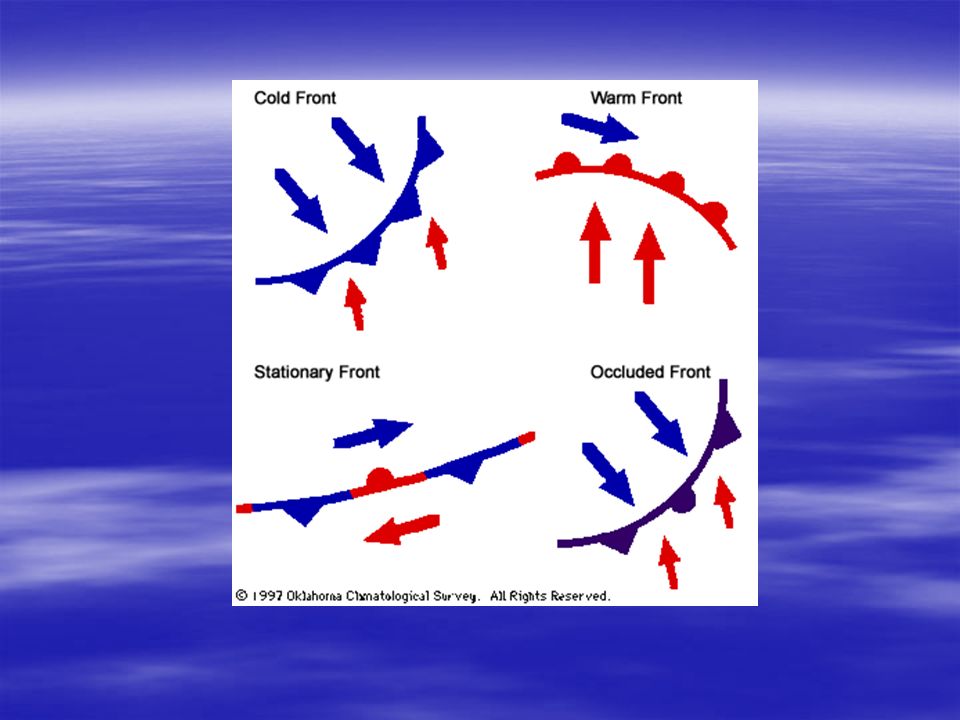
Red line w/semicircles pointing in direction of wind Warm air moves into area formerly covered by cooler air Produce light-to-moderate precip Wind shifts from E to SW Cold Front Blue line w/triangles pointing toward warm air Cold, dense air moves into region occupied by warmer air More violent weather Weather soon calms after it passes

12
Stationary Front Occluded Front
Blue triangles on 1 side; red semicircles on other Flow of air on either side of front isn’t toward either cold or warm air masses Sometimes gentle-to-moderate precip Occluded Front Active cold front overtakes slower moving warm front Complex weather patterns

14
Mid-Latitude Cyclones
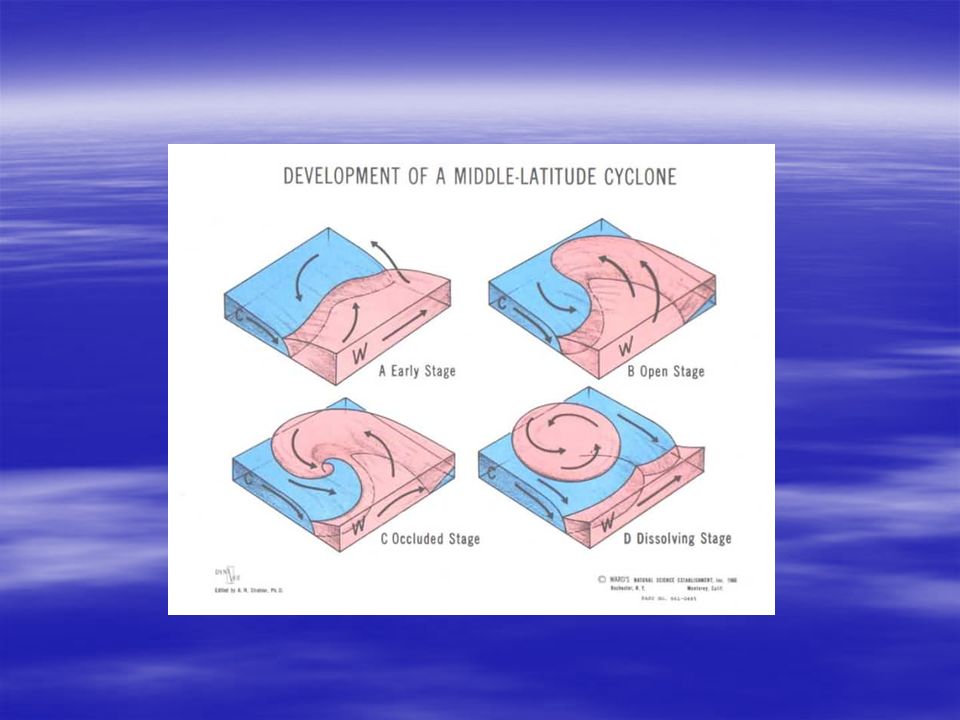
Large centers of low pressure that generally travel from WE and cause stormy weather Air moves counterclockwise & in toward the low pressure area Most have cold front extending from central area; frequently have warm fronts too Formation 2 air masses w/diff temp move in opposite directions Front creates wave shape Warm air moves towards poles; cold air moves toward equator Cold front lifts warm front (occlusion) causing storm to get stronger Destruction As more warm air is uplifted, pressure change lessens Entire amount of warm air is displaced Horizontal temp diff disappears Nrg source is gone
 causing storm to get stronger. Destruction. As more warm air is uplifted, pressure change lessens. Entire amount of warm air is displaced. Horizontal temp diff disappears. Nrg source is gone.")
16
Role of Airflow Aloft Maintains cyclonic & anticyclonic circulation
Cyclones generally last for a week or longer Air in upper atmosphere fuels middle-lat cyclone Cyclones bring stormy weather Anticyclones are found next to cyclone; air moves clockwise

18
Severe Storms Section 20.3

19
Thunderstorms (T-Storm)
Storm that generates lightning & thunder Frequently produce gusty winds, heavy rain, & hail May be produced by single cumulonimbus cloud; affect small area May be assoc w/clusters of cumulonimbus clouds; affect larger area Occurrence of t-storms @ any given time, storms on earth Higher # in tropics where warm, moist air & instability are common 45,000 t-storm per day; 16 mill annually Most frequent in FL & east Gulf Coast Least frequent in western margin of U.S.

20
Development of t-storms
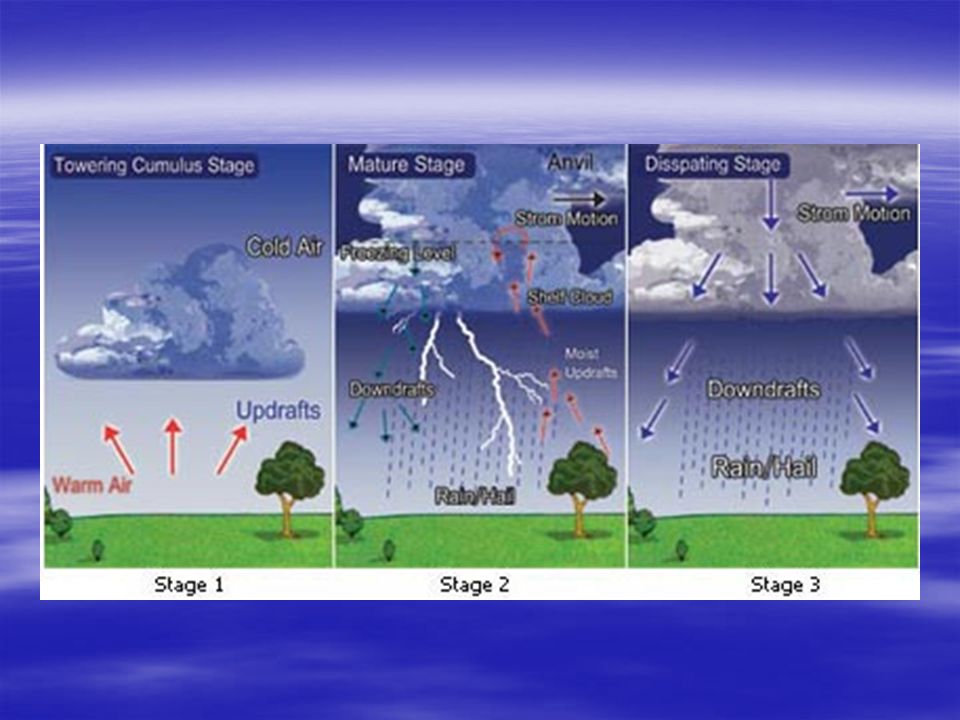
Arise when warm, humid air rises in an unstable environment 3 stages 1. Cumulus stage – updrafts supply warm, moist air to cloud 2. Mature stage – heavy precip, most active 3. Dissipating stage – downdrafts dominate, causing storm to die down Life span = 1-2 hrs Fresh supplies of warm, humid air generate new cells to replace dying ones

22
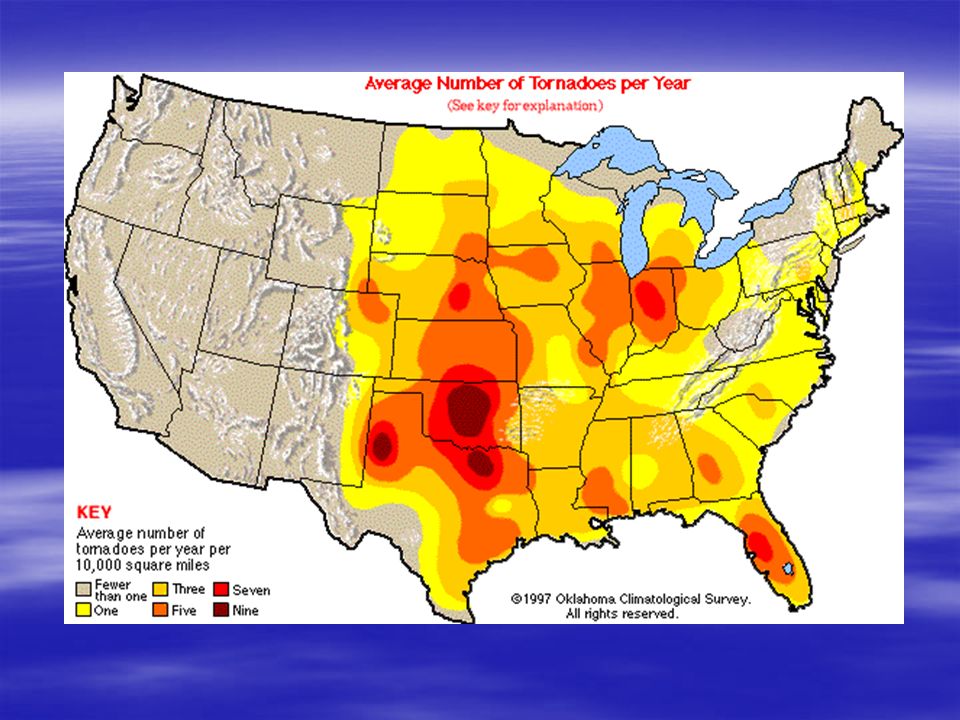
Tornadoes Violent windstorms that take the form of a rotating column of air called a vortex which extends down from cumulonimbus cloud May consist of single or multiple vortices w/in a funnel Occurrence & development of tornadoes 770 reported annually in US Most frequent Apr-June Most form in assoc w/severe t-storm Most impt part in development is formation of mesocyclone Mesocyclone is vertical cylinder of rotating air located in updraft of t-storm Formation of vortex begins as winds in higher atmos cause lower atmos to roll Rolling air tilts to vertical forming mesocyclone Mesocyclone formation does NOT mean tornado will develop

25
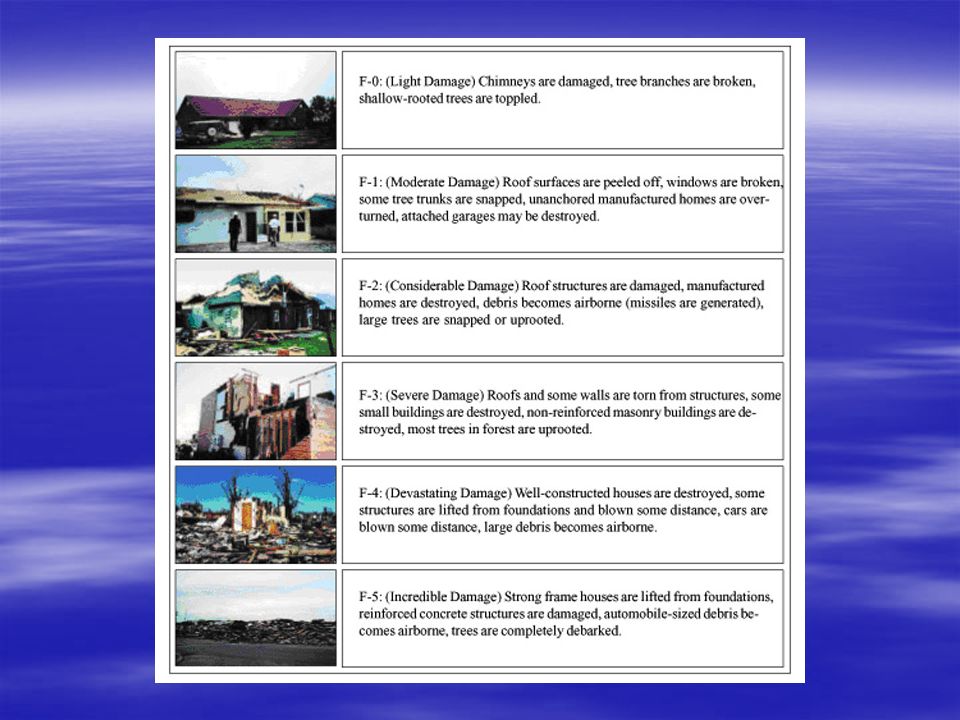
Tornado Intensity Atmos pressure is lower w/in storm which causes air to rush into the storm from all directions Air eventually merges w/cloud Max winds can approach 480 km Intensity measured on Fujita tornado intensity scale Developed by assessing damage – NOT speed

27
Tornado Safety Storm Prediction Center (SPC) in Norman OK monitors severe weather Watch – conditions are right for formation Warning – tornado spotted by person or radar

28
Hurricanes Tropical cyclones that produce winds least 119km/hr are known in U.S. as hurricanes Known in other parts of the world as: typhoon, cyclone, tropical cyclone Most powerful storms on earth 15m high waves Strong winds Flooding

29
Growing threat b/c most people live near coast
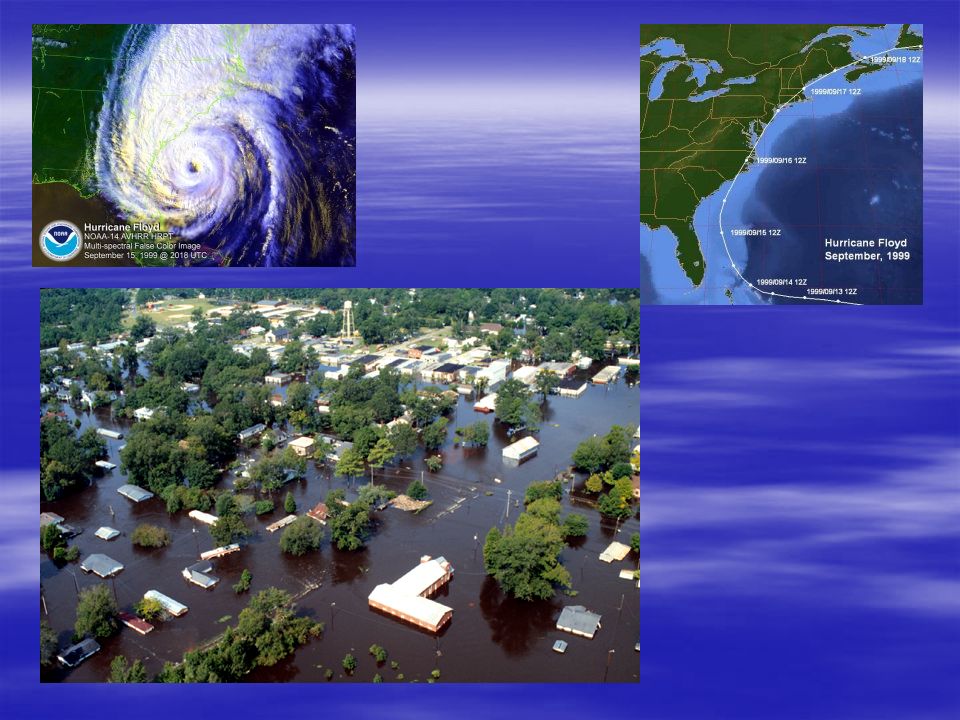
Hurricane Floyd Sept 1999 Deadliest since Hurricane Agnes in 1972 (* H. Katrina surpassed) 2.5 mill people were evacuated Most deaths were due to drowning in floods Growing threat b/c most people live near coast 50% of U.S. population is 75km from coast
 2.5 mill people were evacuated. Most deaths were due to drowning in floods. Growing threat b/c most people live near coast. 50% of U.S. population is 75km from coast.")
31
Occurrence of hurricanes
Form btwn 5o -20o N & S latitude N. Pacific (most active) 20 per year U.S. fewer than 5, on average Many tropical disturbances do not make it to hurricane level
 20 per year. U.S. fewer than 5, on average. Many tropical disturbances do not make it to hurricane level.")
32
Development of hurricanes
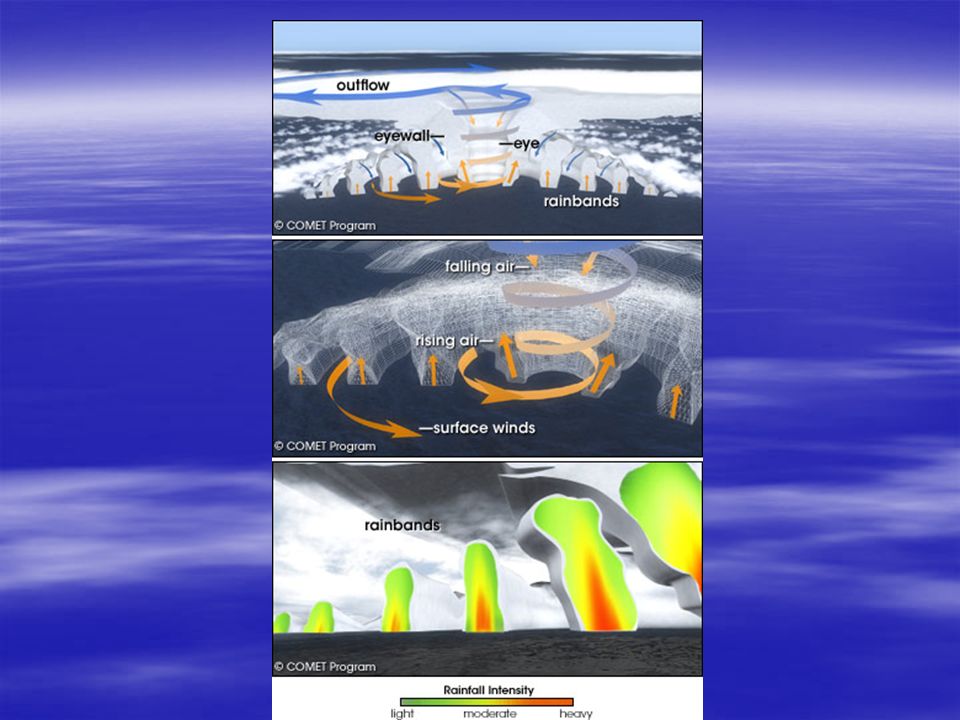
Late summer when water temps are warm enough to provide necessary heat & moisture to the air Begins as tropical disturbance – unorganized group of clouds & t-storms Only a few t.d. become hurricanes Parts of a hurricane Eye wall – donut-shaped wall in center of storm; highest wind speed & heaviest rainfall Eye – very center of storm; no precip & wind subsides; warmest part of storm

34
Hurricane intensity Saffir-Simpson Hurricane Scale
Storm surge causes most devastating damage; dome of water 65-80km wide that sweeps across coast where hurricane’s eye moves onto land Weakens when it moves over cool ocean waters (decrease in moisture) or land (inc in friction = blockage of air flow)
 or land (inc in friction = blockage of air flow)")
Similar presentations


 Changes in weather are caused by movements of air masses As an air mass moves away, temp & humidity.>")


