Download presentation
Presentation is loading. Please wait.

1
USDA Products and Perspectives OFCM – Phased Array Radar Meeting March 20-21, 2007 Silver Spring, MD By: Eric Luebehusen, Agricultural Meteorologist USDA – Office of the Chief Economist World Agricultural Outlook Board Joint Agricultural Weather Facility By: Eric Luebehusen, Agricultural Meteorologist USDA – Office of the Chief Economist World Agricultural Outlook Board Joint Agricultural Weather Facility

2
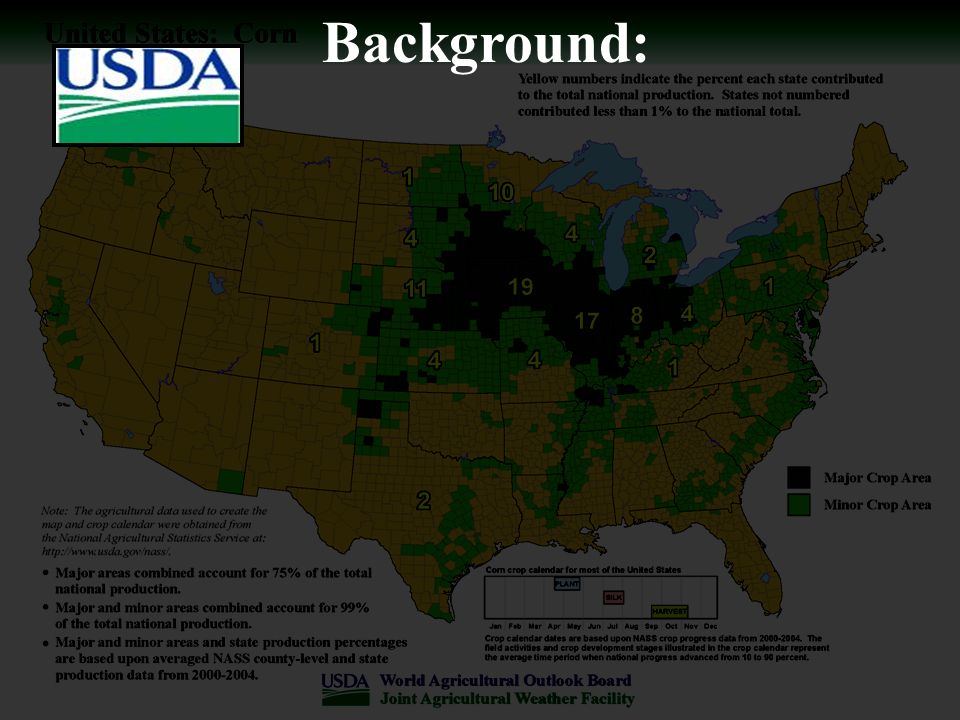
Background:

4
Office of the Chief Economist

5
Background: Office of the Chief Economist (World Agricultural Outlook Board) Office of the Chief Economist
 Office of the Chief Economist")
6
Background: Office of the Chief Economist · Economists/ Commodity Analysts (World Agricultural Outlook Board) Office of the Chief Economist
 Office of the Chief Economist")
7
Background: Office of the Chief Economist Joint Agricultural Weather Facility (JAWF) · 7 Meteorologists · Economists/ Commodity Analysts (World Agricultural Outlook Board) Office of the Chief Economist
 · 7 Meteorologists · Economists/ Commodity Analysts (World Agricultural Outlook Board) Office of the Chief Economist")
8
Background: Office of the Chief Economist Joint Agricultural Weather Facility (JAWF) · 7 Meteorologists · Economists/ Commodity Analysts (World Agricultural Outlook Board) Office of the Chief Economist · 2 Meteorologists, 1 Student Intern
 · 7 Meteorologists · Economists/ Commodity Analysts (World Agricultural Outlook Board) Office of the Chief Economist · 2 Meteorologists, 1 Student Intern")
9
Background: Joint Agricultural Weather Facility (JAWF)
")
10
Background: Joint Agricultural Weather Facility (JAWF) Partnership began in 1940 when the Weather Bureau was transferred from the U.S. Department of Agriculture (USDA) to the Department of Commerce (DOC). Agreement was formalized in 1958 JAWF was created in the late 1970’s as a result of former USSR crop failures and subsequent “Great Grain Robbery”. Staffed by meteorologists from USDA and DOC to provide early alert to potential problem areas. Located at USDA headquarters in Washington, D.C. Joint Agricultural Weather Facility (JAWF)
 to the Department of Commerce (DOC). Agreement was formalized in 1958 JAWF was created in the late 1970’s as a result of former USSR crop failures and subsequent Great Grain Robbery . Staffed by meteorologists from USDA and DOC to provide early alert to potential problem areas. Located at USDA headquarters in Washington, D.C. Joint Agricultural Weather Facility (JAWF).")
11
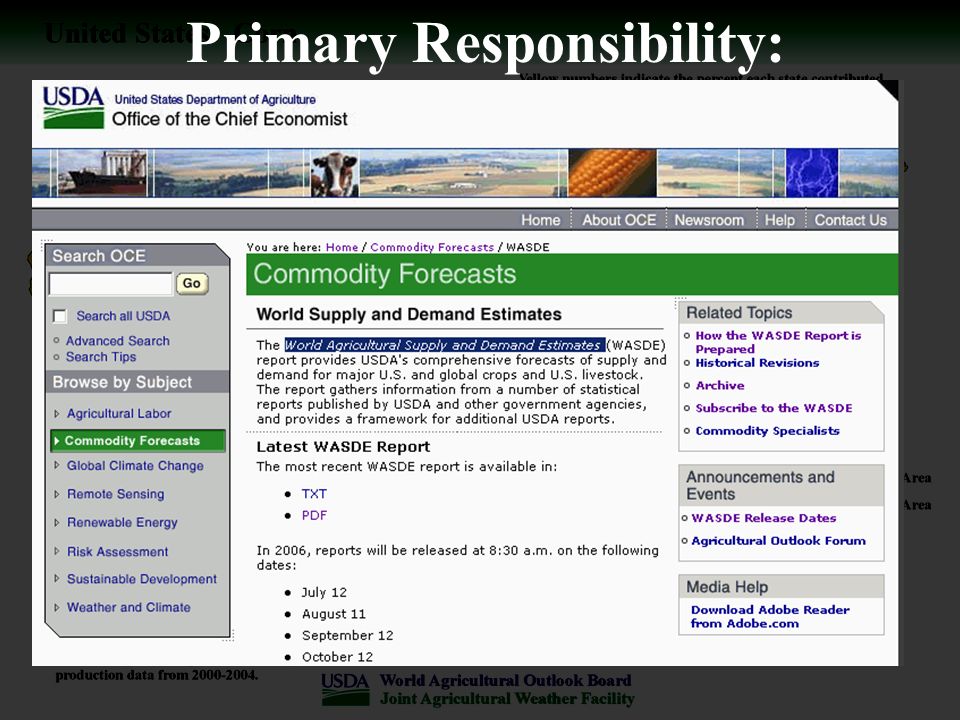
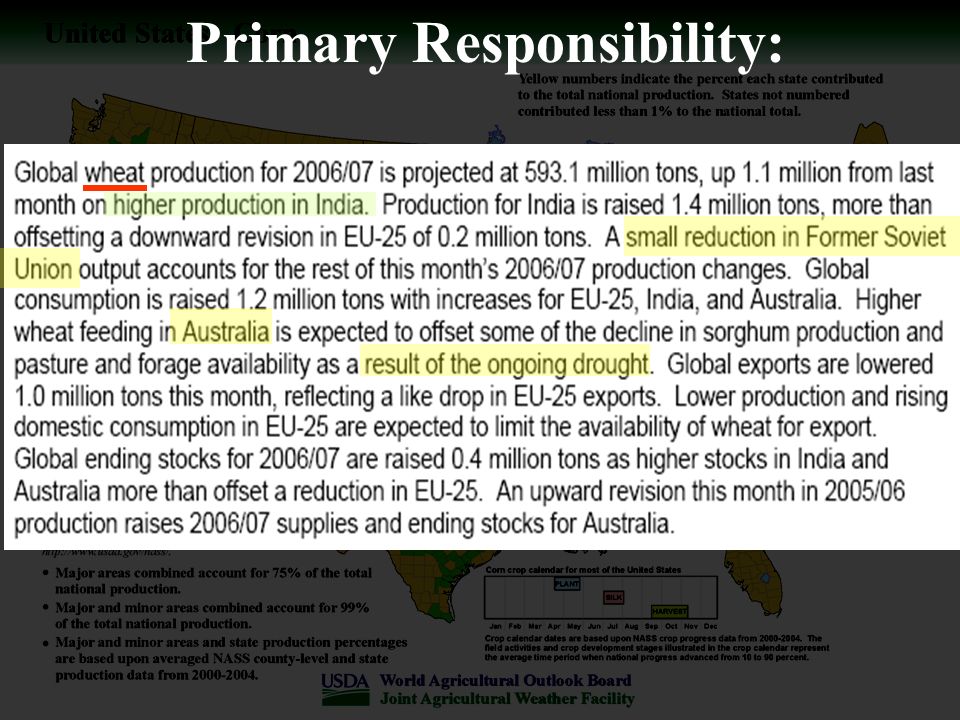
Primary Responsibility:

13
Support Economists in Crop Assessment Decision Making, ultimately helping them develop their Commodity Forecasts (a.k.a. WASDE)
.")
14
Primary Responsibility:

17
WASDE Support (Wx):
:")
18
Meteorologists are called upon to provide detailed Weather-Crop assessments prior to Lock-Up, and radar plays an important role…

19
Radar Products Used @ JAWF Daily Wx Briefings incorporate current composites and loops; In this case (last Tues), monitoring the potential for flood-related fieldwork delays in Texas.
, monitoring the potential for flood-related fieldwork delays in Texas.")
20
Keeping abreast of current conditions via radar at the highest- possible resolution is key to USDA/WAOB operations. Radar data web sites provide a highly-valued service to USDA staff. Radar Products Used @ JAWF

21
60-Day Total Pcp USDA Meteorologists rely heavily on “as-is” products such as these 60-Day precipitation graphics provided by the NWS’s Southern Region Headquarters Precipitation Analysis Products.

22
Radar Products Used @ JAWF 60-Day PNP

23
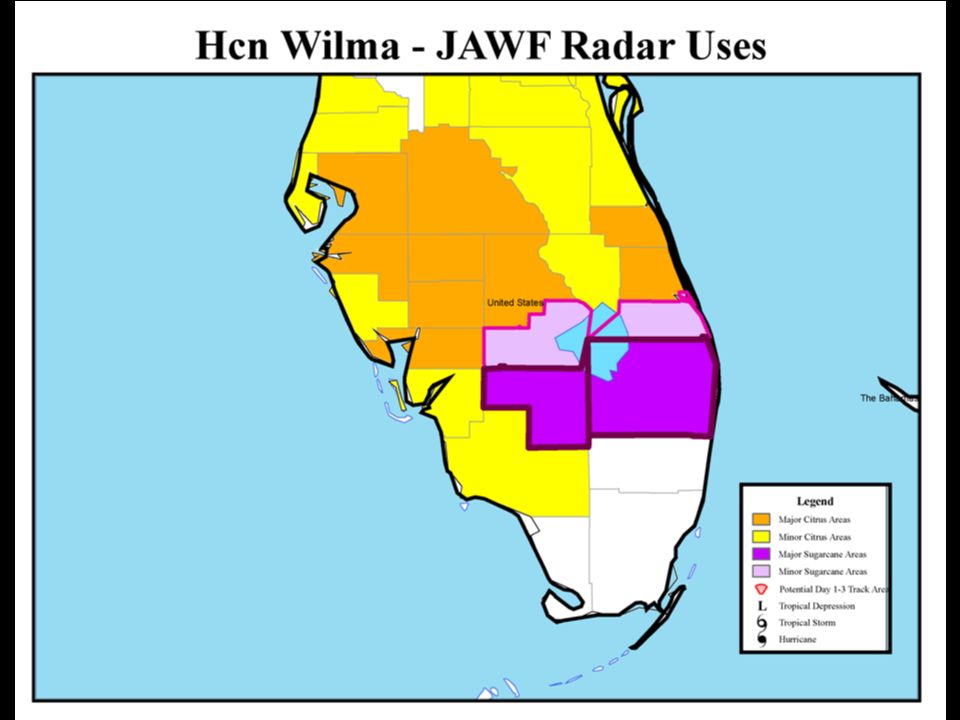
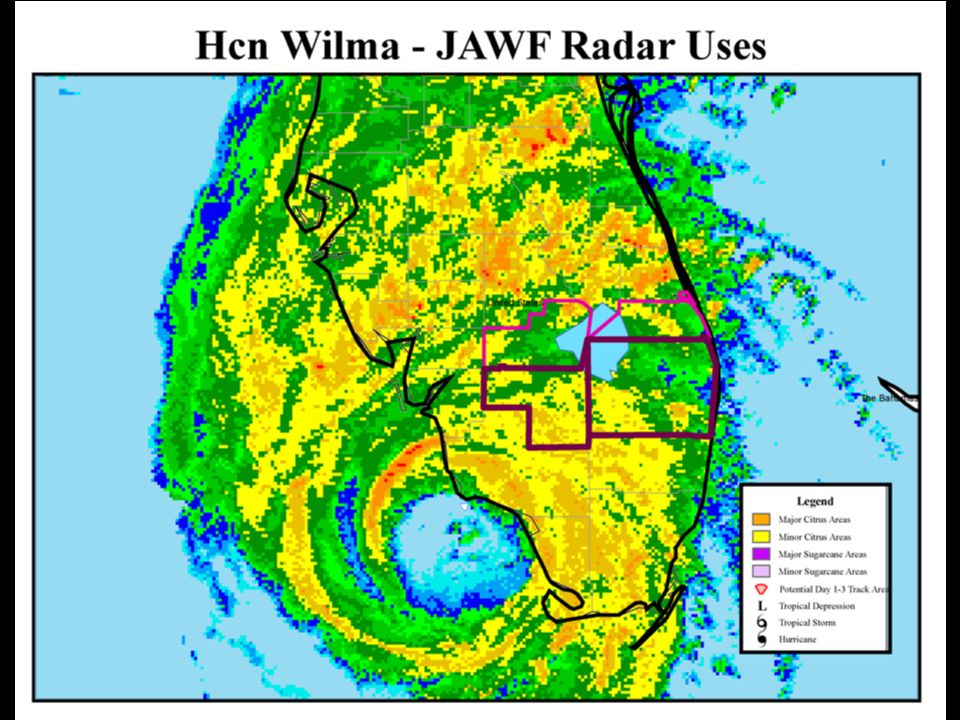
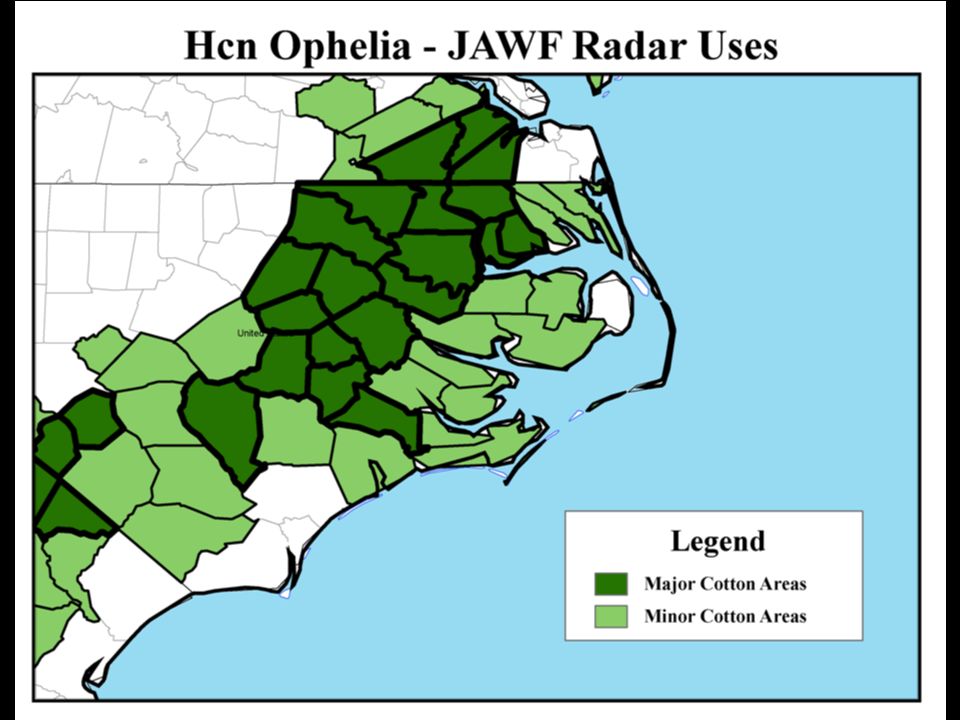
Radar data are also used track tropical cyclones in key agricultural areas… Radar Products Used @ JAWF 60-Day PNP

24
Radar Products Used @ JAWF “Static” imagery provide a good first-guess of potential crop impacts.

25
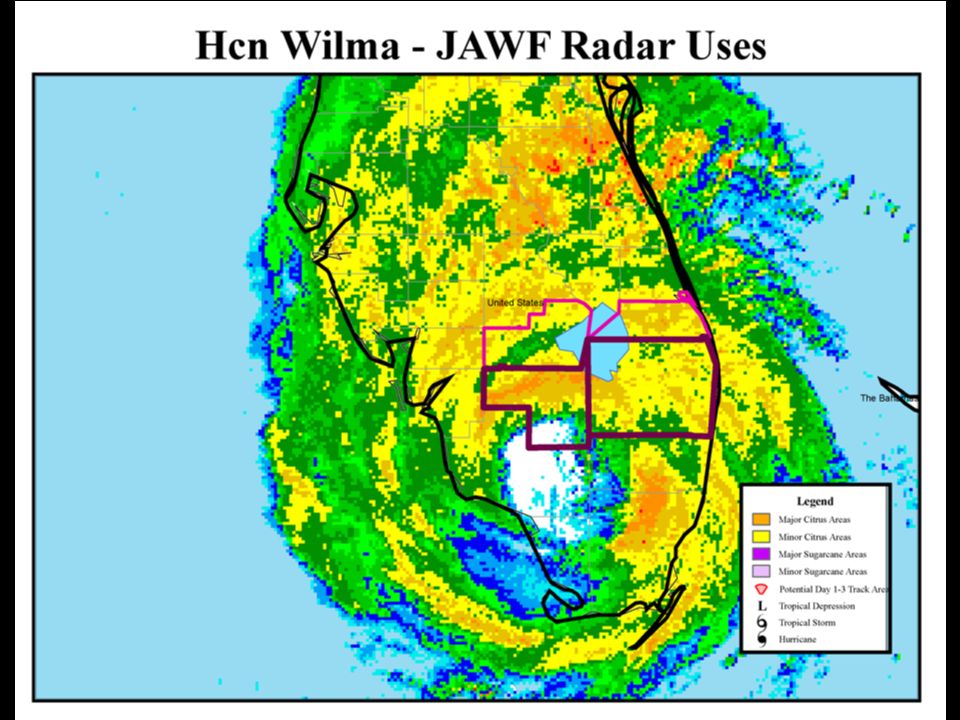
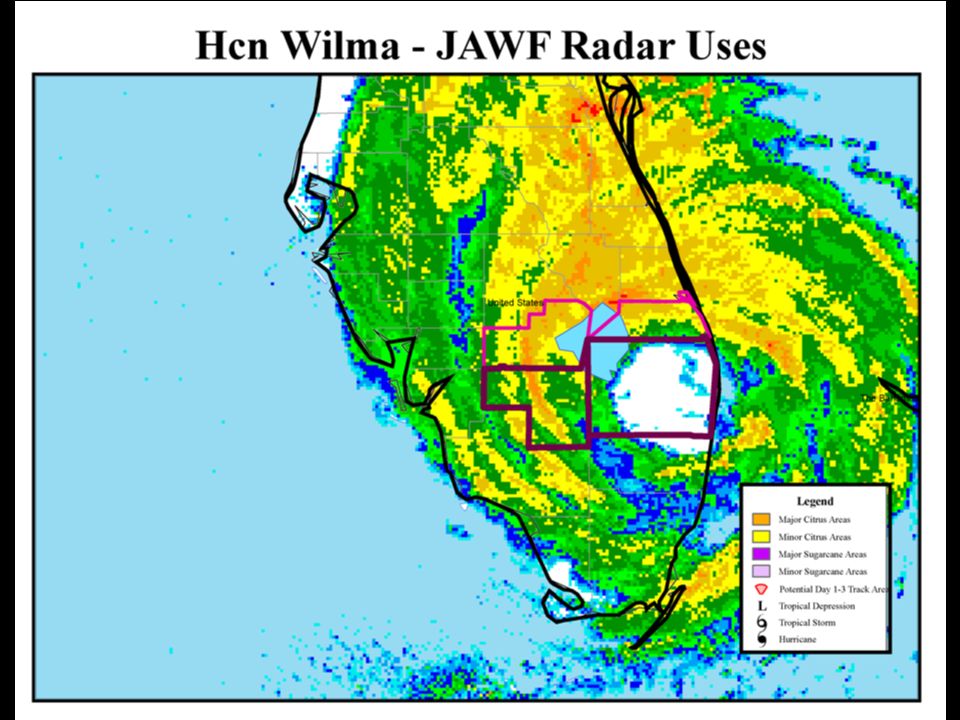
Here, Wilma crosses srn Florida during October, 2005. Radar Products Used @ JAWF

26
Here, Wilma crosses srn Florida during October, 2005. Radar Products Used @ JAWF

27
Here, Wilma crosses srn Florida during October, 2005. Radar Products Used @ JAWF

28
Here, Wilma crosses srn Florida during October, 2005. Radar Products Used @ JAWF

29
Here, Wilma crosses srn Florida during October, 2005. Radar Products Used @ JAWF

30
Here, Wilma crosses srn Florida during October, 2005. Radar Products Used @ JAWF

31
Here, Wilma crosses srn Florida during October, 2005. Radar Products Used @ JAWF

32
Here, Wilma crosses srn Florida during October, 2005. Radar Products Used @ JAWF

33
Here, Wilma crosses srn Florida during October, 2005. Radar Products Used @ JAWF

34
Here, Wilma crosses srn Florida during October, 2005. Radar Products Used @ JAWF

35
Here, Wilma crosses srn Florida during October, 2005. Radar Products Used @ JAWF

36
Here, Wilma crosses srn Florida during October, 2005. Radar Products Used @ JAWF

37
Here, Wilma crosses srn Florida during October, 2005. Radar Products Used @ JAWF

38
Here, Wilma crosses srn Florida during October, 2005. Radar Products Used @ JAWF

39
Here, Wilma crosses srn Florida during October, 2005. Radar Products Used @ JAWF

40
Here, Wilma crosses srn Florida during October, 2005. Radar Products Used @ JAWF

41
Here, Wilma crosses srn Florida during October, 2005. Radar Products Used @ JAWF

42
Here, Wilma crosses srn Florida during October, 2005. Radar Products Used @ JAWF

43
Here, Wilma crosses srn Florida during October, 2005. Radar Products Used @ JAWF

44
Here, Wilma crosses srn Florida during October, 2005. Radar Products Used @ JAWF

45
Here, Wilma crosses srn Florida during October, 2005. Radar Products Used @ JAWF

46
Here, Wilma crosses srn Florida during October, 2005. Radar Products Used @ JAWF

47
Here, Wilma crosses srn Florida during October, 2005. Radar Products Used @ JAWF

48
Here, Wilma crosses srn Florida during October, 2005. Radar Products Used @ JAWF

49
Here, Wilma crosses srn Florida during October, 2005. Radar Products Used @ JAWF

50
Here, Wilma crosses srn Florida during October, 2005. Radar Products Used @ JAWF

51
Here, Wilma crosses srn Florida during October, 2005. Radar Products Used @ JAWF

52
But there is a need to do more than just “look” at imagery, which is where GIS comes in to play... Radar Products Used @ JAWF

53
But there is a need to do more than just “look” at imagery, which is where GIS comes in to play... Radar Products Used @ JAWF

64
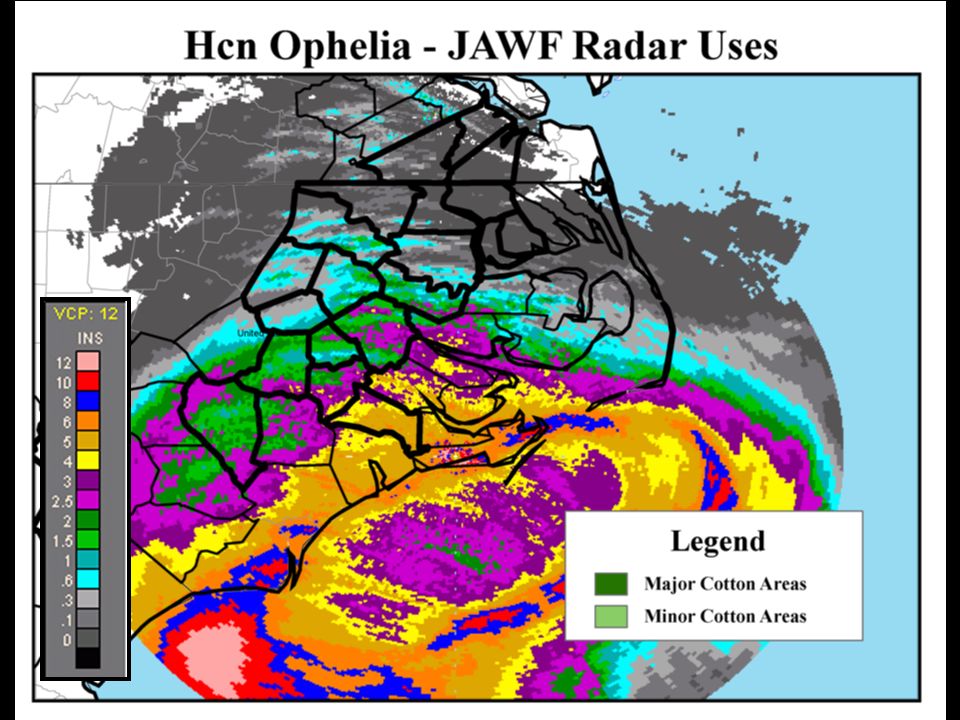
Geo-referenced radar data allowed USDA staff to assess problem areas and potential crop impacts. Here, the track of the storm’s center likely caused lodging of mature, unharvested sugarcane.

65
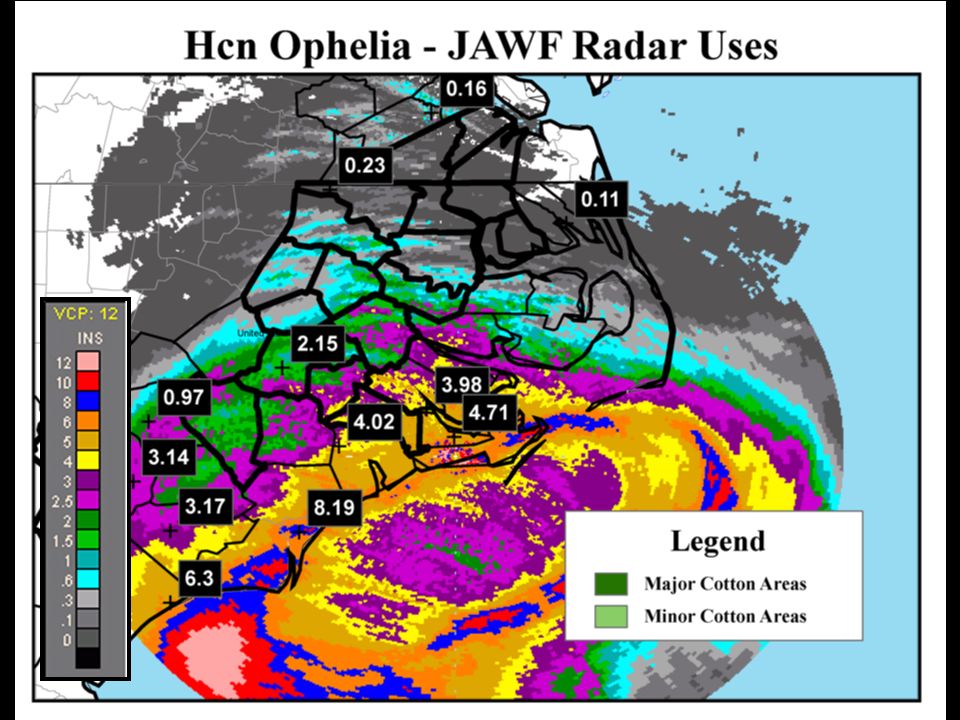
In addition, GIS-ready data allow for simple calculations (such as this summation) to further highlight potential problem areas.
 to further highlight potential problem areas.")
66
In many cases, radar data fills in the gaps between station observations. In this case, it provided evidence of what “didn’t” happen.

70
WASDE Support (Wx): JAWF has become very much GIS- Driven, and the more products which are GIS ready, the better!
: JAWF has become very much GIS- Driven, and the more products which are GIS ready, the better!")
71
WASDE Support (Wx): Products like these are used frequently by top-level USDA staff.
: Products like these are used frequently by top-level USDA staff.")
72
Summary Real-time data are used daily, in briefings given by NWS staff and by USDA meteorologists.

73
Summary Archives of static imagery are useful for preliminary assessments.

74
Summary Archives of geo-referenced imagery are even more useful for crop-weather assessments.

75
Summary Radar products, often enhanced and customized in-house, are a key component in many of the graphics presented to USDA upper-level management.

Similar presentations


 Contaminated.>")


 Enhancements.>")
 Lack of a research plan Zero teaching (2 meteorologists university level).>")
 Briefing.>")
